Workforce Characteristics, Perceptions,
Stress, and Satisfaction among Staff in
Green House and Other Nursing Homes
Patrick B. Brown, Sandra L. Hudak, Susan D. Horn,
Lauren W. Cohen, David Allen Reed, and Sheryl Zimmerman, for
the THRIVE Research Collaborative
aObjective. To compare workforce characteristics and staff perceptions of safety,
satis-faction, and stress between Green House (GH) and comparison nursing homes (CNHs).
Data Sources/Study Setting. Primary data on staff perceptions of safety, stress, and
satisfaction from 13 GHs and 8 comparison NHs in 11 states; secondary data from human resources records on workforce characteristics, turnover, and staffing from 01/ 01/2011–06/30/2012.
Study Design. Observational study.
Data Collection Methods. Workforce data were from human resources offices; staff
perceptions were from surveys.
Principal Findings. Few significant differences were found between GH and CNHs.
Exceptions were GH direct caregivers were older, provided twice the normalized hours per week budgeted per resident than CNAs in CNHs or Legacy NHs, and trended toward lower turnover.
Conclusions. GH environment may promote staff longevity and does not negatively
affect worker’s stress, safety perceptions, or satisfaction. Larger studies are needed to confirmfindings.
Key Words. Nursing home workforce characteristics, Green House homes, safety
culture, stress, and satisfaction, staff turnover
Much research on staff type and staffing ratios in nursing homes suggests that staffing has important effects on quality of care for residents (Bowers, Esmond, and Jacobson 2000; Harrington et al. 2000; Horn et al. 2005; Castle 2008). However, little research has compared nurse and certified nurse assistant (CNA) staffing data in Green House (GH) homes with other nursing homes (NHs), with two exceptions. One study found that CNAs in GHs spent more time on direct care with residents than CNAs in traditional nursing homes (Sharkey et al.
©Health Research and Educational Trust DOI: 10.1111/1475-6773.12431
SPECIAL ISSUE–GREEN HOUSE MODEL OF NURSING HOME CARE
418
2011), while another identified different roles taken by nurses in GH (such as the
“visitor”role) compared to other NHs (Bowers and Nolet 2011).
There is reason to expect staffing-related differences in GHs. They differ from other homes in organizational and staffing structures (e.g., small scale, self-empowered work teams; Doty, Koren, and Sturla 2008; Bowers and Nolet 2014; Cohen et al. 2016). Also, GH staff are newer to their positions (given the recency of the model) and they generally have transferred to these positions; consequently, they might exhibit higher turnover if they find the model incompatible with their style, as nurses are not uniformly supportive of staffing roles in GHs (Bowers and Nolet 2014). For similar reasons, it may be expected that staff in GHs have different experiences and perceptions—such as related tofloating, satisfaction, stress, and the care environment—than those in other NHs (Bowers, Esmond, and Jacobson 2000). If consistent differences exist, they could drive future research to determine the cause and potential impact of these differences on quality of care. This brief report uses data from 13 GHs and 8 comparison nursing homes to draw preliminary conclusions about dif-ferences in staffing hours, turnover, and staff experiences and perceptions, and to suggest areas for future research.
M
ETHODS
Green House organizations with at least one home that housed residents as of December 31, 2010 were recruited in 11 states; comparison nursing homes (CNHs) were selected within the same vicinity (urban/rural) and state, based on similarity of organization bed size, ownership status, and number of inspec-tion deficiencies reported in Nursing Home Compare (Center for Medicare & Medicaid Services [CMS] 2014). From each organization, two long-term care
Address correspondence to Susan D. Horn, Ph.D., Department of Population Health Sciences, Health System Innovation and Research Program, University of Utah School of Medicine, 295 Chipeta Way, Rm 1N461, Salt Lake City, UT 84108; e-mail: [email protected]. Patrick B. Brown, B.S., is with the International Severity Information Systems, Inc., Salt Lake City, UT. Sandra L. Hudak, R.N., M.S.N., is with the SLH Clinical Consulting, Scottsdale, AZ. Lauren W. Cohen, M.A., and David Allen Reed, Ph.D., are with the Cecil G. Sheps Center for Health Ser-vices Research, University of North Carolina at Chapel Hill, Chapel Hill, NC. Sheryl Zimmer-man, Ph.D., is with the Cecil G. Sheps Center for Health Services Research, School of Social Work, University of North Carolina at Chapel Hill, Chapel Hill, NC.
aThe THRIVE Research Collaborative includes Barbara Bowers, Patrick Brown, Lauren Cohen,
units were selected at random, yielding a sample of 26 GH units (from 13 orga-nizations) and 15 CNH units (from 8 CNHs; one CNH had only one unit). Data were collected for two units, as opposed to the entire home, because data were collected from sites that were part of a larger study; data also were obtained for legacy NHs (the original nursing home that remains open along-side its GH). Further details comparing study facilities are presented else-where (Cohen et al. 2016). The study was approved by IRBs at the University of Utah and University of North Carolina.
Data were collected to describe the workforce (age, gender, tenure, pay rates), turnover, staffing hours, and staff perceptions of safety, stress, and satis-faction. All data on staffing and workforce characteristics were provided by NH human resources employees based on facility records. Staff perceptions of safety, stress, and satisfaction data were obtained from anonymous ques-tionnaires completed by direct care staff (CNAs in CNHs and their counter-parts,Shahbazimin GHs) and nurses (RNs and LPNs). Questions related to employee background and work history (e.g., tenure at present organization and time working in long-term care) as well as scales from established mea-sures. Questionnaires and an envelope were distributed by an NH liaison; staff were requested to complete the survey, put it into a sealed envelope, and return the sealed envelope to the liaison who mailed the envelopes to the study office. The following constructs were measured:
Work Stress
The modified Work Stress Inventory (Schaefer and Moos 1996) was used to measure respondents’stress related to events, resident care, and workload and scheduling. Items referred to the last 30 days, and asked, for example:“How often have you had to do tasks for which you have little or no training?”;
“How often have you cared for a resident who was uncooperative, angry, or complaining?”; and“How often have you had to work with staff who are inex-perienced and poorly trained?”Other studies using this measure found higher stress in the subscale related to caring for residents (Zimmerman et al. 2005) and concerns related to morale, job satisfaction, and intent to stay on the job (Schaefer and Moos 1996).
Safety Perceptions
questions about teamwork, compliance with procedures, training, handoffs, communication, and perceptions of resident safety. Studies using this measure found that safety culture was associated with clinical outcomes (Bonner et al. 2009), and that NH staff had few positive opinions of their work environment, reporting, for example, insufficient staffing and poor communication among staff (Castle et al. 2010).
Staff Satisfaction
Items regarding satisfaction were obtained from the National Nursing Assis-tant Survey, thefirst national study of CNAs working in U.S. NHs (Squillace et al. 2007; Bishop et al. 2009). Five items from the survey were used for this study (see Table 4). Studies using this instrument found correlations between CNAs’satisfaction and training (Han et al. 2014) and correlations with organi-zational climate, supervision, and perceptions of being valued (Probst, Baek, and Laditka 2010).
Analysis
The unit of analysis for most results is the GH or CNH, but in some cases it is the employee. Descriptive statistics and bivariate associations were used to compare staff characteristics between and within settings. Two samplet-tests, Wilcoxon tests, analysis of variance, or Kruskal–Wallis tests were used for con-tinuous data, and chi-square or Fisher exact tests were computed for count data.
Staff Hours Per Resident Day. Normalized hours for RNs, LPNs, and CNAs/ Shahbazim were calculated by taking hours budgeted per week (not actual hours) and dividing by the number of bed-days in a week (number of beds multiplied by total days in a week).
type employed in that year (average of the number employed on January 1 of yearXand January 1 of yearX+ 1).
Work Stress. Three subscales included 4–8 items each, scored 1–5 (never to often). An average score was computed for each respondent, and then the mean and standard deviation (SD) for all staff in GH versus CNH settings were calculated.
Safety Culture (Higher Percentages Indicate More Perceived Resident Safety). Each subscale included 3–5 items, scored 1–5 (strongly disagree to strongly agree or never to always). For each subscale, percent positive response was calculated per GH or CNH as follows: if a question was positively worded, 4 or 5 was considered a positive response; if it was negatively worded, 1 or 2 was consid-ered a positive response. Positive responses were added and divided by the total number of responses for that subscale for the GH or CNH. We then cal-culated a mean and SD for two types of settings: GHs and CNHs.
Satisfaction. As above, mean and SD were calculated for each item, and distri-butions were compared for staff working in GHs versus CNHs.
Comparison with National Data. To compare our sample respondents to national nursing home data on age and gender of CNAs and RNs, we used data from the National Nursing Assistant Survey and National Sample Survey of Registered Nurses, respectively. National data for LPNs were not readily available. We calculated an absolute difference in percentages of each distribu-tion for gender and age, and considered differences under 5 percent to be immaterial; between 5 and 10 percent to be minor; and greater than or equal to 10 percent to be important (Corrigan et al. 2012; Cuthbert et al. 2012).
R
ESULTS
Staffing and Workforce Characteristics
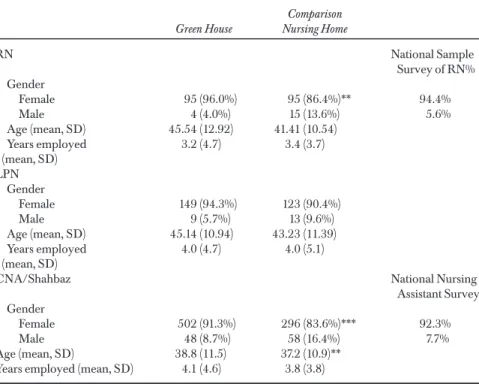
average age from 37 to 46 years, and GH Shahbazim were significantly older than their CNH counterparts (mean age 38.8 vs. 37.2). When comparing staff gender and age with national data, the majority of differences were immate-rial, although GH CNAs were older and LPNs and RNs younger than national samples (see Appendix).
The mean and SD for full-time positions and proportionate hours/resi-dent day by position in GHs versus CNHs are presented in Table 2. Most staff was full time in all positions and across settings. Wages did not differ signifi -cantly between settings, although the average hourly wage for Shahbazim in GHs was approximately $0.60/hour more than the average for CNAs in the legacy home and $0.25 more than CNHs. The only statistically significant dif-ference was that GH Shahbazim had twice the normalized hours per week budgeted per resident than CNAs in CNHs or Legacy NHs.
Table 1: Comparison of Workforce Characteristics by Staff Position between Green House and Comparison Nursing Homes, and National Data, Where Available
Green House
Comparison Nursing Home
RN National Sample
Survey of RN% Gender
Female 95 (96.0%) 95 (86.4%)** 94.4% Male 4 (4.0%) 15 (13.6%) 5.6% Age (mean, SD) 45.54 (12.92) 41.41 (10.54)
Years employed (mean, SD)
3.2 (4.7) 3.4 (3.7) LPN
Gender
Female 149 (94.3%) 123 (90.4%) Male 9 (5.7%) 13 (9.6%) Age (mean, SD) 45.14 (10.94) 43.23 (11.39) Years employed
(mean, SD)
4.0 (4.7) 4.0 (5.1)
CNA/Shahbaz National Nursing Assistant Survey Gender
Female 502 (91.3%) 296 (83.6%)*** 92.3% Male 48 (8.7%) 58 (16.4%) 7.7% Age (mean, SD) 38.8 (11.5) 37.2 (10.9)**
Years employed (mean, SD) 4.1 (4.6) 3.8 (3.8)
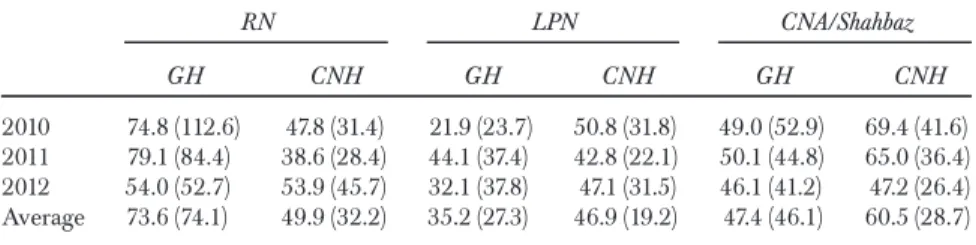
Table 3 presents mean and SD of turnover by year from 2010 to 2012 in GH and CNHs. Consistent with previousfindings, annual turnover for nurses and direct care staff was high across all years (American Health Care Associa-tion [AHCA] 2011). Although no differences by staff type and by GH and CNH were statistically significant, GHs had lower turnover for CNAs and LPNs.
Table 2: Comparison of Salary and Hours by Staff Position between Green House, Legacy, and Comparison Nursing Homes
Green House Mean (SD)
Legacy Mean (SD)
Comparison Nursing Home Mean (SD)
RN
% Full-time RN 72.5% (26.3) 64.4% (28.5) 78.4% (37.4) RN hours per resident day 0.72 (0.48) 0.48 (0.24) 0.48 (0.24) Average RN hourly wage $23.60 (3.57) $23.10 (3.11) $23.00 (3.10) High RN hourly wage $28.11 (2.15) $29.30 (2.91) $28.33 (3.93) LPN
% Full-time LPN 83.3% (28.9) 72.2% (16.5) 86.5% (23.4) LPN hours per resident day 0.96 (0.48) 0.72 (0.48) 0.96 (0.00) Average LPN hourly wage $17.82 (3.09) $17.30 (3.50) $19.00 (3.74) High LPN hourly wage $22.27 (3.10) $22.50 (2.99) $25.40 (5.55) CNA
% Full-time CNA 77.6% (28.6) 73.2% (16.5) 86.6% (19.0) CNA hours per resident day 4.20 (0.96) 2.16 (0.96) 2.16 (1.44)** Average CNA/Shahbaz hourly
wage
$10.92 (1.31) $10.30 (1.34) $10.67 (2.34) High CNA/Shahbaz hourly wage $14.25 (2.26) $14.30 (1.57) $15.80 (2.39)
**p≤.05.
Table 3: Turnover Percent by Year by Staff Position in Green House (GH) and Comparison Nursing Homes: Mean (SD)*
RN LPN CNA/Shahbaz
GH CNH GH CNH GH CNH
Staff Perceptions of Stress, Safety, and Satisfaction
A total of 48 RNs (17 in GHs [37 percent response rate] and 31 in CNHs [46 percent response rate]; 43 percent overall response rate), 81 LPNs (51 in GHs [53 percent response rate] and 30 in CNHs [27 percent response rate]; 39 cent overall response rate), and 235 CNAs/Shahbazim (158 in GHs [44 per-cent response rate] and 77 in CNHs [26 perper-cent response rate]; 35 perper-cent overall response rate) completed the staff survey. Responders were similar in age and gender to overall staff, based on information provided by human resources. Data are presented by staff position and setting in Table 4 (more detailed breakdown in Appendix). Perceptions related to safety culture and satisfaction indicated a generally favorable view across all disciplines and set-tings. LPNs from GHs indicated significantly less compliance with procedures and less training and skills compared to those from CNHs.
Regarding satisfaction, LPNs preferred working in a CNH setting. LPNs in GHs were less likely to recommend friends and family receive care at their facility, and they were less satisfied with their current job. However, they also indicated that staff absences created less interference if working in a GH com-pared to a CNH. Shahbazim also reported more positively on their ability to do their job in the event of unexpected absences than CNAs in CNHs. While not statistically significant, RNs also reported more positively in GHs. Finally, there were no significant differences between GHs and CNHs by staff position related to stress, and, as found in other work, there was more stress related to caring for residents than in the other two domains: work events, and work load and scheduling (Zimmerman et al. 2005). However, RNs and LPNs experi-enced significantly more stress than CNAs/Shahbazim in some areas: in GHs, RNs had more work event stress, and LPNs had more work load and schedul-ing stress than CNAs/Shahbazim; in CNHs, RNs reported more stress in all areas compared to LPNs and CNAs/Shahbazim, and LPNs reported more stress in caring for residents than CNAs/Shahbazim.
D
ISCUSSION
these were small and likely not meaningful. Indeed, average age of direct care-givers in GHs (39) was the same as that observed in national samples of CNAs, as is percent of female workers (91 percent our sample of GHs and 92 percent nationally) (Squillace et al. 2007).
Direct caregivers were paid between $10.30 (legacy) and $10.92 (GH) per hour; in CNHs, CNAs hourly wage was $10.67. Although not significant, it is notable that GH caregivers made an average of $0.60/hour more than their counterparts in the legacy home, and also $0.25/hour more than caregivers in CNHs, likely a result of the GH model, suggesting Shahbazim should be more highly compensated due to additional work responsibilities. The fact that GH Shahbazim had roughly twice the normalized hours per week budgeted per res-ident reflects the GH model of staffing where Shahbazim not only take care of resident needs but also do laundry, plan and make meals, do light housework, and manage staff schedules. Thisfinding is consistent with research from Shar-key et al. (2011), cited above, that found 1.56 more Shahbazim“hours per resi-dent day”in GHs than CNA hours per resident day in traditional NHs.
Although differences were not statistically significant, CNA/Shahbaz and LPN turnover trended lower in GHs compared to CNHs. Thisfinding may relate to higher wages noted above, and also that the GH model creates an environment in which employees appreciate being more involved in decision making, a key factor in caregiver retention (Zhang, Punnett, and Gore 2014). While self-mana-ged work teams that characterize GHs may not always function optimally (Zim-merman and Cohen 2010; Bowers et al. 2016), the possible association between empowerment structures and lower turnover in GHs (even with similar levels of stress and satisfaction as in traditional NHs) merits further study. Also, the struc-ture of GHs allows more flexibility, especially for CNAs, which also may con-tribute to lower turnover (Castle and Engberg 2005; Wiener et al. 2009).
Regarding differences noted between GHs and CNHs in responses to the question about staff absences, this may be attributed to the scheduling pro-cess at GHs: Shahbazim manage their own schedules, they are prepared to make adjustments as needed (unlike in CNHs), and as LPNs are not involved in scheduling in GHs, they may be less likely to perceive interruptions due to unexpected staffing absences.
Limitations and Next Steps
Limitations of this study include a relatively small sample size compared to other studies of nursing home workforce as well as potential biases due to a low survey response rate. Consequently, results should be considered sugges-tive and those that are most relevant—such as staff turnover—merit additional study. Also, staff floating, mostly of nurses, could impact results if records incorrectly classified their primary work location (in GH and CNHs, stafffloat across units in 73 and 87 percent of homes, respectively), and also because suchfloating and seasonality may affect the precision of staff hours per resi-dent day.
A
CKNOWLEDGMENTS
Joint Acknowledgment/Disclosure Statement: This project was supported by the Robert Wood Johnson Foundation as part of the evaluation of the Green House Project. RWJF grant ID#: 69733. Title: Assessing turnover in manage-ment and staff at Green House homes compared with other skilled nursing facilities. We acknowledge the contribution of the late Siobhan S. Sharkey, MBA, whose dedication and commitment to improving the quality of life for elders in the nursing home environment was instrumental in the vision and success of the component of the THRIVE project reported in this manuscript.
Disclosures: None.
Disclaimers: None.
R
EFERENCES
Agency for Healthcare Research and Quality [AHRQ]. 2014.“Nursing Home Survey on Patient Safety Culture”[accessed December 11, 2014]. Available at http:// www.ahrq.gov/professionals/quality-patient-safety/patientsafetyculture/nursing-home/index.html
American Health Care Association [AHCA]. 2011.“Staffing Survey Report”[accessed December 8, 2014]. Available at http://www.ahcancal.org/research_data/staff-ing/Documents/2011 Nursing Facility Staffing Survey.pdf
Bishop, C. E., M. R. Squillace, J. Meagher, W. L. Anderson, and J. M. Wiener. 2009. “Nursing Home Work Practices and Nursing Assistants’Job Satisfaction.”The
Gerontologist49 (5): 611–22. doi:10.1093/geront/gnp040.
Relationship to Clinical Outcomes?”Journal of the American Medical Directors
Asso-ciation10 (1): 11–20.
Bowers, B. J., S. Esmond, and N. Jacobson. 2000.“The Relationship between Staffing and Quality in Long-Term Care Facilities: Exploring the Views of Nurse Aides.”
Journal of Nursing Care Quality14 (4): 55–64.
Bowers, B., and K. Nolet. 2011.“Empowering Direct Care Workers: Lessons Learned from THE GREEN HOUSE Model.” Seniors Housing & Care Journal19 (1): 109–20.
Bowers, B. J., and K. Nolet. 2014.“Developing the Green House Nursing Care Team: Variations on Development and Implementation.”Gerontologist54 (Suppl 1): S53–64. doi:10.1093/geront/gnt109.
Bowers, B., K. Nolet, T. Roberts, B. Ryther, for the THRIVE Research Collaborative. 2016.“Inside the Green House ‘Black Box’: Opportunities for High Quality Clinical Decision Making.”Health Services Research. 51 (1 Pt 2): 378–97.
Castle, N. G. 2008.“Nursing Home Caregiver Staffing Levels and Quality of Care: A Literature Review.”Journal of Applied Gerontology27: 375–405.
Castle, N. G., and J. Engberg. 2005.“Staff Turnover and Quality of Care in Nursing Homes.”Medical Care43 (6): 616–26.
Castle, N. G., L. M. Wagner, S. Perera, J. C. Ferguson, and S. M. Handler. 2010. “Assessing Resident Safety Culture in Nursing Homes: Using the Nursing Home Survey on Resident Safety.”Journal of Patient Safety6 (2): 59–67.
Center for Medicare & Medicaid Services [CMS]. 2014.“Nursing Home Compare” [accessed on December 11, 2014]. Available at http://www.medicare.gov/nurs-inghomecompare/search.html
Cohen, L. W., S. Zimmerman, D. Reed, P. B. Brown, B. J. Bowers, K. Nolet, S. L. Hudak, S. D. Horn, for the THRIVE Research Collaborative. 2016.“The Green House Model of Nursing Home Care in Design and Implementation.”Health
Services Research. 51 (1 Pt 2): 352–77.
Corrigan, J. D., J. P. Cuthbert, G. G. Whiteneck, M. P. Dijkers, V. Coronado, A. W. Heinemann, C. Harrison-Felix, and J. E. Graham. 2012.“Representativeness of the Traumatic Brain Injury Model Systems National Database.”Journal of Head
Trauma Rehabilitation27: 391–403.
Cuthbert, J. P., J. D. Corrigan, G. G. Whiteneck, C. Harrison-Felix, J. E. Graham, J. M. Bell, and V. G. Coronado. 2012.“Extension of the Representativeness of the Traumatic Brain Injury Model Systems National Database: 2001 to 2010.”
Jour-nal of Head Trauma Rehabilitation27: E15–27.
Doty, M. M., M. J. Koren, and E. L. Sturla. 2008. “Culture Change in Nursing Homes: How Far Have We Come?”[accessed December 8, 2014]. Available at http://www.commonwealthfund.org/publications/fund-reports/2008/may/cul-ture-change-in-nursing-homes--how-far-have-we-come--fi ndings-from-the-common-wealth-fund-2007-national survey of nursing homes
Sec-ondary Data Analysis.”International Journal of Nursing Studies51 (8): 1135–41. doi:10.1016/j.ijnurstu.2013.12.008.
Harrington, C., D. Zimmerman, S. L. Karon, J. Robinson, and P. Beutel. 2000.“ Nurs-ing Home Staffing and Its Relationship to Deficiencies.”The Journals of
Gerontol-ogy: Series B55 (5): S278–87.
Horn, S. D., P. Buerhaus, N. Bergstrom, and R. J. Smout. 2005.“RN Staffing Time and Outcomes of Long-Stay Nursing Home Residents: Pressure Ulcers and Other Adverse Outcomes Are Less Likely as RNs Spend More Time on Direct Patient Care.”American Journal of Nursing105 (11): 58–70.
Probst, J. C., J. D. Baek, and S. B. Laditka. 2010.“The Relationship between Workplace Environment and Job Satisfaction among Nursing Assistants: Findings from a National Survey.”Journal of the American Medical Directors Association11 (4): 246– 52.
Schaefer, J. A., and R. H. Moos. 1996.“Effects of Work Stressors and Work Climate on Long-Term Care Staff’s Job Morale and Functioning.”Research in Nursing and
Health19: 63–73.
Sharkey, S. S., S. L. Hudak, S. D. Horn, R. James, and J. Howes. 2011.“Front-Line Caregiver Daily Practices: Comparison Study of Traditional Nursing Homes and the Green HouseâProject Sites.”Journal of the American Geriatrics Society59 (1): 126–31.
Squillace, M. R., R. E. Remsburg, A. Bercovitz, E. Rosenoff, and L. Branden. 2007.“An Introduction to the National Nursing Assistant Survey.”Vital Health Statistics1 (44): 1–54.
Wiener, J. M., M. R. Squillace, W. L. Anderson, and G. Khatutsky. 2009.“Why Do They Stay? Job Tenure among Certified Nursing Assistants in Nursing Homes.”
The Gerontologist49 (2): 198–210. doi:10.1093/geront/gnp027.
Zhang, Y., L. Punnett, R. Gore, The CPH-NEW Research Team. 2014.“Relationships among Employees’Working Conditions, Mental Health, and Intention to Leave in Nursing Homes.”Journal of Applied Gerontology33 (1): 6–23.
Zimmerman, S., and L. W. Cohen. 2010.“Evidence behind the Green House and Simi-lar Models of Nursing Home Care.”Aging Health6 (6): 731–51.
Zimmerman, S., C. S. Williams, P. S. Reed, M. Boustani, J. S. Preisser, E. Heck, and P. D. Sloane. 2005.“Attitudes, Stress, and Satisfaction of Staff Who Care for Resi-dents with Dementia.”The Gerontologist45 (Spec No 1): 96–105.
S
UPPORTING
I
NFORMATION
Additional supporting information may be found in the online version of this article:
Appendix SA1: Author Matrix.
Table S2. Direct Care Worker Survey Scales.