Event Log Summary Report
EVENT LOG SUMMARY REPORT... 1
Overview ... 1
Previewing the Event Log Summary Report ... 1
Sample Report ... 2
Document Revision History ... 6
Overview
The Event Log Summary report lists the ten most common event log entries for each agent computer, as well as all error event log entries for the past 24 hours. This report can be run for all clients or by client, location, computer type, computer or group.
The purpose of this document is to show you how to use the report specific filters and how to understand the data provided by the report. A sample page of the report is included at the end of this document with each section explained separately.
NOTE: If you are running the report and you do not have full access to all clients (clients, computers and locations) the report will only show information for what you have permission to access.
Previewing the Event Log Summary Report
The Event Log Summary report can be scheduled to run at specific times or it can be run manually. To run the report manually, right-click on the client, location or group from the navigation tree and select View Report > Monitor Events > EventLog Summary. However, it is recommended that all reports be scheduled by using the Report Manager. For step-by-step instructions on scheduling reports, refer to the Scheduling/Printing Reports documentation.
To preview the Event Log Summary report, follow the steps listed below:
1. From the Control Center, select Tools > Reporting > Report Manager.
2. Expand Monitors & Events on the navigation tree and then select
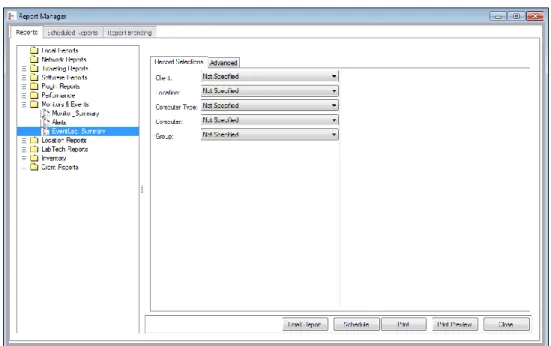
Figure 1: Event Log Summary Setup
3. Select the Client, Location, Computer Type, Computer or Group from the drop-downs. For all clients, leave all of these fields at the default setting of ‘Not Specified’.
4. Click on the Print Preview button to preview the report. If you wish to print without previewing the report, click on the Print button. To email the report as a PDF attachment, click the Email Report button and complete the email form, as necessary. Otherwise, to schedule the report to run for a later or recurring date and time, click on the Schedule button.
Sample Report
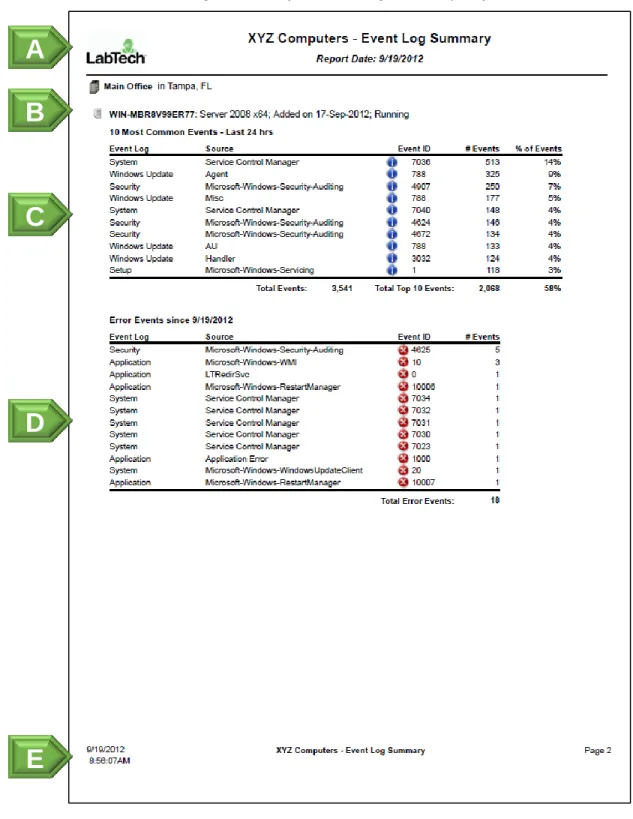
The Event Log Summary report lists the ten most common event log entries for each agent computer, as well as all error event log entries for the past 24 hours. This report can be grouped and filtered using the controls in the Report Manager.
Figure 2: Sample Event Log Summary Report
A
B
C
D
Figure 3: Report Legend
NOTE: Each section of the above report has been extracted (indicated by the letters to the left of the report) to provide a clearer view of the information. These extracted sections are shown below.
Figure 4: Section A—Report Header
The Report Header (section A) will display the client name, report title, your company logo and the date the report was printed.
Figure 5: Section B—Agent/Location Information
The Location/Agent Information section (section B) displays the location, the name of the computer, the OS, the date it was added to LabTech and how long it has been online. Each agent will appear on its own page.
A
B
F
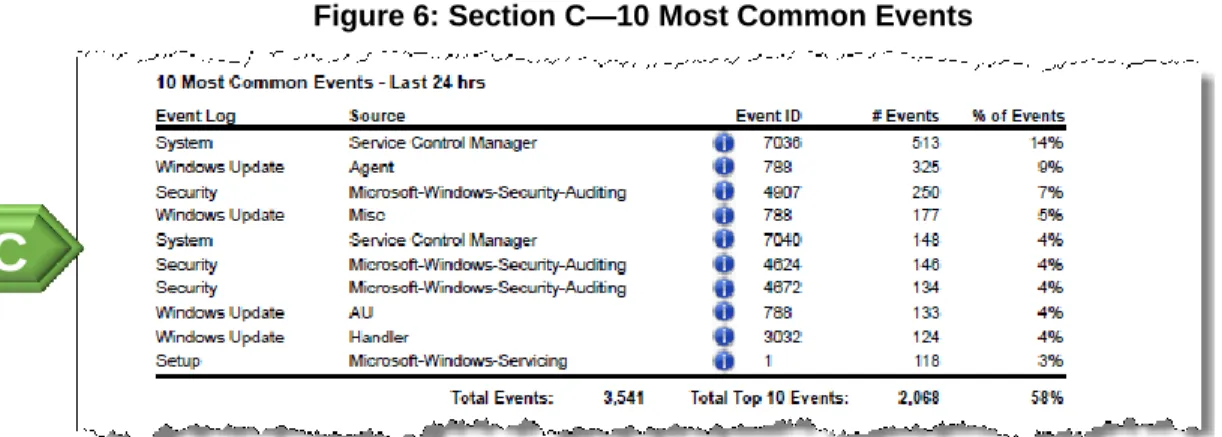
Figure 6: Section C—10 Most Common Events
The 10 Most Common Events section (section C) lists the 10 most common events for this system over the last 24 hours. Each item shows the type of event (e.g., system, application, update, etc.), the event log source, the event ID, the number of events and the percentage of events compared to the total number of events. A red icon to the left of the event ID indicates that it is an error, a yellow icon indicates a warning and a blue icon indicates it is information.
Double-click on any event ID to open detailed information about the event in EventID.NET. The list footer is calculated based on the count of list occurrences.
Total Events equals the count of total event log events found. The Total Top 10 Events is the total of the top 10 events and the percentage is the top 10 total compared with the overall total of all events.
Figure 7: Section D—Error Events
The Error Events section (section D) lists all event errors for the time period specified for your retention history of event logs (Dashboard > Config > System >
Event Log History field). This section will only list errors. To get detailed event information on any event, click on the eventID. This will open the event in another window. Click again on the event ID to open the event details in EventID.NET.
C
The Report Footer (section E) contains the page number, client name, the report title and the date and time the report ran. Additionally, if you used any filters when creating the report, these will display in the Current Parameters section on the final page of the report.
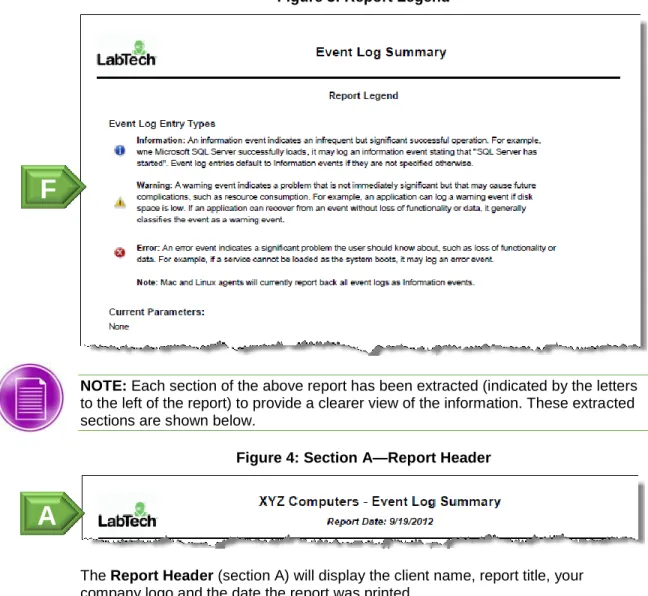
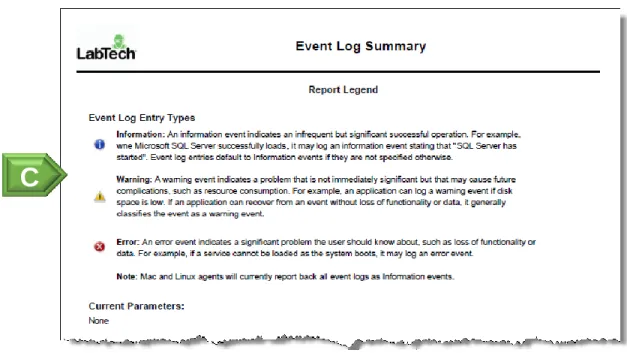
Figure 9: Report Legend
The Report Legend (section F) will appear on the last page of the report. If you used any filters when creating the report, these will display in the Current Parameters
section.
Document Revision History
Date
Notes
09/19/2011 New Document.
09/19/2012 Updated for 2012 SP1.
Updated filters.
Updated images.