www.wjpr.net Vol 6, Issue 16, 2017. 859
FORMULATION AND EVALUATION OF MICROSPONGES GEL FOR
TOPICAL USE
Sumbul Rafat* and Lakshya Veer Singh
Department of Pharmacy, M.J.P. Rohilkhand University, Bareilly (243006), Uttar Pradesh,
India.
ABSTRACT
The purpose behind undertaking this project was to formulate and
evaluate gel containing microsponges of Clobetasol Propionate (CP) to
deliver CP in a perennial manner for far-reaching time period to reduce
application frequency, hypersensitive reactions and to improve safety
than conventional formulation. Quasi-emulsion solvent diffusion
method was employed using Ethyl Cellulose as a polymer and
microsponges with varied drug–polymer ratios were prepared. For
optimization purposes, diverse factors affecting microsponges physical
properties were investigated. Microsponges were characterized by
SEM, FT-IR, and for particle size analysis and evaluated for drug
content and drug loading, morphology and in-vitro release study as
well. No chemical interactions were found between drug and polymer used which can be seen
in results of compatibility studies. Drug-polymer ratio manifested luminary effect on
production yield, drug content and drug loading efficiency, drug release and particle size.
SEM results revealed spherical microsponges with porous surface and had 22.09 μm mean
particle size. The best microsponges formulations were then incorporated into carbopol gel
and were evaluated for their viscosity, pH and in-vitro drug release study. The microsponges
gel results depicted that gel formulation G-F4 with 1:1 drug–polymer ratio was more efficient
to give extended drug release upto 75.75 % at the end of 12 h while conventional formulation
exhausted extremely only after 2.5 h. Thus, the formulated microsponge-based gel of
clobetasol propionate would be a likely substitute to conventional therapy for safer and
efficient treatment of inflammation, psoriasis and chronic hyperkeratotic eczema.
Volume 6, Issue 16, 859-885. Research Article ISSN 2277– 7105
Article Received on 12 October 2017,
Revised on 03 Nov. 2017, Accepted on 24 Nov. 2017
DOI: 10.20959/wjpr201716-10240
8533
*Corresponding Author
Sumbul Rafat
Department of Pharmacy,
M.J.P. Rohilkhand
University, Bareilly
(243006), Uttar Pradesh,
www.wjpr.net Vol 6, Issue 16, 2017. 860 KEYWORDS: Clobetasol Propionate, Microsponges, Polymer (Ethyl cellulose), Extended
release.
1. INTRODUCTION
Psoriasis is a relatively common skin disease that affects approximately 2% of the world's
population. It is a chronic and T-cell-mediated autoimmune disorder with hyper proliferation
of the epidermis and inflammatory reactions of the dermis and epidermis.[1] The treatment of
psoriasis varies depending on disease severity and spread. However, topical medications
remain the mainstay of psoriasis treatment for most patients. As seen in the literature, topical
corticosteroids and particularly super potent ones are the most widely prescribed medications
for the topical treatment of psoriasis for decades in the world. They are available in numerous
vehicles including powders, sprays, lotions, solutions, creams, emollient creams, ointments,
gels and medicated tapes.[2] Although serious cutaneous and systemic side effects of the
corticosteroids have limited their use, they are still among the most effective treatments.[1]
Clobetasol Propionate (CP) is a dihalogenated highly potent glucocorticoid[4] topical steroid.
CP is a white or almost crystalline[3,5] tasteless powder. A derivative of prednisolone with
high glucocorticoid activity and low mineralocorticoid activity.[3,4]
It has been used in clinical practice because of its anti-inflammatory, anti-pruriginous, and
vasoconstrictor activities,[5] used topically in treatment of psoriasis.[4] CP has been shown to
suppress the hypothalamic-pituitary-adrenal (HPA) axis at the lowest doses tested. Cushing’s
syndrome, hyperglycemia and unmasking of latent diabetes mellitus can also result from
systemic absorption of topical corticosteroids. Children may be more susceptible to systemic
toxicity from use of topical corticosteroids.[29]
Local adverse reactions with topical corticosteroids may occur more frequently with the use
of occlusive dressings and higher potency corticosteroids, including Clobetasol propionate.
These reactions include: folliculitis, acneiform eruptions, hypopigmentation, perioral
dermatitis, allergic contact dermatitis, secondary infection, striae and miliaria.[6]
Topical corticosteroids can be absorbed from normal intact skin. Inflammation and other
disease processes in the skin may increase percutaneous absorption.[29]
Being a highly potent topical corticosteroid side effects and adverse effects of drug could
www.wjpr.net Vol 6, Issue 16, 2017. 861 pattern in a way to control the delivery of actives to a predetermined site in the human body.
By limiting the release and delivery rate of actives from the topical formulation on to the
epidermal layer would lead to increase the drug residence time as well as reduces the
absorption of drug in the systemic circulation resulting in reduced side as well as adverse
effects. The Microsponge delivery system (MDS) is a polymeric microsphere system
uniquely fulfilling these above requirements by providing topical controlled drug delivery
systems.
Microsponges are polymeric delivery systems consisting of porous microspheres[7,8,9] these
are tiny sponge like spherical particles that consists of myriad of interconnecting voids within
a non-collapsible structure with large porous surface.[7,10] The size of these microsponges can
be varied, usually from 5-300 µm in diameter.[7] Microsponges are used as topical drug
carriers that allow an even and sustained rate of release and therefore reduce irritation while
maintaining efficacy. In addition, the microsponge particles themselves are too large to be
absorbed into the skin and this adds a measure of safety to the microsponge materials.[11]
Microsponges drug delivery systems have been extensively used for oral administration and
bone & tissue engineering and could also be useful to deliver several drugs into the skin.[8,12]
However, there are few researches about dermal application of microsponges. Several drugs
such as: Benzoyl peroxide, hydrocortiscone, zinc pyrithione, selenium sulphide,
hydoquinones, suncscreens[9,15] were successfully encapsulated into microsponges for several
purposes.
The aim of this study was to develop a topical drug delivery system in order to provide the
prolonged and controlled release of clobetasol propionate, minimize the systemic drug
absorption and reduce the possible side effects of the drug. For this purpose, microsponges
loaded with Clobetasol propionate were prepared and characterized. The effects of different
drug-polymer ratios and polyvinyl alcohol (PVA) concentrations on the characteristics of the
microspheres were evaluated. Selected microsponges formulation was formulated into the
carbopol gel base. Carbopol gel is more easily spreadable base for the wide surfaces like
psoriatic lesions compared to cream or ointment formulations. Release profiles of Clobetasol
propionate from carbopol gel formulations were compared with commercial product of the
www.wjpr.net Vol 6, Issue 16, 2017. 862 2. MATERIAL AND METHODS
Table 1: Showing material used in preparation of microsponges S.no Chemicals Source
1. Clobetasol Propionate Gift sample by Glenmark Pharmaceutical Ltd., Baddi, H.P.
2. Ethyl Cellulose SD Fine Chem Ltd.
3. Tri ethyl citrate Merk Specialities pvt. Ltd 3. Poly Vinyl Alcohol Bombay Drug House Pvt. Ltd 4. Di Chloro Methane Merk Specialities pvt. Ltd
5. Carbopol- 934 LR SD Fine Chem Ltd.
6. Distilled water Made in laboratory through distilled water assembly by Perfit India.
2.1. PRE-FORMULATION STUDIES OF DRUG
2.1.1. Physical Characterization and Identification of Clobetasol Propionate:
The drug identification is based on the following parameters:
2.1.1.1. Organoleptic property of drug
Drug (Clobetasol Propionate) was physically characterized on the basis of color, nature, odor
and taste. All these parameters were recorded and compared with standard.
2.1.1.2. Determination of Melting Point
The reported Melting point (M.P) of CP is in range 195.5-197C [14], approximately 196 a/c
USP 24).
Melting point of the Clobetasol propionate was determined by capillary tube method. A
capillary tube was filled with drug crystals about 3 mm high. Then capillary tube was put
(open end down) into the crystals and tapped on the bottom of the crystallization dish to got
the crystals into the tube. The crystals were forced to slide to the bottom of the tube by tapped
the tube (open end up) on the lab bench. Then the capillary tube was inserted in the melting
point apparatus. The temperature of apparatus was then increased to make a rapid
determination of melting point. Melting process was observed through the magnifying lens.
Procedure was repeated 3 times to obtained readings in triplicate.[13]
2.1.1.3. Solubility of Clobetasol propionate.[5]
Table 2: Solubility profile of Clobetasol propionate.
S.NO SOLVENT SOLUBILITY
1. Distilled water Insoluble
2. Di chloro methane Soluble
3. Alcohol Sparingly soluble
4. Chloroform Soluble
5. Acetone Slightly soluble
www.wjpr.net Vol 6, Issue 16, 2017. 863 2.1.1.4. Partition Coefficient
For determination of partition coefficient of drug, equal ratio of chloroform and water (H2O)
i.e.10 ml each was taken in a separating funnel. In this mixture excess amount of drug was
added and shaked properly for mixing of drug in both the phases. The solution mixture was
left for 24 h for proper separation of drug into two phases i.e. chloroform and water. After 24
h chloroform and water phases were individually took out in the separate beakers. For better
clearance the obtained filtrate was sonicated for 15 min at 80 Hertz (Hz) and then diluted.
The absorbance was checked at 242.4 nm. The same procedure was repeated in triplicate for
better accuracy.[16,17]
2.1.1.5. Infrared Spectroscopy
Fourier Transform Infrared (FTIR) spectra of CP were recorded over the wavelength range of
4500 to500 cm−1. It was done using Fourier Transform Infrared Spectrophotometer using KBr
pellet method. The characteristics Infrared (IR) absorption peaks of CP were studied and
spectral interpretation was done. (Shown in appendix A).
2.1.1.6. UV spectroscopy[18,19]
Clobetasol propionate has characteristics UV absorption at λ max (MeOH) 237 nm
(ε=15000).[19] Calibration curve of CP was plotted using methanolic water (40:60) by keeping
concentration range of 5-30 μg/ml. The drug was analyzed spectrophotometrically by Double
Beam Spectrophotometer (shimadzu 1800 UV-VIS) in range 200- 400 nm. (Regression
coefficient r2 = 0.999).
2.1.1.7. Drug–excipient interaction study
Drug–excipient interactions were investigated by FTIR study. IR spectra were recorded to
check compatibility of drug with excipients, using FTIR spectrophotometer (FTIR, A-410,
Jasco, Japan) over wavelength range of 4500 to500 cm−1 at resolution of 4 cm−1. KBr
dispersed samples were compressed in pellets by applying 5 tons pressure for 5 min using
hydraulic press. Formed pellets were kept in light path and spectra were recorded. The
characteristics IR absorption peaks of CP were studied and spectral interpretation was done.
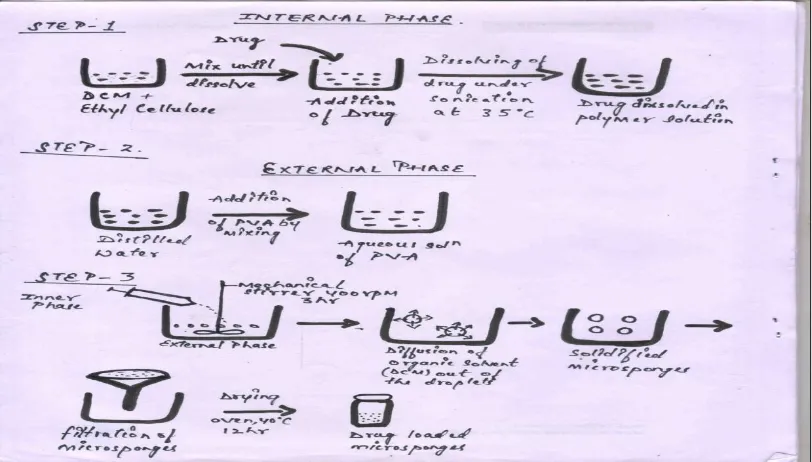
3.0. FORMULATION DEVELOPMENTOF MICROSPONGES[20,21]
The microsponges were prepared by Quasi-emulsion solvent diffusion method. The internal
phase consists of ethyl cellulose dissolved in 20 ml of dichloromethane. This was followed
www.wjpr.net Vol 6, Issue 16, 2017. 864 accurately and dissolved in 90 ml of distilled water at 60˚C. The surfactant mixture was
allowed to cool to room temperature. The internal phase containing Clobetasol propionate
and ethyl cellulose polymer was added drop wise with stirring at 400 rpm. After 3h of
stirring, microsponges were formed due to the removal of solvent, dichloromethane (DCM)
from the system by evaporation. The microsponges were washed 3 times with distilled water,
filtered and dried overnight at room temperature. For the evaluation of the effect of drug:
polymer ratio on the physical characteristics of microsponges, six different ratios of the drug
to ethyl cellulose (1:1, 1:2, 1:3) with varying DCM amount were employed.
The obtained microsponges were then stored in a glass container for further use i.e. for
characterization and incorporation into gel base to make microspongic gel.
Figure 1: Showing steps involved in preparation of microsponges by quasi-emulsion
solvent diffusion method.
[image:6.595.96.502.307.538.2]3.1. FORMULATION CHART FOR MICROSPONGE PREPARATION
Table 3: Showing all formulations composition.
S. no
Formu- lation
Code
Drug: Polymer
Ratio
Drug (Clobetasol propionate)
Ethyl- Cellulose (polymer)
(mg)
Di Chloro Methane
(ml)
Poly Vinyl Alcohol
(mg)
1. F 1 1:1 750 750 20 50
2. F 2 1:2 500 1000 20 50
3. F 3 1:3 350 1125 20 50
4. F 4 1:1 750 1000 20 75
5. F 5 1:2 500 500 20 75
www.wjpr.net Vol 6, Issue 16, 2017. 865 4.0. EVALUATION OF MICROSPONGES
4.1. Physical appearance
The microsponges were physically evaluated visually for their appearance, color and flow
property.
4.2. Production yield[22]
Microsponges production yield was determined by the formula mentioned below:
4.3. Loading efficiency[22]
Loading efficiency of microsponges was determined by the below written formula:
4.4. Actual drug content[22]
The weighed amount of drug loaded microsponges (50 mg) was dissolved in 100 ml solvent,
methanol: water (40: 60) with continuous stirring. Filtered samples (using whatmann filter
paper) were analyzed at 242.4 nm against blank using UV spectrophotometer (Shimadzu
1800, Japan). Estimation of drug content for all batches was done using the following
expressions:
Actual drug content (%) =
Where, = actual CP content in weighed quantity of microsponges,
4.5. Morphology and Surface topography[21]
The morphology and surface characteristics of the microsponges were examined using a
scanning electron microscope (SEM analyzer, GEOL 5400, USA) operating at 15Kv at
www.wjpr.net Vol 6, Issue 16, 2017. 866 Dried microsponges were coated with gold–palladium alloy for 45 s under an argon
atmosphere before observation. SEM photographs were recorded at magnification of × 500,
1000, and 10,000.
4.6. Infrared spectroscopy
It was done using a Fourier Transform Infrared Spectrophotometer (FTIR A-410, shimadzu)
using KBr pellet method at SRMS College of Engg. & Tech., Bareilly, U.P., India.
FTIR spectra of CP and microsponge formulation were recorded in the wavelength range of
4500 to 500 cm−1. (Shown in appendix A& B).
4.7. In-vitro release study[23,24]
The pH of normal healthy human skin is between 4.5 and 6. However, the pH value rises
beyond 6, when a person actually suffers from a skin problem or skin disease. So, the drug
release studies of Clobetasol propionate microsponge were done in methanolic water.[23]
The in-vitro release of microsponge formulations were studied using cellophane membrane
using modified apparatus. The dissolution medium used was methanolic water (40: 60).
Cellophane membrane previously boiled for 1 h in the dissolution medium (methanolic water;
40:60), was tied to one end of a specifically designed glass cylinder (open at both ends).
Formulation (equivalent to 10 mg of Clobetasol propionate) was accurately placed into this
assembly. The cylinder was attached to stand and suspended in 100 ml of dissolution medium
maintained at 37 ± 1°C and the membrane was just touching the receptor medium surface.
The dissolution medium was stirred at 100 RPM speed using teflon coated magnetic bead.
Aliquots each of 1ml (diffusion medium) was withdrawn at a specific interval and replaced
by an equal volume of the receptor medium to maintain the sink condition. The samples were
taken periodically for 12 h. The samples were measured spectrophotometrically at 242.4 nm
by UV spectrophotometer (Shimadzu UV-VIS 1800 Pharma spec.).
The cumulative percentage of drug released was plotted against time to find the drug release
behavior of all microsponge formulations.
4.8. Particle size analysis
Particle size analysis was executed by optical microscopy using optical microscope as well as
www.wjpr.net Vol 6, Issue 16, 2017. 867 5.0. INCORPORATION OF CLOBETASOL PROPIONATE MICROSPONGES INTO
GEL[22,23]
To obtain a suitable topical formulation for application, microsponges were incorporated into
a gel base.
For preparing CP microsponge gel, 1 g of Carbopol 941 LR was uniformly dispersed in
beakers containing sufficient quantity of water and was allowed to hydrate overnight. Then it
was mixed with 5 g of glycerin to form paste. Later 95 ml of water was added slowly to paste
under constant stirring, followed by drop wise triethanolamine addition to adjust pH to 6.5–
7.5. Clobetasol propionate microsponges equivalent to 0.05% w/w of drug were dispersed
into gel base and stirred until a viscous smooth translucent gel was obtained.[25]
5.1. CHARACTERIZATION OF CLOBETASOL PROPIONATE LOADED
MICROSPONGE TOPICAL GEL
From the in-vitro release studies, the best microsponge formulations F1 and F4 was selected
and incorporated into gel base and evaluated for various parameters viz. homogeneity, pH of
the gels, viscosity, drug content and in-vitro permeation study.
5.2. Homogeneity[26]
Both developed gels were tested for homogeneity by visual inspection after the gel has been
set in the container. They were tested for their appearance and presence of any aggregates.
5.3. Viscosity[25,26]
The intrinsic viscosity of gel formulations were measured using a Model Brookfield
Viscometer. The viscometer was operated at 100 rpm using a T-F (code 96) spindle. In order
to obtain stable display readings, all measurements were recorded 60 sec after the
commencement of spindle rotation and a maximum of three (3) readings were taken to obtain
an average viscosity value.
5.4. Determination of pH[27]
The pH of extemporaneously manufactured CP gel formulations were measured using the pH
meter.
Diverse gel formulations pH was recorded using digital pH meter. 5g gel was dispersed in 45
ml distilled water at 27 ºC and solution pH was measured. The measurements were taken
www.wjpr.net Vol 6, Issue 16, 2017. 868 measurements were recorded in triplicate to generate an average pH value for each
formulation.[27]
5.5. Drug content[25]
The CP loaded microsponges gel (1g) was accurately weighed and dissolved in methanolic
water (40:60) solvent system, sonicated for a period of 10-15 min and volume was made to
100 ml in volumetric flask with methanolic water (40: 60). From this 10 ml was pipetted out
and diluted to 100 ml with methanolic water and the final dilution was made using
methanolic water to got the concentration within Beer’s range. The absorbance of filtered
samples (using whatmann filter paper) was analyzed spectrophotometrically at 242.4 nm
against blank gel, treated in the same manner as sample. Estimation of drug content for F1
and F4 formulations were done using the following expressions:
Actual drug content (%) =
Where, = actual CP content in weighed quantity of microsponges,
5.6. In-vitro release study[24,27]
The in-vitro release of microsponges gel formulations were carried out using cellophane
membrane using modified apparatus. The dissolution medium used was methanolic water
(40: 60). Cellophane membrane previously boiled for 1h in methanolic water and was tied to
one end of a specifically designed glass cylinder (open at both ends). 16.766 mg gel
formulation (equivalent to 10 mg w/w of Clobetasol propionate) was accurately placed on the
cellophane membrane. The cylinder was attached to stand and suspended in 100 ml of
dissolution medium (methanolic water) maintained at 37 ± 1°C and the membrane was just
touching the receptor medium surface. The dissolution medium was stirred at 100 rpm speed
using teflon coated magnetic bead. Aliquots each of 1ml (diffusion medium) was withdrawn
at a specific interval and replaced by an equal volume of the receptor medium to maintain the
sink condition. The samples were taken periodically for 12 h. The samples were measured
spectrophotometrically at 242.4 nm by UV spectrophotometer (Shimadzu UV-VIS 1800
Pharma spec.).
The cumulative percentage of drug released from gel was plotted against time to find the drug
www.wjpr.net Vol 6, Issue 16, 2017. 869 6.0. RESULTS AND DISCUSSION
6.1. PRE-FORMULATION STUDY
6.1.1. Characterization of Clobetasol Propionate pure drug
6.1.1.1. Description: Clobetasol Propionate (CP) was found white to creamy white
crystalline powder.
6.1.1.2. Melting point: Melting point of Clobetasol propionate was found to be in the range
of 195 - 196.5 ºC (literature standard 195.5 -197 ºC).
6.1.1.3. Solubility: Soluble in methanol, chloroform and Di chloro methane while very
slightly soluble in acetone and insoluble in water.
6.1.2. SPECTROSCOPIC STUDIES
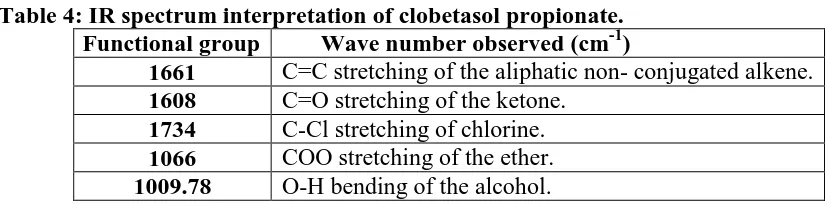
6.1.2.1. IR Spectroscopy: IR Spectra of Clobetasol propionate in its pure form was recorded.
[image:11.595.73.488.375.477.2]Results are depicted in appendix A and Table 4.
Table 4: IR spectrum interpretation of clobetasol propionate. Functional group Wave number observed (cm-1)
1661 C=C stretching of the aliphatic non- conjugated alkene. 1608 C=O stretching of the ketone.
1734 C-Cl stretching of chlorine. 1066 COO stretching of the ether. 1009.78 O-H bending of the alcohol.
6.1.2.2. UV Spectroscopy: (Determination of λ max)
For UV spectroscopy Clobetasol propionate in methanolic water (40: 60) was scanned from
[image:11.595.106.491.562.751.2]200-400 nm. The λ max was found to be 242.4 nm.
www.wjpr.net Vol 6, Issue 16, 2017. 870 6.1.2.3. DRUG -EXCIPIENT COMPATIBILITY STUDIES
6.1.2.3.1. Physical Change
No physical changes such as: discoloration, change in texture etc. were observed during
compatibility study.
6.1.2.3.2. FTIR Study
FTIR spectra of ‘pure drug’ and ‘drug entrapped microsponges’ were compared to study
incompatibility of drugs with excipients. Principal peaks of microsponge entrapped drugs
were compared with peaks of pure drugs.
Vibrational peaks of Clobetasol propionate detected in drug loaded microsponges formulation
associated with C=C stretching of the aliphatic non-conjugated alkene, C-Cl stretching of
chlorine, COO stretching of the ether and O-H bending of the alcohol were identified at
1665.60, 1738.90, 1112.01 and 1009.78.
Principle peaks of drugs were retained; broadening of peaks may be due to overlapping of
peaks of polymer system and drug in microsponge formulation. Thus, IR spectroscopy results
depicted that CP was compatible with selected polymer, excipients and possess good stability
in all microsponge formulations.
As experimental values were in good agreement with standard, procured drug was supposed
to be pure.
6.2. EVALUATION OF CLOBETASOL PROPIONATE MICROSPONGES
6.2.1. Physical appearance
White color microsponges particles were obtained by quasi- emulsion solvent diffusion
method. Flow properties of drug were noted to be poor while it has been observed that
microsponges of Clobetasol propionate had good flow properties.
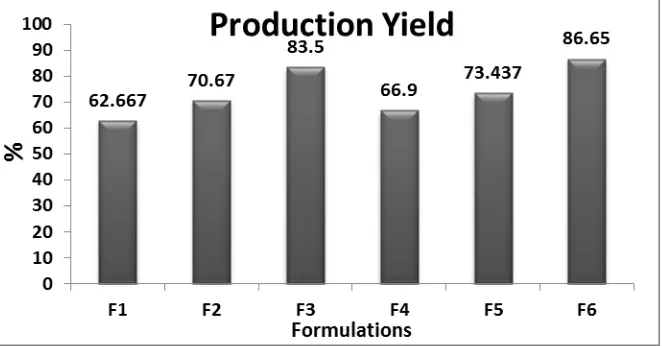
6.2.2. Production Yield
Production yield (PY) of all formulations of Clobetasol propionate microsponges was
observed in the range 62.667 to 83.50 for formulations F1 to F3 and 66.90% to 86.650 % for
www.wjpr.net Vol 6, Issue 16, 2017. 871 Table 5: Production yield of Clobetasol propionate microsponges formulations.
Formulation code Production yield
F 1 62.667±0.907
F 2 70.670±0.855
F 3 83.50±0.681
F 4 66.90±0.815
F 5 73.437±0.637
F 6 86.650±0.655
*each value is average of three separate determinations ± SD
Figure 3: Graphical presentation of Production yield of Clobetasol propionate
microsponges formulations.
It was found that the production yield was greatly affected by drug: polymer ratio as well as
by concentration of poly vinyl alcohol (PVA). Moreover, increase in the drug: polymer ratio
resulted into increased production yield from formulation F1 to F3 and F4 to F6.
With the high PVA conc. (750 mg) in formulations F4 - F6, the production yield was high as
compare to formulations F1 –F3 which contained low PVA conc. (50 mg) in them. This was
for the reason that the abridged dichloromethane diffusion rate from concentrated solutions to
aqueous phase at higher drug: polymer concentrations provides additional time for formation
of droplet, thereby improved yield.
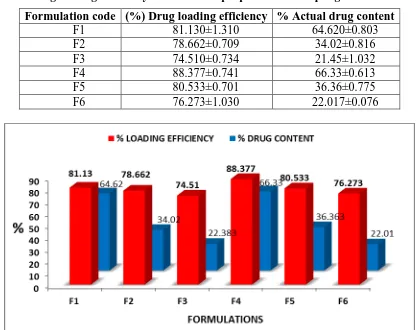
6.2.3. Drug loading efficiency and drug content
At all ratios of drug: polymer employed, the mean amount of drug loaded in the prepared
microsponges was lower than the theoretical value, since the drug loading efficiency did not
reach 100%. This could be attributed to dissolution of some drug in the solvent or aqueous
[image:13.595.135.466.229.402.2]www.wjpr.net Vol 6, Issue 16, 2017. 872 led to superior drug loadings. Use of the higher amount of polyvinyl alcohol for formulations
F4, F5 and F6 while preparing microsponges caused slightly increased viscosity of the
dispersed phase. When solvent was diffused out, nearly all of the dispersed phase was
converted to solid microsponges and estranged particles emerged. The reason behind utmost
drug loading efficiencies for these formulations was availability of maximum polymer
[image:14.595.88.507.222.552.2]amount to each drug unit in contrast to the rest of formulations.
Table 6: Drug loading efficiency of Clobetasol propionate microsponges formulations.
Formulation code (%) Drug loading efficiency % Actual drug content
F1 81.130±1.310 64.620±0.803
F2 78.662±0.709 34.02±0.816
F3 74.510±0.734 21.45±1.032
F4 88.377±0.741 66.33±0.613
F5 80.533±0.701 36.36±0.775
F6 76.273±1.030 22.017±0.076
Figure 4: Graphical presentation of loading efficiency of Clobetasol propionate
microsponges formulations.
The loading efficiency was noted in the range 81.130 – 74.510% for formulations F1- F3
while loading efficiency was noted in the range 88.377– 76.273 % for formulations F4- F6 as
shown in Table 6.
Actual drug content of formulations decreased with increase in drug: polymer ratio in
formulations F1-F3 and F4-F6. But formulations with high conc. of polyvinyl alcohol have
more drug content as compare to formulations that contains less amount of polyvinyl alcohol.
www.wjpr.net Vol 6, Issue 16, 2017. 873 while it was found in range 66.33±0.613 to 22.017 for formulations F4- F6 as shown in
Table 6.
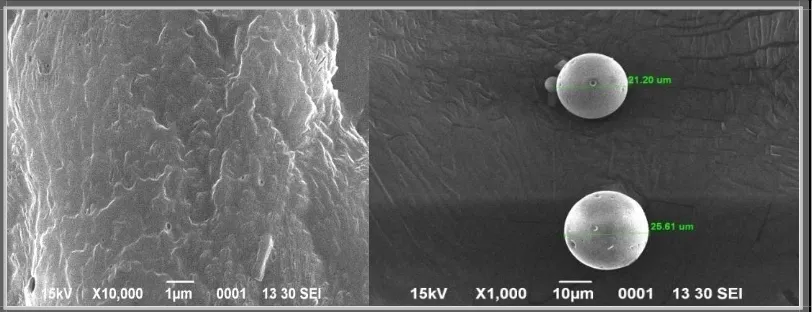
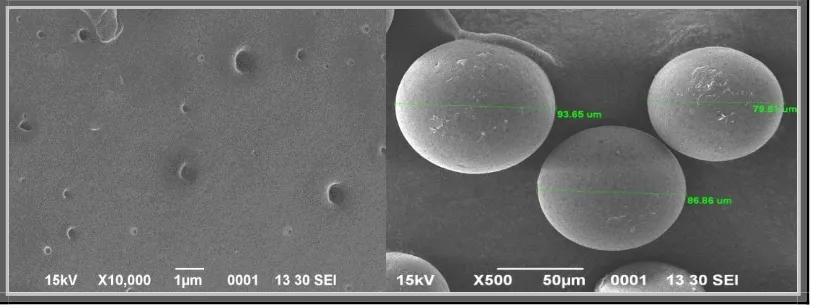
6.2.4. Scanning electron microscopy
Morphology and surface topography of prepared microsponges by quasi-emulsion solvent
diffusion method were investigated by SEM. The representative SEM photographs of the
[image:15.595.96.502.225.381.2]microsponges are shown in Figures 5-10.
[image:15.595.94.507.420.558.2]Figure 5: SEM images of microsponges F1 formulation.
[image:15.595.100.501.596.753.2]Figure 6: SEM images of microsponges F2 formulation.
www.wjpr.net Vol 6, Issue 16, 2017. 874 Figure 8: SEM images of microsponges of F4 formulation.
Figure 9: SEM images of microsponges F5 formulation.
Figure 10: SEM images of microsponges F6 formulation.
The representative SEM images of microsponges as shown in Fig.5- Fig.10. SEM results
indicate that microsponges formed were highly porous, predominantly spherical and no
[image:16.595.96.503.506.660.2]www.wjpr.net Vol 6, Issue 16, 2017. 875 microsponge revealed the characteristic internal pores on the surfaces. By diffusion of
dichloromethane from surface of microsponges pores were induced. Moreover, it was
supposed that the distinctive internal structure comprised spherical cavity enclosing a stiff
shell assembly of drug and polymer. The internal structure consisted of numerous annulled
spaces and appearance of particles was such that they were perfect to be called microsponges.
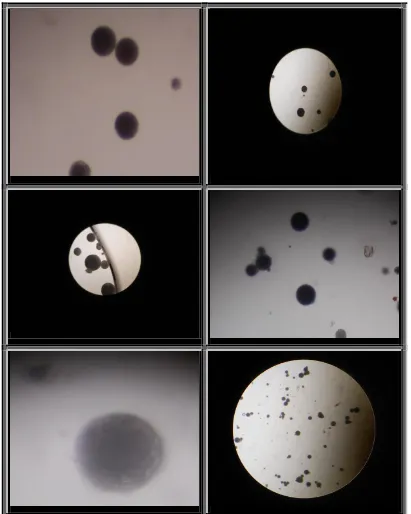
The microsponges were also observed under optical light microscope (Fig. 11), which
showed that formed microsponges were spherical in each single entity or in form of bunches
[image:17.595.93.504.235.749.2]and had porous nature.
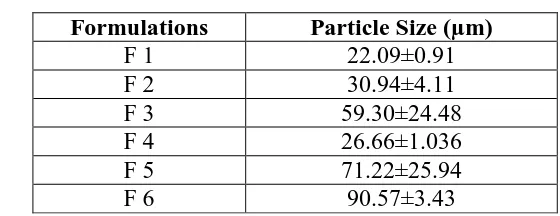
www.wjpr.net Vol 6, Issue 16, 2017. 876 6.2.5. Particle Size analysis
The mean particle size of microsponge formulations should be in the range of 5-300 µm. The
observed particle size by optical optical light microscopy was found in range from 22.09 µm
to 90.57 µm as shown in table 7.
Visual inspection of all batches for particle size using optical microscope revealed that the
particle size was increased with increase in ethyl cellulose amount, i.e. with an increase of
drug: polymer ratio. This might be due to the fact that polymer available at higher drug:
polymer ratio was in greater amount thereby increasing polymer wall thickness, which
consequently led to larger microsponges. In addition with increasing amount of polyvinyl
alcohol, particle size was found to be increased, credited to the rise in apparent viscosity at
increased concentrations. It results in larger emulsion droplet formation and finally in greater
microsponge size. Optimized batches possessed greater percentage of intact, uniform and
[image:18.595.150.430.383.491.2]spherical particles during optical microscopy.
Table 7: Showing particle size of microsponges by optical microscopy.
Formulations Particle Size (µm)
F 1 22.09±0.91
F 2 30.94±4.11
F 3 59.30±24.48
F 4 26.66±1.036
F 5 71.22±25.94
F 6 90.57±3.43
It was found that the observed particle size by optical microscopy matches to the results of
particle size that has obtained from scanning electron microscopy. So, we can say that the
optical microscopy results are more relying.
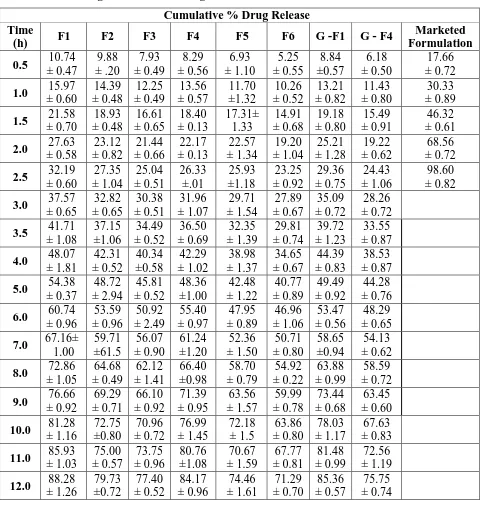
6.2.6. In- vitro drug release from microsponges
The in-vitro drug release profiles of CP fabricated in all formulations of microsponges were
conducted taking methanolic water (40: 60) as diffusion medium. The drug release was
observed to decline within range of 88.28% to 77.40% with respect to rise in drug: polymer
ratio from 1:1 to 1:3 (in F1- F3 which contained PVA 50 mg) and 79.16% to 71.29% for
formulations F4- F6 (that contained PVA 75 mg). The reason behind is that as the drug:
polymer ratio has increased for each microsponge to encapsulate drug, polymer amount
www.wjpr.net Vol 6, Issue 16, 2017. 877 diffusion path and ultimately lessening drug release rate. The highest drug release i.e. 88.28
[image:19.595.58.543.140.650.2]% was found for F1 while the lowest 74.06% for F6 was observed (see table 8).
Table 8: Showing cumulative % drug release of all formulations.
Cumulative % Drug Release Time
(h) F1 F2 F3 F4 F5 F6 G -F1 G - F4
Marketed Formulation
0.5 10.74
± 0.47 9.88 ± .20 7.93 ± 0.49 8.29 ± 0.56 6.93 ± 1.10 5.25 ± 0.55 8.84 ±0.57 6.18 ± 0.50 17.66 ± 0.72
1.0 15.97
± 0.60 14.39 ± 0.48 12.25 ± 0.49 13.56 ± 0.57 11.70 ±1.32 10.26 ± 0.52 13.21 ± 0.82 11.43 ± 0.80 30.33 ± 0.89
1.5 21.58
± 0.70 18.93 ± 0.48 16.61 ± 0.65 18.40 ± 0.13 17.31± 1.33 14.91 ± 0.68 19.18 ± 0.80 15.49 ± 0.91 46.32 ± 0.61
2.0 27.63
± 0.58 23.12 ± 0.82 21.44 ± 0.66 22.17 ± 0.13 22.57 ± 1.34 19.20 ± 1.04 25.21 ± 1.28 19.22 ± 0.62 68.56 ± 0.72
2.5 32.19
± 0.60 27.35 ± 1.04 25.04 ± 0.51 26.33 ±.01 25.93 ±1.18 23.25 ± 0.92 29.36 ± 0.75 24.43 ± 1.06 98.60 ± 0.82
3.0 37.57
± 0.65 32.82 ± 0.65 30.38 ± 0.51 31.96 ± 1.07 29.71 ± 1.54 27.89 ± 0.67 35.09 ± 0.72 28.26 ± 0.72
3.5 41.71
± 1.08 37.15 ±1.06 34.49 ± 0.52 36.50 ± 0.69 32.35 ± 1.39 29.81 ± 0.74 39.72 ± 1.23 33.55 ± 0.87
4.0 48.07
± 1.81 42.31 ± 0.52 40.34 ±0.58 42.29 ± 1.02 38.98 ± 1.37 34.65 ± 0.67 44.39 ± 0.83 38.53 ± 0.87
5.0 54.38
± 0.37 48.72 ± 2.94 45.81 ± 0.52 48.36 ±1.00 42.48 ± 1.22 40.77 ± 0.89 49.49 ± 0.92 44.28 ± 0.76
6.0 60.74
± 0.96 53.59 ± 0.96 50.92 ± 2.49 55.40 ± 0.97 47.95 ± 0.89 46.96 ± 1.06 53.47 ± 0.56 48.29 ± 0.65
7.0 67.16± 1.00 59.71 ±61.5 56.07 ± 0.90 61.24 ±1.20 52.36 ± 1.50 50.71 ± 0.80 58.65 ±0.94 54.13 ± 0.62
8.0 72.86
± 1.05 64.68 ± 0.49 62.12 ± 1.41 66.40 ±0.98 58.70 ± 0.79 54.92 ± 0.22 63.88 ± 0.99 58.59 ± 0.72
9.0 76.66
± 0.92 69.29 ± 0.71 66.10 ± 0.92 71.39 ± 0.95 63.56 ± 1.57 59.99 ± 0.78 73.44 ± 0.68 63.45 ± 0.60
10.0 81.28 ± 1.16 72.75 ±0.80 70.96 ± 0.72 76.99 ± 1.45 72.18 ± 1.5 63.86 ± 0.80 78.03 ± 1.17 67.63 ± 0.83
11.0 85.93 ± 1.03 75.00 ± 0.57 73.75 ± 0.96 80.76 ±1.08 70.67 ± 1.59 67.77 ± 0.81 81.48 ± 0.99 72.56 ± 1.19
12.0 88.28 ± 1.26 79.73 ±0.72 77.40 ± 0.52 84.17 ± 0.96 74.46 ± 1.61 71.29 ± 0.70 85.36 ± 0.57 75.75 ± 0.74
It has been reported that with increasing amount of PVA from F4 to F6, the drug release went
on decreasing. It might be due to fact that the polymer matrix releases drug after complete
swelling and the time required for swelling of polymer is more as compare to formulations
with less amount of PVA. The declined release rate with increased amount of PVA for
www.wjpr.net Vol 6, Issue 16, 2017. 878 6.2.7. Comparative graph of all formulations showing Cumulative% drug release
Figure 12: In-vitro drug release profiles of Clobetasol propionate microsponges
formulations, microsponge gel and marketed formulation (n = 3, mean ± SD).
6.3. EVALUATIONS OF MICROSPONGES GEL
As formulation F1 and F4 exhibited drug release 83.10% and 81.55% after completion of 12
h, and was also found superior in terms of physiochemical characterization, production yield,
actual drug content, entrapment efficiency, morphology, surface topography, particle size,
percentage of intact porous microsponges and other physical parameters. In addition to drug
release, they are assumed to be the best and most efficient formulations to give an extended
drug release among all the formulations, so incorporated into carbopol gel and led to the
various parameters of the gel as well.
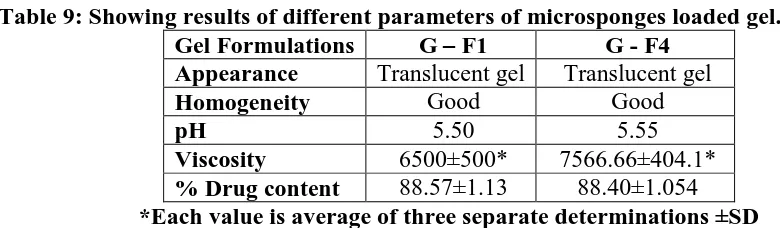
6.3.1. Determination of Viscosity
Results of viscosity determination of gel showed that gel of microsponge formulation F4
loaded with CP and PVA conc. (75 mg) was found more viscous and gritty than gel of
microsponge formulation F1 loaded with CP and PVA conc. (50 mg). The results of viscosity
[image:20.595.81.488.80.294.2] [image:20.595.73.463.645.759.2]are shown in the table below:
Table 9: Showing results of different parameters of microsponges loaded gel.
Gel Formulations G – F1 G - F4
Appearance Translucent gel Translucent gel
Homogeneity Good Good
pH 5.50 5.55
Viscosity 6500±500* 7566.66±404.1*
www.wjpr.net Vol 6, Issue 16, 2017. 879 6.3.2. In-vitro drug release from microsponges gel G - F1 and G - F4 formulation
Drug release from F1 and F4 formulation of microsponges gel was found to be 80.67% and
76.37%. It was found that gel containing PVA (75 mg) gave slightly less release as compare
[image:21.595.100.496.168.362.2]to gel with PVA (50 mg) conc.
Figure 13: Showing cumulative % drug release of G - F1 and G –F4.
6.3.3. Release profile of marketed formulation
The drug release study for conventional marketed formulation containing pure unentrapped
CP was carried out; release profile obtained was depicted in Fig. 14. The conventional
formulation released 98.60% drug at the end of 2.5 h only and got exhausted. In contrary
microsponges based formulation gave drug released gradually up to 12 h, and thereby would
be effective in minimizing eczema, ulcers and other side effects of Clobetasol Propionate.
www.wjpr.net Vol 6, Issue 16, 2017. 880 6.4. EFFECT OF VARIABLES ON FORMULATION
6.4.1. Effect of drug-polymer ratio
Increase in drug: polymer (D:P) ratio (F1–F3 & F4–F6) has been found to increase the
production yield while drug content, loading efficiency and % drug release were found to be
decreased (table 10). The reason behind this is as D:P ratio went on increasing, the polymer
amount available for each microsponges to encapsulate the drug was greater, thus resulting to
rising polymer matrix wall thickness which led to extended diffusion path and ultimately to
slower drug release. Consequently the amounts of drug diffused from the formulations were
[image:22.595.66.535.307.576.2]decreased at higher D: P ratio.
Table 10: Actual drug content, encapsulation efficiency, production yield and % CDR (n =3).
6.4.2. Effect of composition of external phase
Composition of external phase was altered for formulations F4–F6 by changing the
concentration of PVA from 50 mg to 75 mg. It has been observed that on increasing the
amount of PVA, production yield, and particle size were increased while slight decrease in
drug release, drug content and loading efficiency was noticed (table 10).
6.5. CONCLUSION
Controlled drug delivery via the polymer based systems has been proposed to be prevailing
both in present and in future; as having numerous potential advantages for scientific as well Formu- lations Drug: polymer ratio PVA Conc. (mg) Production Yield (%) Loading Efficiency (%) Actual drug content (%) Particle size (µm) % CDR
F1 1:1 50 62.667
±0.907 81.130 ±1.310 64.620 ±0.803 22.09 ±0.91 88.28 ± 1.26
F2 1:2 50 70.670
±0.855 78.662 ±0.709 34.02 ±0.816 30.94 ±4.11 79.73 ± 0.72
F3 1:3 50 83.50
±0.681 74.510 ±0.734 21.45` ±1.032 59.30 ±24.48 77.40 ± 0.52
F4 1:4 75 66.90
±0.815 88.377 ±0.741 66.33 ±0.613 26.66 ±1.036 84.17 ± 0.96
F5 1:5 75 73.437
±0.637 80.533 ±0.701 36.36 ±0.775 71.22 ±25.94 74.46 ± 1.61
F6 1:6 75 86.650
±0.655 76.273 ±1.030 22.017 ±0.076 90.57 ±3.43 71.29 ± 0.70
G – F1 1:1 50 - - - - 85.36
± 0.57
G- F4 1:1 75 - - - - 75.75
www.wjpr.net Vol 6, Issue 16, 2017. 881 as economic reasons. The thought behind developing polymeric microsponge delivery system
was to deliver clobetasol propionate in a continual manner for extensive time period to reduce
application frequency, hypersensitive reactions and to improve safety than marketed
conventional formulation. The method implemented was quasi-emulsion solvent diffusion;
found to be simple, reproducible and rapid. Formed microsponges were spherical shape, have
high porosity and good flow. SEM photographs revealed the spherical nature of the
microsponges in all variations. No drug crystal was observed at the surfaces of microsponges.
Furthermore, the drug was compatible with the polymer of the microsponges. Varied drug–
polymer ratio reflected remarkable effect on particle size, drug content and encapsulation
efficiency.
Gel formulation
G-F4 with 1:1 drug–polymer ratio was found more efficient to give extended drug release
(75.75% at 12 h); while conventional formulation exhausted extremely earlier (98.60% at 2.5
h). Thus, gel containing microsponges prepared in this study was found to be promising as
new-fangled delivery system offering prolonged release of Clobetasol propionate in treating
skin disorders viz., psoriasis, eczema etc.
ACKNOWLEDGEMENT
Special thanks to my project supervisor Mr. Lakshya Veer Singh and to my loving father Mr.
Rafat Husain for unending support.
FUNDING
This research did not receive any specific grant from funding agencies in the public,
commercial, or not-for-profit sectors.
REFERENCES
1. Badilli U et al, Microparticulate based Topical Delivery System of Clobetasol Propionate.
AAPS Pharm Sci Tech, 2011.
2. Lebwohl M et al, Psoriasis treatment: traditional therapy, Ann Rheum Dis, 2005.
3. https://www.drugbank.ca/drugs/DB01013.
4. Malani SP et al, Development and validation of analytical method for simultaneous
estimation of miconazole nitrate and clobetasol propionate in cream by hptlc method.
www.wjpr.net Vol 6, Issue 16, 2017. 882 5. James EFR, Martindale: The Extra Pharmacopoeia, London Royal Pharmaceutical
Society, 1996; 31: 1040.
6.
https://dailymed.nlm.nih.gov/dailymed/fda/fdaDrugXsl.cfm?setid=afd20e23-b7a6-46ca-bd8d-b7af9ff84201&type=display.
7. Sabyasachi M et al, Development and evaluation of xanthan gum-facilitated ethyl
cellulose microsponges for controlled percutaneous delivery of diclofenac sodium. Acta
Pharm, 2011; 257–270.
8. Charde MS et al, Microsponge: A Novel New Drug Delivery System: A Review.
International Journal of Advances in Pharmaceutics, 2013; 2(6), Online available at
http://ijap.ssjournals.com.
9. Pati SR, Microsponge Drug Delivery System: A Novel Dosage Form. Am. J. Pharm Tech
Res, 2012; 2(4).
10. Chadawar V, Shaji J, Microsponge Delivery System, Current Drug Delivery, Arch
Pharm Res, 2011; 34: 733-740, online available at www.springer.com.
11. Dubey D et al, Advancement in Microsponge Drug Delivery System: Preparation
Methods, Recent Patents on Drug Delivery & Formulation. Bentham science publisher,
2014; 101-110.
12. Bamane GS et al, Microsponges: A Novel Drug Delivery System. World Journal of
Pharmacy and Pharmaceutical Sciences, 2013; 3: 748-762.
13.
http://www.wiredchemist.com/chemistry/instructional/laboratory-tutorials/determination-of-melting-point.
14. http://www.chemicalbook.com/ChemicalProductPropertyUSCB6274337.aspx.
15. Agarwal A et al, Microsponges: An Upcoming and Promising Drug Delivery System.
American Journal of PharmTech Research, 2014; 4(1).
16. Sanjay D, Ananya M, Preparation of Carvidilol Transdermal Patch and the effect of
Propylene Glycol on Permeation. The Int. Jour. of Pharmacy and Pharmaceutical
Sciences, 2010; 10.
17. https://en.wikipedia.org/wiki/Partition_coefficient.
18. Malani SP et al, Development and validation of analytical method for simultaneous
estimation of miconazole nitrate and clobetasol propionate in cream by hptlc method.
Pharma Science Monitor, 2014; 5(2).
19. Iqbal J, A Photochemistry of clobetasol propionate, a steroidal anti-inflammatory drug,
www.wjpr.net Vol 6, Issue 16, 2017. 883 20. Kumar VM et al. Formulation and Evaluation of Microsponges for Topical Drug Delivery
of Mupirocin. International Journal of PharmTech Research CODEN (USA): IJPRIF,
2013; 5: 434-1440.
21. Abdelmalak NS, Menshawe S, A new topical fluconazole microsponge loaded hydrogel:
preparation and characterization. International journal of pharmacy and pharmaceutical
sciences, 2012, 4.
22. Osmani MRA et al, Microsponge based drug delivery system for augmented gastroparesis
therapy: Formulation development and evaluation. Asian Jour of Phr. Sci., 442-451,
online available at (www.elsevier.com/locate/ajps).
23. Lingan AM et al, Formulation and evaluation of topical drug delivery system containing
clobetasol propionate niosomes. Sci. Revs. Chem. Commun, 2011; 1(1): 7-17.
24. Kumar JR et al, Development and pharmacological evaluations of econazole nitrate
microsperes enriched gel. Scholars Research Library Der Pharmacia Lettre, 2015; 3:
257-265, online available at (http://scholarsresearchlibrary.com/archive.html).
25. Ravi R et al, Microsponges drug delivery system: a review. Int. Jour. of Pharmacy
Review & Research, 2013; 3: 6-11.
26. Aloorkar NH et al, Microsponges as innovative drug delivery system. Int. Journ. Sci.
Nano Tec, 2012; 5: 1597- 1606.
27. Osmani MRA et al, Microsponges based novel drug delivery system for augmented
arthritis therapy, Saudi Pharmaceutical Journal, 2015; 23: 562–572, online available at
(www.ksu.edu.sa), (www.sciencedirect.com).
28. https://www.drugs.com/pro/clobetasol.html.
29.
www.wjpr.net Vol 6, Issue 16, 2017. 884 Appendix – A
www.wjpr.net Vol 6, Issue 16, 2017. 885 Appendix – B
FTIR SPECTRA OF MICROSPONGES FORMULATION INCORPORATED WITH