ANALYTICAL METHOD DEVELOPMENT AND VALIDATION FOR
THE ESTIMATION OF CERITINIB IN PHARMACEUTICAL
FORMULATION BY RP-HPLC
Arun Kumar Kuna*1, S. Ganapaty2 and G. V. Radha3
1,2,3
Gitam Institute of Pharmacy, Gitam University, Visakhapatnam, India.
ABSTRACT
A simple, specific and accurate reverse phase high performance liquid
chromatographic method was developed for the determination of
Ceritinib in pharmaceutical dosage form. The column used was
Kromosil C18, 250 x 4.6 mm, 5, with mobile phase containing Buffer
and Acetonitrile were taken in the ratio of 40:60 the flow rate was 1.0
mL/ min and eluent was monitored at 320nm. The retention time of
Ceritinib was 2.337 min. The linearity of the drug was designed at a
range for which correlation coefficient was 0.9992. The proposed
method was validated and successfully applied to the estimation of
Ceritinib in formulations. Forced degradation studies are conducted to
identify reactions which may occur to degrade a processed product.
KEYWORDS: Ceritinib, RP-HPLC, Validation, Degradation.
INTRODUCTION
Ceritinib is a drug for the treatment of a specific type of lung cancer.[1] It is an anaplastic
lymphoma kinase (ALK) inhibitor.[2] It was approved in April 2014 by the Food and Drug
Administration for the treatment of ALK-positive metastatic non-small cell lung cancer
(NSCLC) following treatment with crizotinib.[1] Structure of Ceritinib shown in fig.1.[3]
FIG: 1
Volume 5, Issue 9, 1349-1357. Research Article ISSN 2277– 7105
*Corresponding Author
Arun Kumar Kuna
Gitam Institute of Pharmacy,
Gitam University,
Visakhapatnam, India. Article Received on 13 July 2016,
Revised on 03 August 2016, Accepted on 23 August 2016
Ceritinib is used for the treatment of adults with anaplastic lymphoma kinase (ALK)-positive
metastatic non-small cell lung cancer (NSCLC) following failure (secondary to resistance or
intolerance) of prior crizotinib therapy. About 4% of patients with NSCLC have a
chromosomal rearrangement that generates a fusion gene between EML4 (echinoderm
microtubule-associated protein-like 4) and ALK (anaplastic lymphoma kinase), which results
in constitutive kinase activity that contributes to carcinogenesis and seems to drive the
malignant phenotype. Ceritinib exerts its therapeutic effect by inhibiting auto
phosphorylation of ALK, ALK-mediated phosphorylation of the downstream signaling
protein STAT3 and proliferation of ALK-dependent cancer cells. Following treatment with
crizotinib (a first-generation ALK inhibitor), most tumours develop drug resistance due to
mutations in key "gatekeeper" residues of the enzyme. This occurrence led to development of
novel second-generation ALK inhibitors such as ceritinib to overcome crizotinib resistance.
The FDA approved Ceritinib in April 2014 due to a surprisingly high response rate (56%)
towards crizotinib-resistant tumours and has designated it with orphan drug status.[4]
Published articles on Ceritinib are as a novel validated stability indicating RP-HPLC method
development for the estimation of Ceritinib in its bulk and finished dosage form as per ICH
guidelines[5] were the retention time is 2.585 min, forced degradation studies and
reversed-phase high-performance liquid chromatographic method validation for the determination of
ceritinib in bulk and its pharmaceutical dosage form[6] were the retention time is 2.539 min
and few more methods proposed for their determinations through different analytical
techniques.
MATERIALS AND METHODS
A Waters HPLC system consisting of a quaternary pump, an inbuilt auto sampler, a column
oven and Waters PDA detector was employed throughout the analysis. The data was acquired
using Empower 2 software and the column used was Kromosil C18, 250 x 4.6 mm, 5.
Double beam Uv-Visible spectroscopy (Make: T60). Labmal sonicator was used for
enhancing dissolution of the compounds. A Metsar make pH meter was used for pH
adjustment. Analytically pure Ceritinib was obtained as gift samples from Spectrum Pharma
Research Solutions, Hyderabad. Solvents were of Analytical grade used for the processing of
(i) Preparation of Mobile phase, Standard Preparation & Sample Preparation Mobile Phase
Buffer (1ml of OPA (Ortho phosphoric acid) in a 1000ml of volumetric flask adds about
900ml of milli-Q water added and degas to sonicate and finally make up the volume with
water) and Acetonitrile were taken in the ratio of 40:60.
Standard Preparation
Accurately Weighed and transferred 15mg of CERITINIB working Standards into a 10 ml
clean dry volumetric flask, add 7ml of diluent, sonicated for 30 minutes and make up to the
final volume with diluents (150µg/ml CERITINIB). From the above stock solution, 1 ml was
pipeted out in to a 10ml Volumetric flask and then make up to the final volume with diluent.
Sample Preparation
Each Capsule was weighed and powdered transfer 150mg in 100 mL volumetric flask, 70mL
of diluent added and sonicated for 25 min, further the volume made up with diluent and
filtered. From the filtered solution 1ml was pipetted out into a 10 ml volumetric flask and
made up to 10ml with diluent.
(ii) Chromatographic conditions
A reverse phase C18 column equilibrated with mobile phase Buffer and Acetonitrile were
taken in the ratio of 40:60 was used. Mobile phase flow rate was maintained at 1.0 mL/min
and eluents was monitored at 320 nm. The sample was injected using a 10 µL fixed loop, and
the total run time was 6.0 min. Appropriate aliquot of Ceritinib stock solutions was taken in
different volumetric flasks and diluted up to the mark with mobile phase to obtain final
concentrations of Ceritinib. The solution was injected and chromatograms were recorded.
Calibration curve was constructed by plotting average peak area versus concentrations and
regression equation was calculated for Ceritinib.
(iii) Uv –Vis Spectroscopy Conditions
The sample was prepared using mobile phase as a diluent and inserted into Uv –Vis
spectroscopy. Then record the spectrum it’s monitored at 320 nm. Appropriate aliquot of
Ceritinib stock solutions was taken in different volumetric flasks and diluted up to the mark
(iv) Determination of Ceritinib in dosage form
For the estimation of Ceritinib from Capsule, one capsule was taken average weight was
calculated and as the sample preparations mentioned above respective solutions were
prepared. The solution was injected at above chromatographic conditions and peak areas
were measured. The quantification was carried out by keeping these values to the straight line
equation of calibration curve. The method was validated for accuracy, precision, LOD, LOQ,
Specificity, Robustness and Ruggedness.
(v) Accuracy
The accuracy of the method was determined by calculating recovery of Ceritinib by the
spiked method. Known amount of Ceritinib was added to a pre quantified sample solution,
and the amount of Ceritinib was estimated by measuring the peak areas and by fitting these
values to the straight-line equation of calibration curve.
(vi) Precision
Precision studies were performed (Method & day to day). The results are reported in terms of
relative standard deviation. The Repeatability studies were carried out by estimating response
of 6 different concentrations of Ceritinib and results are reported in terms of relative standard
deviation (%RSD). % RSD was 0.67, for Method precision it was 0.8 and for day to day
precision it was 0.57.
(vii) LOD and LOQ Limits
The level of quantification (LOQ) and detection (LOD) were conducted on the basis of signal
to noise ratio method.
(vii) Specificity
It is the ability to assess unequivocally the analyte in the presence of components that may be
expected to be present. Commonly used excipients were spiked into a pre weighed quantity
of drugs. The chromatogram was taken by appropriate dilutions and the quantities of drugs
were determined.
(viii) Robustness
The robustness of an analytical procedure is a measure of its capacity to remain unaffected by
small, but deliberated variations in method parameters and provides an indication o f its
the chromatographic parameters: Effect of Variation in column oven temperature ± % 10 and
the flow 0.9 and 1.1 ml/min instead of 1.0 ml/min.
(ix) Ruggedness
The ruggedness of test method was demonstrated by carrying out precision study in six
preparation of sample on a single batch sample by different analyst. The results of the study
are tabulated.
Degradation
To understand the degradation behavior, degradation studies performed. Prepared samples
were employed for acid, base, peroxide, water, UV and thermal conditions. Results and
chromatograms are detailed in results and discussion.
RESULTS AND DISCUSSION
Optimization of mobile phase was performed based on asymmetric factor and peak area
obtained for Ceritinib. The mobile phase Buffer (1ml of OPA (Ortho phosphoric acid) in a
1000ml of volumetric flask adds about 900ml of milli-Q water added and degas to sonicate
and finally make up the volume with water) and Acetonitrile were taken in the ratio of 40:60
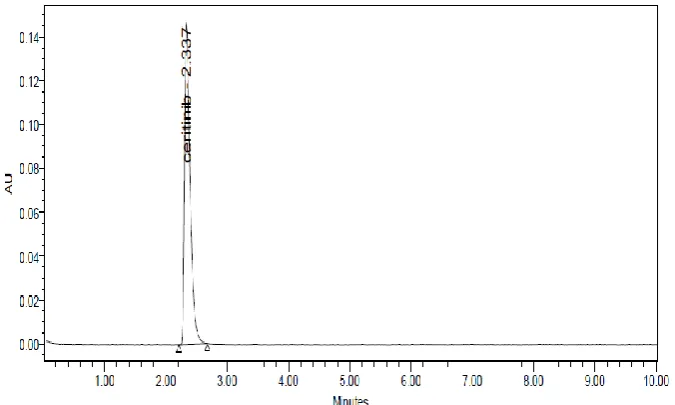
was found to be satisfactory and gave symmetric peak for Ceritinib. The retention time for
[image:5.595.130.468.482.684.2]Ceritinib was 2.337 min, shown in fig. 2.
FIG 2: HPLC chromatogram of Ceritinib in optimized chromatographic conditions
The calibration curve for Ceritinib was obtained by plotting the peak area of Ceritinib versus
with r2 = 0.9992, shown in fig.3. The validation parameters are summarized in Table 1. The
recovery of Ceritinib was found to be 100.31%. The system suitability test parameters are
shown in Table 1. The liquid chromatographic method was applied to the determination of
Ceritinib in dosage form. The results for Ceritinib were comparable with the corresponding
[image:6.595.147.450.188.377.2]labeled amount.
FIG. 3: Calibration curve of Ceritinib.
Table 1: Validation parameters and data for proposed methods
Validation parameter Results
(HPLC)
Linearity 25-150 µg/mL
Regression coefficient (r2) 0.9992
*Accuracy (% recovery) 100.31%
** System Precision (%RSD) 0.57
** Method precision(%RSD) 0.80
Assay value (%) 99.40%
System suitability parameter
Tailing factor 1.6
Number of theoretical plates 3242
* Replicates of three concentration levels (in three determinations);
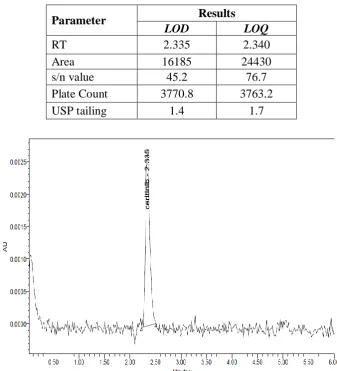
The results of both LOD & LOQ values were tabulated in Table-2 and the chromatograms
Table 2: LOD and LOQ data for proposed methods.
Parameter Results
LOD LOQ
RT 2.335 2.340
Area 16185 24430
s/n value 45.2 76.7
Plate Count 3770.8 3763.2
[image:7.595.134.459.506.733.2]USP tailing 1.4 1.7
FIG. 4: Chromatogram Showing results for Limit of Detection.
Ruggedness details generated after experiment are as follows;
Table 3: Ruggedness data
S. No RT Area USP Plate Count USP Tailing
1 2.323 1391000 3414 1.66
2 2.328 1405413 3481 1.67
3 2.329 1396680 3348 1.66
4 2.329 1405905 3369 1.66
5 2.331 1400832 3328 1.66
6 2.331 1402850 3353 1.66
Degradation details with respect to study are as follows
Table 4: Degradation study data.
S. No Study RT Area USP Plate Count USP Tailing
1 Acid Degradation 2.419 1335011 10205 1.6
2 Base Degradation 2.488 1346697 8466 1.0
3 Peroxide Degradation 2.344 1313309 3807 1.5
4 Thermal Degradation 2.335 1362774 3319 1.6
5 UV Degradation 2.334 1370480 3242 1.6
6 Water Degradation 2.337 1377995 3372 1.6
CONCLUSION
Proposed study describes a RP-HPLC method for the estimation of Ceritinib using simple
mobile phase when compared to the reported method. The method gives short analysis time
(<5 min). The method was validated and found to be simple, sensitive, accurate and precise
by HPLC analytical methods. Percentage of recovery shows that the method is free from
interference of the excipients used in the formulation. Therefore, the proposed method can be
used for routine analysis of Ceritinib in dosage form.
ACKNOWLEDGEMENT
The authors thank Dr. Jagadeesh Kumar Kuna, RMC Kakinada for his encouragement and
support in providing necessary support for this work. We greatly acknowledge the receipt of
material and research support from Spectrum Labs, Hyderabad.
REFERENCES
1. “FDA Approves Ceritinib for ALK- Positive Lung Cancer”. 29 April 2014.
2. Shaw AT, Kim DW, Mehra R, Tan DS, Felip E, Chow LQ, Camidge DR, Vansteenkiste
J, Sharma S, De Pas T, Riely GJ, Solomon BJ, Wolf J, Thomas M, Schuler M, Liu G,
Santoro A, Lau YY, Goldwasser M, Boral AL, Engelman JA. Ceritinib in
3. https://en.m.wikipedia.org/wiki/Ceritinib.
4. https://en.wikipedia.org/wiki/File:Ceritinib.svg.