DEVELOPEMENT AND VALIDATION OF STABILITY INDICATING
RP-HPLC METHOD FOR THE ESTIMATION OF METOPROLOL
AND IVABRADINE IN SOLID DOSAGE FORM
Bidkar J. S.*, Vare S.R., Dama G. Y., Shelke M. M. and Dhokare A. M.
SGMSPM’s Sharachandra Pawar College of Pharmacy, Dumberwadi, Otur. Tal- Junner Dist-Pune.
ABSTRACT
A simple, Accurate, precise method was developed for the simultaneous estimation of the Metoprolol and Ivabradine in Tablet dosage form. Chromatogram was run through Agilent C18 150 x 4.6 mm, 5. Mobile phase containing Buffer 0.01N KH2PO4 (3.75pH):
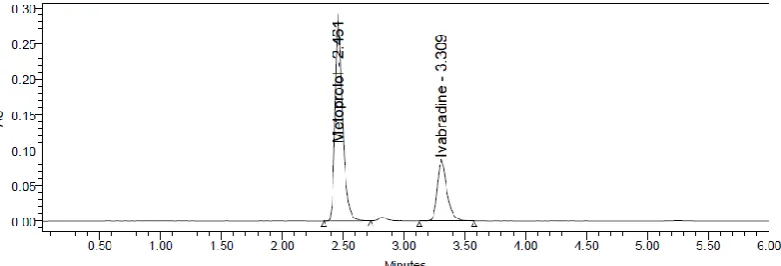
Acetonitrile taken in the ratio 50:50 was pumped through column at a flow rate of 0.8 ml/min. Buffer used in this method was 0.01N KH2PO4. Temperature was maintained at 30°C. Optimized wavelength selected was 260.0nm. Retention time of Metoprolol and Ivabradine were found to be 2.461min and 3.309min. %RSD of the Metoprolol and Ivabradine were and found to be 0.7 and 0.7
respectively. % Recovery was obtained as 100.14% and 100.01% for Metoprolol and Ivabradine respectively. LOD, LOQ values obtained from regression equations of Metoprolol and Ivabradine were 0.41, 1.23 and 0.28, 0.85 respectively. Regression equation of Metoprolol is y = 12344x + 11645. And y = 23564x + 1992.2 of Ivabradine. Retention times were decreased and run time was decreased, so the method developed was simple and economical that can be adopted in regular Quality control test in Industries.
KEYWORDS: Metoprolol, Ivabradine, RP-HPLC, Excipients, Validation.
INTRODUCTION
Ivabradine: Ivabradine is a novel pulse bringing down medication for the symptomatic administration of stable angina pectoralis and symptomatic perpetual heart disappointment. Ivabradine acts by specifically hindering the "amusing" channel pacemaker current (If) in the
Volume 8, Issue 7, 1742-1768. Research Article ISSN 2277– 7105
Article Received on 01 April 2019,
Revised on 23 April 2019, Accepted on 12 May 2019,
DOI: 10.20959/wjpr20197-15111
*Corresponding Author
Bidkar J. S.
SGMSPM’s Sharachandra
Pawar College of Pharmacy,
Dumberwadi, Otur. Tal-
sinoatrial hub in a portion subordinate design, bringing about a lower pulse and in this manner more blood to stream to the myocardium.[11] Despite the fact that non-dihydropyridine calcium channel blockers and beta blockers additionally adequately bring down pulse, they show antagonistic occasions because of their negative inotropic impacts.
Fig 1: Structure of Ivabradine.
Table No 1: Drug profile of Ivabradine.
CAS Number 155974-00-8
IUPAC Name
3-[3-({[(7S)-3,4-dimethoxybicyclo[4.2.0]octa-1,3,5 trien-7-yl]methyl}(methyl)amino)propyl]-7,8 dimethoxy-2,3,4,5-tetrahydro-1H-3-benzazepin-2-one
Molecular Weigh 468.594 Molecular Formula C27H36N2O5
Appearance Powder Physical State Solid
Solubility ethanol, DMSO, and dimethyl formamide Melting Point >190ºC
pK Values 9.37
Metoprolol
[image:2.595.110.486.346.527.2]Fig 2: Chemical structure of Metoprolol.
Table no 2: Drug profile of Metoprolol.
MATERIALS AND METHODS
Instrumentation
Electronics Balance-Denver
pH meter -BVK enterprises, India
Ultrasonicator-BVK enterprises
WATERS HPLC 2695 SYSTEM equipped with quaternary pumps, Photo Diode Array detector and Auto sampler integrated with Empower 2 Software.
UV-VIS spectrophotometer PG Instruments T60 with special bandwidth of 2 mm and 10mm and matched quartz cells integrated with UV win 6 Software was used for measuring absorbance of Ivabradine and Metoprolol solutions.
Preparation of solution
Preparation of mobile phase
Based up on the solubility of the drugs, diluent was selected, Acetonitrile and 0.01N KH2PO4
taken in the ratio of 50:50.
CAS Number 51384-51-1
IUPAC Name 1-[4-(2-methoxyethyl)phenoxy]-3-[(propan-2-yl)amino]propan-2-ol Molecular Weigh 267.3639
Molecular Formula C15H25NO3
Appearance white crystalline powder Physical State Solid
Solubility water, methanol & sparingly soluble in ethanol Melting Point 120 °C
Preparation of Diluent
The mobile phase itself is used as a diluent.
Preparation of Standard stock solutions: Accurately weighed 5 mg of Ivabradine, 25 mg of Metoprolol and transferred to individual 25 ml volumetric flasks separately. 3/4 Th of diluents was added to both of these flasks and sonicated for 10 minutes. Flasks were made up with diluents and labeled as Standard stock solution 1and 2. (200µg/ml of Ivabradine and 1000µg/ml of Metoprolol).
Preparation of Standard working solutions (100% solution): 1ml from each stock solution was pipetted out and taken into a 10ml volumetric flask and made up with diluent. (20µg/ml Ivabradine of and 100µg/ml of Metoprolol).
Preparation of Sample stock solutions: 10 tablets were weighed and the average weight of each tablet was calculated, then the weight equivalent to 1 tablet was transferred into a 50 ml volumetric flask, 25ml of diluents was added and sonicated for 25 min, further the volume was made up with diluent and filtered by HPLC filters (100µg/ml of Ivabradine and 500µg/ml of Metoprolol).
Preparation of Sample working solutions (100% solution): 2ml of filtered sample stock solution was transferred to 10ml volumetric flask and made up with diluent. (20µg/ml of Ivabradine and 100µg/ml of Metoprolol).
Preparation of buffer
0.1% OPABuffer: 1ml of Conc Ortho Phosphoric acid was diluted to 1000ml with water.
0.01N KH2PO4 Buffer: Accurately weighed 1.36gm of Potassium dihyrogen Ortho
phosphate in a 1000ml of Volumetric flask add about 900ml of milli-Q water added and degas to sonicate and finally make up the volume with water then PH adjusted to 3.48 with dil. Orthophosphoric acid solution.
Solution preparation for System suitability parameters
The system suitability parameters were determined by preparing standard solutions of Ivabradine (20ppm) and Metoprolol (100ppm) and the solutions were injected six times and the parameters like peak tailing, resolution and USP plate count were determined.
Solution preparation for Precision
Preparation of Standard stock solutions: Accurately weighed 5 mg of Ivabradine, 25 mg of Metoprolol and transferred to individual 25 ml volumetric flasks separately. 3/4 th of diluents was added to both of these flasks and sonicated for 10 minutes. Flasks were made up with diluents and labeled as Standard stock solution 1and 2. (200µg/ml of Ivabradine and 100µg/ml of Metoprolol).
Preparation of Standard working solutions (100% solution): 1ml from each stock solution was pipetted out and taken into a 10ml volumetric flask and made up with diluent. (20µg/ml Ivabradine of and 100µg/ml of Metoprolol).
Preparation of Sample stock solutions: 10 tablets were weighed and the average weight of each tablet was calculated, then the weight equivalent to 1 tablet was transferred into a 50 ml volumetric flask, 25ml of diluents was added and sonicated for 25 min, further the volume was made up with diluent and filtered by HPLC filters(100µg/ml of Ivabradine and 500µg/ml of Metoprolol).
Preparation of Sample working solutions (100% solution): 2ml of filtered sample stock solution was transferred to 10ml volumetric flask and made up with diluent. (20µg/ml of Ivabradine and 100µg/ml of Metoprolol).
Solution preparation for Accuracy
Preparation of Standard stock solutions: Accurately weighed 5 mg of Ivabradine, 25 mg of Metoprolol and transferred to individual 25 ml volumetric flasks separately. 3/4 th of diluents was added to both of these flasks and sonicated for 10 minutes. Flasks were made up with diluents and labeled as Standard stock solution 1and 2. (200µg/ml of Ivabradine and 1000µg/ml of Metoprolol).
Preparation of 50% Spiked Solution: 0.5ml of sample stock solution was taken into a 10ml volumetric flask, to that 1.0ml from each standard stock solution was pipetted out, and made up to the mark with diluent.
Preparation of 150% Spiked Solution: 1.5ml of sample stock solution was taken into a 10ml volumetric flask, to that 1.0ml from each standard stock solution was pipetted out, and made up to the mark with diluent.
LOD sample Preparation: 0.25ml each from two standard stock solutions was pipetted out and transferred to two separate 10ml volumetric flasks and made up with diluents. From the above solutions 0.1ml each of Ivabradine, Metoprolol, solutions respectively were transferred to 10ml volumetric flasks and made up with the same diluents.
LOQ sample Preparation: 0.25ml each from two standard stock solutions was pipetted out and transferred to two separate 10ml volumetric flask and made up with diluent. From the above solutions 0.3ml each of Ivabradine, Metoprolol, and solutions respectively were transferred to 10ml volumetric flasks and made up with the same diluent.
Optimized chromatographic conditions
After systematic and detailed study of the various parameters involved in the method, the following conditions were employed.
Mobile phase : 50% 0.01N KH2PO4 buffer: 50% Acetonitrile v/v
Flow rate : 0.8ml/min
Column : Agilent C18 (4.6 x 150mm, 5µm)
Detector wave length : 260.0nm
Column temperature : 30°C
Injection volume : 10L
Run time : 6min
Diluent : 0.01N KH2PO4 and Acetonitrile in the ratio 50:50 v/v
Procedure
% Assay
Where
AT = Peak Area of Metoprolol/Ivabradine obtained with test preparation AS = Peak Area of Metoprolol/Ivabradine obtained with standard preparation WS = Weight of working standard taken in mg
WT = Weight of sample taken in mg DS = Dilution of Standard solution DT = Dilution of sample solution
[image:7.595.103.490.328.714.2]P = Percentage purity of working standard
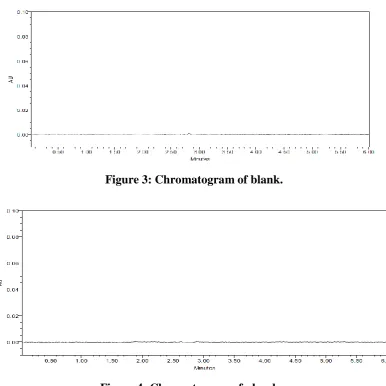
Figure 3: Chromatogram of blank.
Figure 5: Chromatogram of standard solution
Analytical method validation
System suitability
[image:8.595.73.524.406.702.2]To ascertain its effectiveness 10μL of freshly prepared standard solution containing Ivabradine 20μg/ml and Metoprolol 100 μg/ml was injected 6 times into the HPLC system by using optimized chromatographic conditions and System suitability results were calculated. All the results were tabulated in the below table.
Table 4: System suitability parameters for Metoprolol and Ivabradine.
Sr no Metoprolol Ivabradine
Inj RT(min) USP Plate
Count Tailing RT(min)
USP Plate
Count Tailing Resolution
1 2.458 8018 1.32 3.309 8050 1.32 6.4 2 2.458 6973 1.37 3.311 8931 1.34 6.5 3 2.461 7931 1.31 3.311 8592 1.31 6.4 4 2.462 7483 1.29 3.313 8366 1.30 6.5 5 2.463 7630 1.29 3.314 8476 1.30 6.5 6 2.463 7533 1.28 3.315 8534 1.30 6.5
Interference from degradation product
Preparation of degradation sample
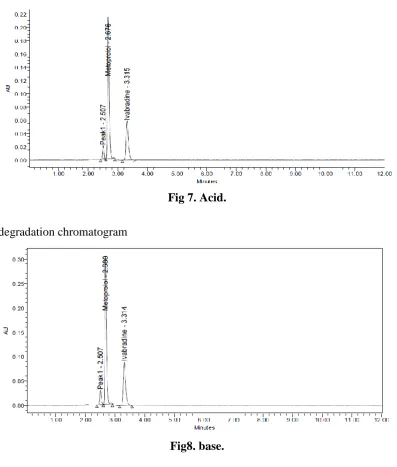
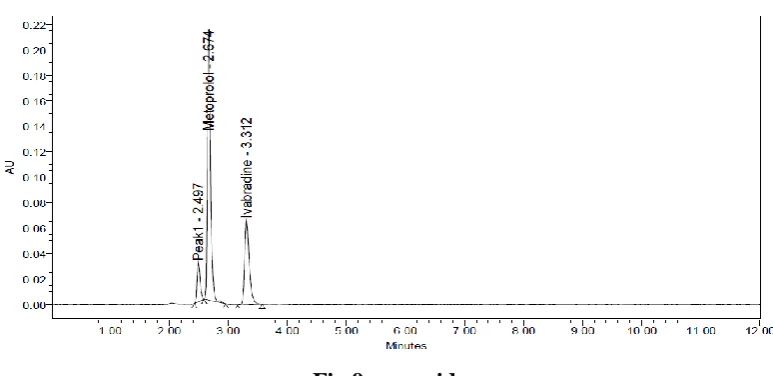
Preparation of sample for acid degradation: Metoprolol and Ivabradine sample was refluxed with the 1M HCl at 60°C for 1hour and then neutralized with 1N NaOH. The sample was prepared as per the test method and then further diluted upto the required concentration with the diluent.
Preparation of sample for alkaline degradation: Metoprolol and Ivabradine sample was refluxed with the 1M NaOH at 60°C for 1hour and then neutralized with 1N HCl The sample was prepared as per the test method and then further diluted upto the required concentration with the diluents.
Preparation of sample for peroxide degradation: Metoprolol and Ivabradine sample was refluxed with the 10%H2O2 by heating on water bath at 60°C for 1 hour. The sample was prepared as per the test method and then further diluted upto the required concentration with the diluent.
Preparation of sample for UV degradation: Metoprolol and Ivabradine sample was exposed to UV (200watt-hr/m2) and visible (1.2 million lux hrs) The sample was prepared as per the test method and then further diluted upto the required concentration with the diluent.
Preparation of sample for thermal degradation: Metoprolol and Ivabradine sample was exposed to temperature at 105°c for 24hrs. The sample was prepared as per the test method and then further diluted upto the required concentration with the diluent.
Preparation of sample for humidity degradation: Metoprolol and Ivabradine sample was
exposed to 85% humidity for 24hrs. The sample was prepared as per the test method and then further diluted up to the required concentration with the diluent.
Table 3: Degradation data.
Type of degradation
Metoprolol Ivabradine
AREA %RECO
VERED
%
DEGRADED AREA
%RECOV ERED
% DEGRADED
Acid 1180726 94.64 5.36 434723 91.69 8.31 Alkaline 1165907 93.45 6.55 440204 92.84 7.16 Peroxide 1206990 96.74 3.26 453827 95.72 4.28 Thermal 1212360 97.17 2.83 462725 97.59 2.41 Uv 1231187 98.68 1.32 468309 98.77 1.23 Humidity 1239663 98.68 1.32 471394 99.42 0.58
Degradation chromatograms
[image:10.595.102.490.514.715.2]Acid degradation chromatogram
Fig 7. Acid.
Base degradation chromatogram
Peroxide degradation chromatogram
Fig 9: peroxide.
Thermal degradation chromatogram
Fig 10: thermal.
Uv degradation chromatogram
[image:11.595.81.498.100.722.2]Water degradation chromatogram
Fig12: Water.
Method precision
From a single volumetric flask of working standard solution six injections were given and the obtained areas were mentioned in table. Average area, standard deviation and % RSD were calculated for two drugs. % RSD obtained as 0.5% and 0.6% respectively for Metoprolol and Ivabradine. As the limit of Precision was less than “2” the system precision was passed in this method.
Table 4: System precision table of Metoprolol and Ivabradine.
S. No Area of Metoprolol Area of Ivabradine
1. 1239246 476109 2. 1252215 469516 3. 1242319 470850 4. 1246866 473201 5. 1233067 472074 6. 1242272 477400 Mean 1242664 473192 S.D 6525.9 3048.4
%RSD 0.5 0.6
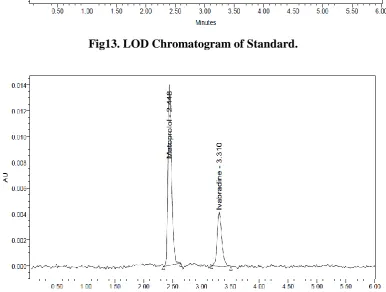
LOD AND LOQ
Table 5: Sensitivity table of Metoprolol and Ivabradine.
Molecule LOD LOQ
Metoprolol 0.41 1.23
[image:13.595.104.491.359.651.2]Ivabradine 0.28 0.85
Fig13. LOD Chromatogram of Standard.
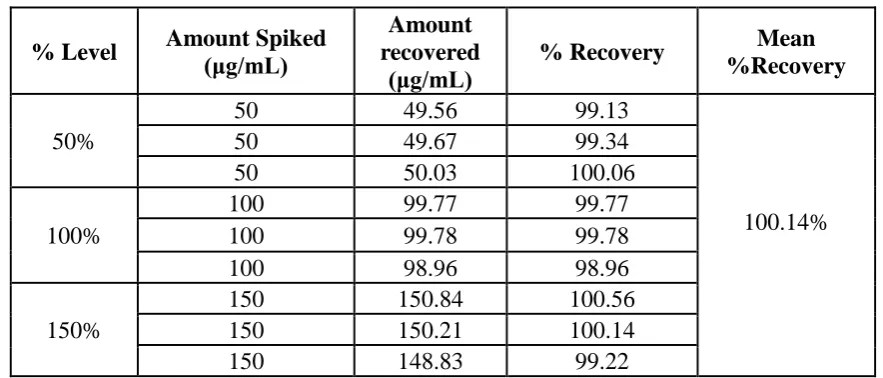
Accuracy
[image:14.595.76.518.186.375.2]Three levels of Accuracy samples were prepared by standard addition method. Triplicate injections were given for each level of accuracy and mean % Recovery was obtained as 100.14% and 100.01% for Metoprolol and Ivabradine respectively.
Table 6: Accuracy table of Metoprolol.
% Level Amount Spiked (μg/mL)
Amount recovered
(μg/mL)
% Recovery Mean
%Recovery
50%
50 49.56 99.13
100.14% 50 49.67 99.34
50 50.03 100.06
100%
100 99.77 99.77 100 99.78 99.78 100 98.96 98.96
150%
150 150.84 100.56 150 150.21 100.14 150 148.83 99.22
Table 7: Accuracy table of Ivabradine.
% Level Amount Spiked
(μg/mL) Amount recovered (μg/mL) % Recovery Mean %Recovery 50%
10 10.05 100.46
100.01% 10 9.92 99.18
10 10.00 100.03
100%
20 20.19 100.94 20 20.04 100.20 20 20.10 100.48
150%
30 29.82 99.39 30 29.81 99.38 30 30.02 100.07
Fig No15. Accuracy 50% Chromatogram of Metoprolol and Ivabradine
[image:15.595.72.527.356.748.2]Fig No17. Accuracy 150% Chromatogram of Metoprolol and Ivabradine.
Linearity and Range
Linearity of the detector response was established by plotting a graph of concentration versus peak area. A series of solutions of standard were prepared by appropriate dilutions of linearity standard stock solution.
Solution preparation for Linearity
Preparation of Standard stock solutions: Accurately weighed 5 mg of Ivabradine, 25 mg of Metoprolol and transferred to individual 25 ml volumetric flasks separately. 3/4 th of diluents was added to both of these flasks and sonicated for 10 minutes. Flasks were made up with diluents and labeled as Standard stock solution 1and 2. (200µg/ml of Ivabradine and 1000µg/ml of Metoprolol).
50% Standard solution: 0.5ml each from two standard stock solutions was pipetted out and made up to 10ml. (10µg/ml of Ivabradine and 50µg/ml of Metoprolol).
75% Standard solution: 0.75ml each from two standard stock solutions was pipetted out and made up to 10ml. (15µg/ml of Ivabradine and 75µg/ml of Metoprolol).
100% Standard solution: 1.0ml each from two standard stock solutions was pipetted out and made up to 10ml. (20µg/ml of Ivabradine and 100µg/ml of Metoprolol).
125% Standard solution: 1.25ml each from two standard stock solutions was pipetted out and made up to 10ml. (25µg/ml of Ivabradine and 125µg/ml of Metoprolol).
[image:17.595.106.488.357.673.2]150% Standard solution: 1.5ml each from two standard stock solutions was pipetted out and made up to 10ml (30µg/ml of Ivabradine and 150µg/ml of Metoprolol).
Table 8: Linearity table for Metoprolol and Ivabradine.
Metoprolol Ivabradine
Conc (μg/mL) Peak area Conc (μg/mL) Peak area
0 0 0 0
25 329974 5 125343 50 623373 10 234401 75 932668 15 352439 100 1278540 20 477381 125 1547073 25 589104 150 1850470 30 709475
Fig No19.Calibration curve of Ivabradine
[image:18.595.75.518.279.530.2]Chromatogram of Linearity
Fig No. 6.18 Linearity 50% Chromatogram of Metoprolol and Ivabradine.
Fig No. 21.Linearity 75% Chromatogram of Metoprolol and Ivabradine.
[image:19.595.76.517.508.741.2]Fig No 23: Linearity 125% chromatogram of Metoprolol & Ivabradine.
Fig No24. Linearity 150% Chromatogram of Metoprolol and Ivabradin
Robustness
[image:20.595.74.520.350.578.2]Table 9: Robustness data for Metoprolol and Ivabradine.
S.no Condition %RSD of
Metoprolol
%RSD of Ivabradine
1 Flow rate (-) 0.7ml/min 1.0 1.3 2 Flow rate (+) 0.9ml/min 1.0 0.8 3 Mobile phase (-) 55B:45A 0.5 0.5 4 Mobile phase (+) 45B:55A 0.8 0.4 5 Temperature (-) 25°C 0.8 0.9 6 Temperature (+) 35°C 0.5 0.6
[image:21.595.74.520.236.603.2]Chromatogram of Robustness
Fig No24.Flow minus Chromatogram of Metoprolol and Ivabradine.
Fig No25.Flow plus Chromatogram of Metoprolol and Ivabradine.
[image:22.595.76.522.321.686.2]
Fig No. 27. Mobile phase Plus Chromatogram of Metoprolol and Ivabradine.
Fig No28.Temperature minus Chromatogram of Metoprolol and Ivabradine.
Fig No29: Temperature plus Chromatogram of Metoprolol and Ivabradine
RESULT AND DISCUSSION
[image:24.595.73.520.211.569.2]run time, flow rate but unsuccessful in getting good peaks with less run time. Then method was optimized to separate the main peak.
The satisfactory chromatographic separation, with good peak shapes were achieved on Agilent C18 (4.6 x 150mm, 5µm) column and mobile phase 0.01N KH2PO4 buffer: Acetonitrile (50:50) with a flow rate of 0.8 ml/min. All the System Suitability parameters are within the acceptance limits. The calibration curve for Metoprolol and Ivabradine was obtained by plotting the respective peak areas against their concentration. The graph was found to be linear over the range 25-150µg/ml and 5-30µg/ml for Metoprolol and Ivabradine with the correlation coefficient 0.999 for two drugs which shows that the good correlation exists between peak area and concentration of the drug. This is precise. The high % recovery values obtained for these drugs show that the method is accurate. The LOD value of Metoprolol and Ivabradine was found to be 0.41μg/ml and 0.28μg/ml respectively. The LOQ was 1.23μg/ml and 0.85μg/ml respectively. The low values of LOD and LOQ show that the method is sensitive and can estimate at micro gram level. The absence of additional peaks indicates the method is specific and the drug was stable in the diluents for 24 hours which is sufficient to complete the work. Also robustness values found within the limit. The stability indicating studies were performed for the above mentioned drug viz…. acid, alkali, thermal, humidity, UV, peroxide and the percentage degradation of Metoprolol was found 5.36%, 6.55%, 2.83%,1.32%,1.32%,3.26% And the percentage degradation of Ivabradine was found 8.31%, 7.16%, 2.41%, 0.58%, 1.23%, 4.28% respectively.
CONCLUSION
REFERENCE
1. R. S. Satoskar, S. D. Bhandarkar and S. S. Ainapure. “Pharmacology and Pharmacotherapeutics”, 17th edition, Popular Prakashan, Mumbai, India, 2001.
2. “Burger’s Medicinal Chemistry and drug discovery”, 6 th edition, Wiley Interscience, New Jersey, 2007.
3. “Wilson and Gisvold’s Textbook of Organic Medicinal and Pharmaceutical Chemistry”, 11th edition, Lippincott Williams & Wilkins, New york, 2004.
4. A. Korolkovas. “Essentials of Medicinal Chemistry”, 2nd edition, Wiley Interscience, New Jersey, 1988.
5. “Goodman and Gilman’s The Pharmacological Basis of Therapeutics”, 9th edition, McGraw-Hill health professions division, New york, 1996.
6. Foye’s “Principles of Medicinal Chemistry”, 6th edition, Lippincott Williams & Wilkins, New york, 2008.
7. Drugs & Cosmetics Act, 1940 & Rules, 1945, 2nd edition, Susmit publishers, Mumbai, India, 2000.
8. Indian Pharmacopoeia, Ministry of Health & Family Welfare, Government of India, New Delhi, 1996.
9. The United States Pharmacopoeia- the National Formulary, United States Pharmacopoeial convention, Rockville, 2007.
10.British Pharmacopoeia, The Stationary Office, London, 2005.
11.“Martindale - The Extra Pharmacopoeia”, 33rd edition, The Pharmaceutical Press, London, 2002; 7.
12.A. H. Beckett and J. B. Stenlake. “Practical Pharmaceutical Chemistry”, Volume I and II, CBS Publishers & Distributors, New Delhi, India, 2000.
13.P. D. Sethi. “Quantitative Analysis of Drugs in Pharmaceutical Formulations”. 3 rd edition, CBS Publishers & Distributors, New Delhi, India, 1997.
14.H. H. Willard, L. L. Merrit, J. A. Dean and F. A. Settle. “Instrumental Method of Analysis”, 7th edition, CBS Publishers & Distributors, New Delhi, India, 1986.
15.R. A. Day and A. L. Underwood. “Quantitative Analysis”, 6th edition, PHI learning private limited, New Delhi, India, 2009.
16.https://www.drugbank.ca/drugs/DB09083
17.https://www.scbt.com/scbt/product/ivabradine-d3-hydrochloride-1217809-61-4 18.https://www.drugbank.ca/drugs/DB00264
20.Sagarika, Panda. Srikanta, Patra. Rapid and Selective UV Spectrophotometric and RP-HPLC Methods for Dissolution Studies of Ivabradine controlled Release Formulations.
Pharma Tutor, 2014; 2(8): 201-213.
21.Bhosale Swati, D.; VanjariSuvarna, S.;Jagtap Nikhil, S. Development and validation of stability indicating spectrophotometric method for the estimation of ivabradine hydrochloride in bulk and in tablet formulation. Wjpps, 2016; 5(7): 1919-1927.
22.Sunitha, Seerapu.; Srinivasan, B. P.Development and Validation of RP-HPLC Method for the Estimation of Ivabradine Hydrochloride in Tablets. Indian J Pharm Sci, 2010; 72(5): 667–671.
23.Muzaffar-ur- Rehman, Md.; Nagamallika, G.Validated RP-HPLC Method for the Determination of Ivabradine Hydrochloride in Pharmaceutical Formulation. Int. J.
Pharm. Sci. Drug Res, 2017; 9(5): 228-233.
24.Mahaparale, S.I; Gonjari, D.; Jaya veera, K.N. Stability indicating hplc method for simultaneous estimation of metoprolol succinate and telmisartan. Journal of Liquid
Chromatography & Related Technologies, 2013; 36(18): 2601-2611.
25.Selvakumar.; Pandiyan.; Rajagopal. Development and validation of stability indicating rapid hplc method for estimation of ivabradine hydrochloride in solid oral dosage form.
IJPPS, 2014; 6(4): 378-382.
26.Naveen Kumar, C.H.; Saraswathi Mannuri.; Vijaya Kuchana.; Kannappan, N. Development and validation of a stability indicating RP-HPLC method for determination of metoprolol succinate in pharmaceutical dosage forms. Der Pharmacia Sinica, 2014;