DEVELOPMENT AND VALIDATION OF UV SPECTROSCOPIC
METHOD FOR DETERMINATION OF CAPECITABINE IN API AND
FORMULATION
*E. Ramakrishna Goud, R. Nageswara Rao, S. Sulakshana, V. Ravisankar, L. Siva
Sankar Reddy
Department of Pharmaceutical Analysis and Quality Assurance, Creative Educational Society’s College of Pharmacy, JNTUA, Kurnool, Andhra Pradesh.
ABSTRACT
An effort has been made to develop a simple, accurate method to estimate capecitabine in API and pharmaceutical preparation and to validate the method, according to ICH guidelines. The absorbance maxima was recorded at a wavelength of 303 nm for phosphate buffer pH 7.4 which is shown in Beers law range was confirmed by linear curve of capecitabine, shown Linearity for capecitabine at concentration range of 10-30μg/ml. From the above studies the optical characteristics such as linearity range (10-30μg/ml), for phosphate buffer pH 7.4 of correlation coefficient (0.999), slope (0.0266) and intercept (0.0025) were calculated and results were found to be satisfactory. Quantitative data subjected to statistical analysis. The % RSD values < 2 indicate the precision of methodology. The accuracy was confirmed by recovery studies by adding a known amount of pure drug to the previously analyzed formulation and the mixture was analyzed by the proposed method was found to be 98% - 102%. The values are given in recovery was confirmed and shown.
KEYWORDS: UV-Spectrophotometry, Capecitabine, Validation.
INTRODUCTION
Capecitabine is chemically Pentyl[1-(3,4-dihydroxy-5-methyl-tetrahydrofuran-2-yl)-5-fluoro-2-oxo-1H-pyrimidin-4-yl] amino methanoate. Its Molecular formula is C15H22FN3O6 and
possessing a molecular weight of 359.35. It is Soluble in aqueous solvents and insoluble in
Volume 6, Issue 8, 1468-1475. Research Article ISSN 2277– 7105
*Corresponding Author
E. Ramakrishna Goud
Department of
Pharmaceutical Analysis
and Quality Assurance,
Creative Educational
Society’s College of
Pharmacy, JNTUA,
Kurnool, Andhra Pradesh. Article Received on 30 May 2017,
Revised on 20 June 2017, Accepted on 10 July 2017
organic solvents. Capecitabine is used as an anti-cancer drug. The structural formula of Capecitabine is shown in fig-1. Analytical methods are required to characterize drug substances and drug products composition during all phases of pharmaceutical development in the recent era. Standard analytical procedure for newer drugs or formulation may not be available in pharmacopoeia. Only few method are available like UV, Visible and RP-HPLC methods. Hence, it is essential to develop newer analytical methods, which are accurate, precise, and specific, linear, simple and rapid. From the extensive literature survey, it was revealed that there were a very few methods reported for pharmaceutical dosage forms. Therefore, here an attempt was made to develop simple, cost effective and accurate method.
MATERIALS AND METHODS
Materials
Capecitabine obtained as a gift sample from, Celon laboretories, HYD, all the chemicals used are of analytical grade.
Instrument
LAB INDIA –Double Beam UV-VIS Spectrophotometer3000+ with a pair of 1.0 cm matched quartz cells was used for the measurement of absorbance.
METHODOLOGY
SELECTION OF SOLVENT
The solubility of capecitabine was determined in a variety of solvents as per Indian Pharmacopeia standards. Solubility test was carried out in different polar and nonpolar solvents from the solubility studies, phosphate buffer pH 7.4 were selected as suitable solvents for the proposed method.
PREPARATION OF STANDARD STOCK SOLUTION
Standard stock solution was prepared by dissolving, accurately weighed 10 mg of CAPECITABINE in phosphate buffer pH7.4 and the volume was made up to 10 ml with phosphate buffer pH7.4 in 10 ml volumetric flask (1° Stock solution, 1000 µg / ml).
DETERMINATION OF ABSORBANCE MAXIMA (λ max)
concentration of 10µg/ml. The absorbance of resulting solution was measured against respective blank solution (phosphate buffer pH 7.4) in the UV region of 200-400 nm, which shows maximum absorbance at 303 nm.
ANALYSIS OF MARKETED FORMULATION
10 tablets of CAPECITABINE were weighed, pulverized and the powder equivalent to 100 mg of CAPECITABINE was weighed accurately and transferred into a 100 ml standard volumetric flask. This solution was sonicated for 10minutes. After sonication the solution was centrifuge at 100 rpm for 10 minutes the solution was filtered through Whatmann filter paper number 41. 0.2 ml of above solution was diluted to 10 ml with phosphate buffer pH 7.4 to obtain a solution of 20 µg / ml. same concentration was repeated three times.
METHOD VALIDATION
ACCURACY
Accuracy is the closeness to the true value. To study the accuracy, 10 tablets of Capecitabine were taken, and the powder was used to carry out the analysis. Recovery studies were carried out by addition of standard drug solution (80%, 100%, 120% μg/ml) to the sample at 3 different concentration levels and results were presented in Table No: 3.
PRECISION
The precision of an analytical method is the degree of agreement among individual test results when the method is applied repeatedly to multiple samplings of homogeneous samples shown in Table 5 & 6.
Intra and inter-day precision
A variation of results within the same day (intra-day), variation of results between days (inter-day) was analyzed and was shown in table no: 5. Intra-day precision was determined by analyzing Capecitabine for three times in the same day at 303 nm. Inter-day precision was determined by analyzing the drug daily once for three days at 303 nm.
LINEARITY
against solvent (phosphate buffer pH 7.4) blank and the absorbance values were shown in. The obtained absorbance values are plotted against the concentration of Capecitabine to get the calibration graph and were represented as the concentration of the unknown sample was determined from the calibration graph. The regression equation and correlation coefficient were determined and are given in.
LIMIT OF DETECTION (LOD)
Limit of detection is determined by the analysis of samples with known concentrations of analyte and by establishing the minimum level at which the analyte can be reliably detected. It is calculated from the formula,
LOD = 3.3 σ / S
LIMIT OF QUANTITATION (LOQ)
Based on the LOD strength, the LOQ values were calculated by multiplication with three times. The quantitation limit (QL) is calculated from,
LOQ = 10 σ / S
LIMIT OF DETECTION
LIMIT OF QUANTIFICATION
The parameter LOQ was determined on the basis of response and slope of regression equation
RESULTS
An effort has been made to develop a simple, accurate method to estimate Capecitabine in bulk and pharmaceutical preparation and to validate the method, according to ICH Q2 (R1) guidelines.
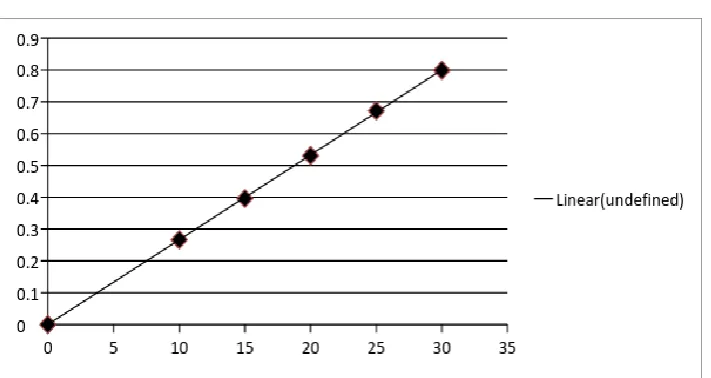
The absorbance maxima was recorded at wavelength of 303 nm which is shown in Fig: 2. Beers law range was confirmed by linear curve of Capecitabine, shown in Fig: 3. Linearity for Capecitabine is shown at concentration range of 10 -30 μg / ml.
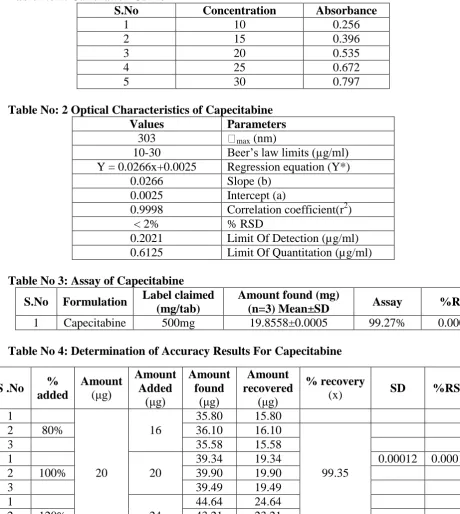
The accuracy was confirmed by recovery studies by adding known amount of pure drug to the previously analyzed formulation and the mixture was analyzed by the proposed method was found to be 99.27%. The values are given in recovery was confirmed and shown in the table: 4. the parameter LOD and LOQ was found to be 0.20215µg/ml 0.61259µg/ml.
[image:5.595.122.478.535.724.2]Figure1: Chemical structure of Capecitabine
Figure 2: λ –max of Capecitabine
Table No 1: Calibration Curve Absorbance Concentration S.No 0.256 10 1 0.396 15 2 0.535 20 3 0.672 25 4 0.797 30 5
Table No: 2 Optical Characteristics of Capecitabine Parameters Values
max (nm)
303
Beer’s law limits (µg/ml) 10-30
Regression equation (Y*) Y = 0.0266x+0.0025
Slope (b) 0.0266
Intercept (a) 0.0025
Correlation coefficient(r2) 0.9998
% RSD < 2%
Limit Of Detection (µg/ml) 0.2021
Limit Of Quantitation (µg/ml) 0.6125
Table No 3: Assay of Capecitabine
S.No Formulation Label claimed
(mg/tab)
Amount found (mg)
(n=3) Mean±SD Assay %RSD
1 Capecitabine 500mg 19.8558±0.0005 99.27% 0.00005
[image:6.595.64.525.83.598.2]Table No 4: Determination of Accuracy Results For Capecitabine
Table No 5: Intraday Precision Results Capecitabine
S .No %
added Amount (μg) Amount Added (μg) Amount found (μg) Amount recovered (μg) % recovery
(x) SD %RSD
1
20
16
35.80 15.80 2 80% 36.10 16.10
99.35
3 35.58 15.58
1
20
39.34 19.34 0.00012 0.00012 2 100% 39.90 19.90
3 39.49 19.49
1
24
44.64 24.64 2 120% 43.21 23.21
3 45.01 25.01
S. No Concentration
(μg / ml)
Amt. found (μg / ml)
Percentage
(x) (%) Average SD %RSD
1. 20 20.16 100.84 2. 20 19.75 98.77
3. 20 20.31 101.59 99.30 0.0064 0.0064 4. 20 19.41 97.08
[image:6.595.61.542.450.712.2]Table No 6: Interday Precision Results Capecitabine
CONCLUSION
All the above parameters combined with simplicity and ease of operation ensure that the application of proposed method from UV Spectrophotometric method for estimation of Capecitabine was found to be useful with high accuracy, precision. It can be used for routine analysis of capecitabine in Api and pharmaceutical preparation.
REFERENCES
1. Jothieswari D. Development and validation of UV spectroscopic method for determination of capecitabine in bulk and formulation, IJMCA, 2014; 4(5): 279-283. 2. Dooley M, Goa KL. Capecitabine. Drugs, 1999; 58(1): 6976.
3. Medikondu Kishor et al. Spectrophotometric determination of Capecitabine in Pharmaceutical Formulations. International Journal of Chemical and Analytical Science, 2010; 1(10): 238-241.
4. Naveen kumar M et al. Validated UV spectrophotometric method for quantitative analysis of capecitabine in pharmaceutical dosage form. Journal of Chemical and Pharmaceutical
Sciences, 2013; 6(4): 231-233.
5. Kumbhar SC et al. UV - Spectrophotometric Method development for Capecitabine in Eudragit and Chitosan based Microspheres and its Validation. Indian J. Pharm. Biol. Res,
2013; 1(3).
6. Venkata Raju Y et al. Development of Validated Stability Indicating RP-HPLC Method for the estimation of Capecitabine in Pure and Pharmaceutical Formulations.
International Journal of Research in Pharmaceutical and Biomedical Sciences, 2011;
2(1).
7. Narendra Devanaboyina, Development and Validation of new RP-HPLC method for analysis of Capecitabine in pharmaceutical dosage form. IJSIT, 2013; 2(1).
8. http://www.drugbank.com 9. www.sciencedirect.com
S. No Concentration
(μg / ml)
Amt. found (μg / ml)
Percentage
(x) (%) Average SD %RSD
1. 20 19.90 101.25 2. 20 20.16 102.12
3. 20 20.39 100.87 99.56 0.00005 0.00005 4. 20 19.45 101.75