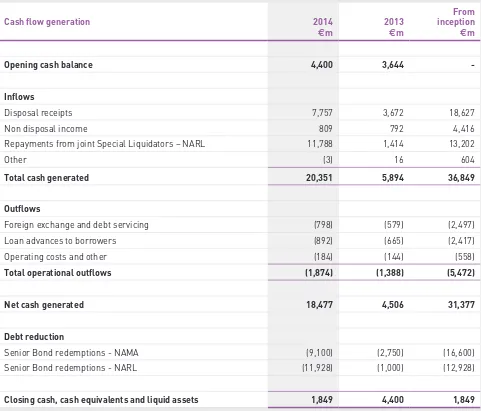
Annual Report & Financial Statements 2014
Full text
Figure


Related documents
Map of residential buildings spread throughout urban area of Prishtina, based on building typology (source: Author’s plot on the basis of statistical data from Urban development
Specifically, we use Demographic and Health Surveys (DHS) and Malaria Indicator Survey (MIS) data to test the hypothesis that modern, improved housing is associated with lower odds
The financial statements in this report present the financial condition, results of operations and cash flows of the Company, on a consolidated basis at March 31, 2013 and December
(BWF), which comprise the statements of financial position as of December 31, 2014 and 2013, and the related statements of activities, functional expense and cash flows for
A third possible question can be raised: if, say, the average pure country volatility is larger than the average pure sector variance, does this mean that diversification
The Condensed Consolidated Statutory Statements of Financial Position as of December 31, 2013 and the Condensed Consolidated Statutory Statements of Cash Flows for the year
Flow cytometry data were exported as standard FCS files and the forward and side scattered light (FSC and SSC) signals were analysed and plots generated using Matlab. Spencer
The hypothesized structure of consumer based brand equity consisting of brand awareness, perceived quality, brand loyalty and brand associations (decomposed into perceived


