A DEVELOPMENT AND VALIDATION OF AN RP-HPLC METHOD
FOR ESTIMATION OF FENOPROFEN IN BULK DRUG
Syed Rihana*, Dr. A. Suneetha, G. Sandhyarani, G. Sumanjali, G. Jyothi, G. Chaitanya
India.
ABSTRACT
Rapid and sensitive method was developed and validated for the
estimation of fenoprofen calcium in bulk drugs. Liquid-liquid
extraction with methanol and acetonitrile. The accuracy and
reproducibility of the method were within acceptable. Linearity ranges
from 10 to 80 microgram/ml .the run time of the sample is 10
minutes.selected wavelength of the drug is 270nm. Operating
temperature at 25degree celcius (ambient) by using column –enable
c18 (4.6×250mm, 5 micrometers). Limit of the developed rp-hplc method for the estimation
of fenoprofen, carried out on with enable c18 (250nm×4.6, 5µm) column. Methanol and
acetonitrile in the ratio (80:20v/v) used as mobile phase and flow rate 1.5 ml/min. The
detection was carried at 270nm and ambient column temperature was maintained.
KEYWORDS: linearity, accuracy, precision, limit of detection, limit of quantification.
INTRODUCTION
Pharmaceutical analysis is a specialized branch of analytical chemistry derives its principles
from various branches of sciences like physics, microbiology, nuclear science, and
electronics etc. Qualitative analysis is essential before a quantitative analysis can be
undertaken. An isolation step is usually a necessary part of both a qualitative and quantitative
analysis. The result of typical quantitative analysis can be computed from two measurements.
One is the mass or volume of sample to be analyzed and the second one is the measurement
of some quantity that is proportional to the amount of analytic that sample and normally
completes the analysis.[1]
Volume 8, Issue 2, 874-886. Research Article ISSN 2277– 7105
Article Received on 30 November 2018,
Revised on 21 Dec. 2018, Accepted on 11 Jan. 2019
DOI: 10.20959/wjpr20192-14043
*Corresponding Author
Syed Rihana
MATERIALS AND METHODS
The developed rp-hplc method for the estimation of fenoprofen, carried out on with enable
c18 (250nm×4.6, 5µm) column. Methanol and acetonitrile in the ratio (80:20v/v) used as
mobile phase and flow rate 1.5 ml/min. The detection was carried at 270nm and ambient
column temperature was maintained.
Materials
Table 4: Instrument used.
S. no. Name Model Manufacturer
1. Ph meter µph system 361 Systronics
2. Weighing balance Bl-220h Schimadzu
3. Ultrasonitor Ins-014 Systronics
4. Hplc Spd-m20a Schimadzu
Table 4: Reagents and chemicals.
S. no. Name Grade Manufacturer
1. Methanol Hplc Fisher scientific
2. Acetonitrile Hplc Merck
Optimized chromatographic condition
Instrument used : hplc (schimadzu)
Operating temperature : ambient
Column : enable c18 (4.6 x 250mm, 5m)
Mobile phase : methanol: acetonitrile (80:20)
Flow rate : 1.5ml/ min
Selected wavelength : 270 nm
Diluents : methanol
Injection volume : 20 l
Run time : 5 min.
Retention time : fenoprofen
Selection of wave length (for detection)
The choice of detection wave length was based on the scanned absorption spectrum for
fenoprofen. The uv-spectrum of fenoprofen was obtained by scanning the sample over the
wave length range 200-400 nm. After thorough examination, the wave length 270 nm was
Fig. 3: Spectrum of fenoprofen.
Selection of chromatographic method
The choice of chromatographic method is based on the nature of sample, its molecular weight
and solubility. The reverse phase chromatographic technique was selected for present work,
due to polar nature of the drug.
After the method development, the method is validated in terms of parameters like linearity,
precision, accuracy, robustness, lod and loq.
1. System suitability studies
System-suitability tests are a necessary part of method development and are used to ensure
adequate performance of the chromatographic system. Retention time (rt), number of
theoretical plates (n), tailing factor (t), and peak asymmetry (as), resolution (rs) were
calculated for five replicate injections of the drug. The system suitability test was performed
using five replicate injections of standards before analysis of samples.
Note
Tailing factor ---- not more than 2
Theoretical plates ---- not less than 2000
2. Linearity
From the stock solution of fenoprofen calcium take 1mg/ml, 2mg/ml, 3mg/ml, 4mg/ml,
5mg/ml, 6mg/ml, 7mg/ml, and 8mg/ml of stock solution in eight volumetric flasks with the
methanol to give the following concentrations.
Fenoprofen: 10µg/ml, 20µg/ml, 30µg/ml, 40µg/ml, 50µg/ml, 60µg/ml, 70µg/ml and
80µg/ml.
The calibration graph was plotted with mean peak area on the y-axis and concentration of
standard solution in the x-axis. The degree of linearity was estimated by calculating the
correlation coefficient, y- intercept and slope of the regression line.
3. Precision
A) The system precision of test method was performed by injecting six portions from a
standard solution on to the analytical column and the peak area data obtained then % rsd was
calculated.
B) the method precision of test method was done by performing assay on six replicate
determination of sample preparation at test concentration level (as per method of analysis)
and the relative standard deviation of assay results was obtained.
4. Accuracy
Accuracy of the method confirmed by performing recovery studies at 50%, 100%, and 150%
levels of sample concentration, in accordance with ich guidelines, by replicate analysis (n=3).
Standard drug solution was added to a pre analyzed sample solution and percentage drug
content was measured.
% recovery = [(ct –cu)/ ca] × 100.
Where ct is the total conc. Of the analyte found,
cu is the conc. Of the analyte present in formulation;
ca is the conc. Of the pure analyte added to the formulation.
Procedure
Injected the solutions of 50%, 100%, and 150% with spiked amount of standard
the individual recovery and mean recovery values.
5. Robustness
For determining the robustness of the developed method, experimental conditions were
purposely altered and evaluated. The method must be robust enough to endure such slight
changes and allow routine analysis of the sample. Robustness of method was carried out with
variation in flow rate, mobile phase composition and detection wavelength ( 2 nm).
6. Limit of detection and quantification
Detection and quantification limit were calculated by the method based on the standard
deviation () and slope of the calibration plot, using the formula
Limit of detection × 3.3 S
Limit of quantization × 10/ s
Where = the standard deviation of the response.
s = the slope of the calibration curve (of the analyte).
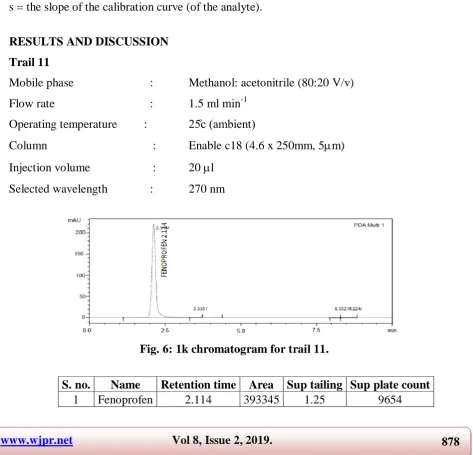
RESULTS AND DISCUSSION
Trail 11
Mobile phase : Methanol: acetonitrile (80:20 V/v)
Flow rate : 1.5 ml min-1
Operating temperature : m i nt
Column : Enable c18 (4.6 x 250mm, 5m)
Injection volume : 20 l
[image:5.595.63.537.355.810.2]Selected wavelength : 270 nm
Fig. 6: 1k chromatogram for trail 11.
S. no. Name Retention time Area Sup tailing Sup plate count
Observation: tailing is with in the limits.
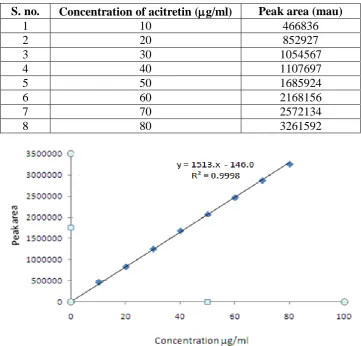
Linearity
Linearity was observed over the concentration range of 10-80µg/ml fenoprofen. Correlation
coefficient was found to be 0.999 for the drug which indicates that the concentration had.
Table 6.2: linearity data of fenoprofen.
S. no. Concentration of acitretin (g/ml) Peak area (mau)
1 10 466836
2 20 852927
3 30 1054567
4 40 1107697
5 50 1685924
6 60 2168156
7 70 2572134
[image:6.595.117.479.200.546.2]8 80 3261592
Fig. 6.11: Linearity plot for fenoprofen.
Table 6.3: Analytical performance parameters for fenoprofen.
Parameters Fenoprofen
Linearity (μg/ml) 10-80
Correlation coefficient 0.999
Intercept 1513.x-146.0
Acceptance criteria
Correlation coefficient (r²) should not be less than 0.999.
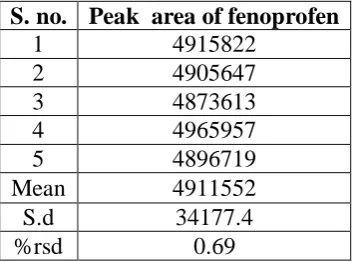
Precision
The %rsd values of the fenoprofen of system precision and method precision was found to be
0.69 and 0.5 respectively. As the results are within the acceptance limits of less than 2%,
[image:7.595.210.388.189.320.2]indicates that than the proposed method has good reproducibility.
Table 6.4: Results for system precision.
S. no. Peak area of fenoprofen
1 4915822
2 4905647
3 4873613
4 4965957
5 4896719
Mean 4911552
S.d 34177.4
%rsd 0.69
Table 6.5: Results for method precision.
S. no. Peak area of fenoprofen
1 383417
2 382430
3 391024
4 383249
5 391013
6 390413
Mean 386924
S.d 135443.7
%rsd 0.5
Acceptance criteria
% Rsd should not be nmt 2.
The % rsd for the results was below 1, which were within the limits and hence method is
precise.
Accuracy
The accuracy of the method was persistent by recovery experiments. The recovery studies
were carried out by correlating method of three individual standards with each of three
samples with same procedure from the formulation and injecting. Sample solution spiked
with standard at different concentrations (50%, 100% and 150%) was prepared and the %
Table 6.6: % recovery offenoprofen.
% level Amount added
(µg/ml)
Amount recovered
(µg/ml) % recovery Mean % recovery
50%
10 9.98 99.8
99.96%
10 9.99 99.9
10 10.02 100.2
100%
20 19.98 99.9
99.85%
20 19.88 99.4
20 20.05 100.25
150%
30 30.25 100.8
100.27%
30 30.05 100.1
30 29.98 99.93
Acceptance criteria
The % recovery for each level should be between 98.85 to 100.27%.
The results obtained for recovery at 50%, 100% and 150% are within the limits. Hence the
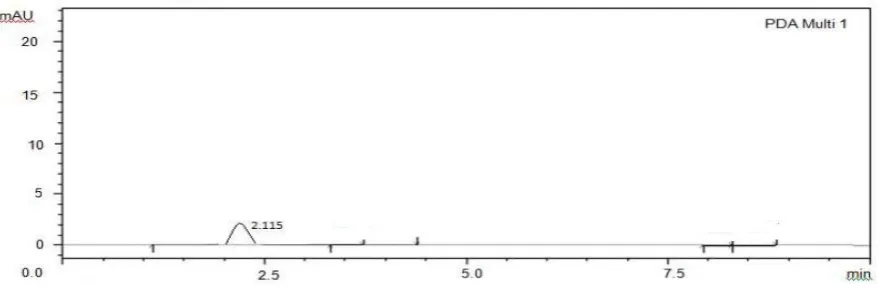
limit o f detectio n
The lowest concentration of the standard solution was prepared with respect to the base
line noise and measured the signal to noise ratio.
Fig. 6.34: Typical chromatogram for lod of fenoprofen.
Table 6.9: Results for lod.
Sample Lod
Fenoprofen 2.082
Acceptance criteria
[image:8.595.74.519.412.557.2]Limit of quantification
The lowest concentration of the standard solution was prepared with respect to the base line
[image:9.595.74.523.145.317.2] [image:9.595.78.522.579.742.2]noise and measured the signal to noise ratio.
Fig. 6.35: Typical chromatogram for loq of fenoprofen.
Table 6.10: results for loq.
Sample Loq
Fenoprofen 6.92
Acceptance criteria
Signal to noise ratio shall be 10 for lod solution. The result obtained was within the limit.
Limit of quantification
The lowest concentration of the standard solution was prepared with respect to the base line
noise and measured the signal to noise ratio.
Table 6.10: Results for loq.
Sample Loq
Fenoprofen 6.92
Acceptance criteria
Signal to noise ratio shall be 10 for lod solution. The result obtained was within the limit.
CONCLUSION
From the reported literature, there were few analytical method established for the
determination of fenoprofen by rp-hplc method. However, there are no methods were
reported for estimation of fenoprofen in pharmaceutical dosage forms.
The scope and objective of the present work is to develop and validate a simple rp- hplc
method for estimation offenoprofen in pharmaceutical dosage form.
In rp-hplc method development, modrobes hplc spd-m20a system with pda detector and
column used is enablec18 (250 x 4.6mm) column with 5-micron particle size. Injection
volume of 20 µl is injected and eluted with the mobile phase selected after optimization was
methanol and acetonitrile in the ratio of 80:20 v/v was found to be ideal. The flow rate was
found to be optimized at 1.5 ml/min. Detection was carried out at 270 nm. Quantization was
done by external standard method with the above mentioned optimized chromatographic
condition. This system produced symmetric peak shape, good resolution and reasonable
retention times of fenoprofen was found to be respectively.
The fenoprofen showed linearity in the range of 10-80 µg/mlrespectively.regression equation
of fenoprofen is y = 1513.x -146.0. The correlation coefficient value for fenoprofen 0.9998
respectively which indicates excellent correlation between response factors vs. concentration
of standard solutions.
Precision of the developed method was studied under system precision and method precision.
%rsd of the fenoprofen were and found to be 0.69 and 0.5 respectively. Hence the %rsd
values for precision were found to be within the acceptable limit, which revealed that the
developed method was precise. The developed method was found to be robust. %recovery
was obtained as 99.85% and 100.27% for fenoprofen respectively. The %rsd value for
obtained from regression equations of fenoprofen were 2.082, 6.92 respectively. The results
indicate satisfactory accuracy of method for estimation of the fenoprofen.
Hence, the chromatographic method developed for the fenoprofen said to be rapid, simple,
sensitive, precise, accurate and reliable that can be effectively applied for routine analysis in
research institutions, quality control department in industries, approved testing laboratories,
bio-pharmaceutics and bio-equivalence studies and in clinical pharmacokinetic studies.
ACKNOWLEDGEMENTS
Syed. rihana, dr.a.suneeta.
REFERENCES
1. Gurudeep chatwal and sham anand, instrumental methods of chemical analysis. Himalaya
publishers, 7th edition, 1992; 2.624-2.639.
2. Skoog et al., principles of instrumental analysis. Barkhanath publishers, 8th edition,
973-995.
3. Hobart.h.willard et al., instrumental methods of analysis, cbs publications and
distributors, New Delhi, 1st edition, 1986; 529-563.
4. Sethi p.d., quantitative analysis of drugs & pharmaceuticals. Cbs publishers and
distributors, New Delhi, 3rd edition, 2001; 1-120.
5. Janeyulu.y&marayyah, quality assurance & quality management in pharmaceutical
industry. Pharma book publishers, hyd, edition, and, 2005; 78-108.
6. Vog l’s t xt ook of qu ntit tiv h mi l n lysis. Pu lish d y dorling kind rsl y
pvt.ltd. 6th edition, 289-304.
7. Lloyd r. Snyd r t l., pr ti l hpl m thod d v lopm nt. John wil y & son’s
publishers, 2nd edition, 350-400.
8. Knevel a.m. &.digengl f.e, Jenkins quantitative pharmaceutical chemistry, mc graw hill
book co.
9. Daniel w.armstrong, bonded phase material for chromatographic separations, u.s.patent,
1985; 4539399.
10. Sastry, c.s.p., singh, n.r., reddy, methods of analysis, 1986; 316.
11. Baveja s.k. et al., 1987; 337-344.
12. Puthlis.p.vavia, p.r j.pharm. Biomed. Anal. 22, published in, 2000; 673-677.
14. Loyd .r Snyder, ET al.practical hplc method development, john wiley & sons publishers,
Inc, New York, 2nd edition, 686-706.
15. Www.science direct.com.
16. D.helmeste et al., j.chromatogr. Published in, 1997; 195-201.
17. Interna ich of technical requirements for the registration of pharmaceuticals for human
use, validation of analytical parameters; methodology adopted in, Geneva, 1996.
18. Ich guidelines q2b, validation of analytical procedure: definitions, published in March,
Geneva, Switzerland, 1996.
19. Singh Gn, gupta rp. Stability of pharmaceuticals. Dept. Of pharmaceutics, institute of
technology, b.h.u., Varanasi u.p. eastern pharmacist aug, 1987; 85-89.
20. Teresa i, Lucas, bishara rh, Robert hs. A stability program for the distribution of drug
products. Pharmaceutical technology resource guide, 2004; 86-9.
21. Gennaro ar. Remington: the science and practice of pharmacy. Philadelphia, 12thedn,
2000; 986-90.
22. Singh s, bakshi m. Development of validated stability-indicating assay methods critical
review. J pharm biomed anal, 2002; 28: 1011-40.
23. Ich harmonised tripartite guideline stability testing of new drug substances and products
q1a (r2), 2003; 2: 1-24.
24. M. Debackere et al developed a high performance liquid chromatographic method to
measure plasma and urine fenoprofen levels in equine biofluids is described. Liquid–
liquid extraction with diethylether was used to isolate the drug from plasma and urine.
25. Akimasashibukawa et al developed a performance frontal analysis (hpfa) and
high-perfon-ance liquid chromatography (hplc) were incorporated in an on-line coupled
column system for the enantioselective determination of unbound fenoprofen (fp)
concentrations in the state of a protein binding equilibrium following direct sample
injection.
26. Yi-fen pai et al developed a wall-coated histidine capillary column was developed for the
on-line preconcentration of nonsteroidal anti-inflammatory drugs (nsaids) in capillary
electrochromatography (cec).
27. T et al developed the kinetics of fenoprofen release from poly[α,β-(n
-2-hydroxyethyl-dl-aspartamide)]-fenoprofen conjugate (phea-fen) in aqueous buffer solutions (ph 10 and
28. deiaabd el-hadyet aldeveloprd a new biosensor or protein label-free sensor composed of
1-butyl-3-methylimidazolium hexafluorophosphates (bmimpf6)-human serum albumin
(hsa) film on glassy carbon electrode (gce) was produced.
29. Alan rubin et al said because orally administered dl-2-(3-phenoxyphenyl)-propionic acid,
fenoprofen, may be useful for maintenance anti-inflammatory/analgesic therapy in man;
evaluations were begun of certain pharmacokinetic parameters related to the absorption