LEABHARLANN CHOLAISTE NA TRIONOIDE, BAILE ATHA CLIATH TRINITY COLLEGE LIBRARY DUBLIN
OUscoil Atha Cliath
The University of Dublin
Terms and Conditions of Use of Digitised Theses from Trinity College Library Dublin
Copyright statement
All material supplied by Trinity College Library is protected by copyright (under the Copyright and
Related Rights Act, 2000 as amended) and other relevant Intellectual Property Rights. By accessing
and using a Digitised Thesis from Trinity College Library you acknowledge that all Intellectual Property
Rights in any Works supplied are the sole and exclusive property of the copyright and/or other I PR
holder. Specific copyright holders may not be explicitly identified. Use of materials from other sources
within a thesis should not be construed as a claim over them.
A non-exclusive, non-transferable licence is hereby granted to those using or reproducing, in whole or in
part, the material for valid purposes, providing the copyright owners are acknowledged using the normal
conventions. Where specific permission to use material is required, this is identified and such
permission must be sought from the copyright holder or agency cited.
Liability statement
By using a Digitised Thesis, I accept that Trinity College Dublin bears no legal responsibility for the
accuracy, legality or comprehensiveness of materials contained within the thesis, and that Trinity
College Dublin accepts no liability for indirect, consequential, or incidental, damages or losses arising
from use of the thesis for whatever reason. Information located in a thesis may be subject to specific
use constraints, details of which may not be explicitly described. It is the responsibility of potential and
actual users to be aware of such constraints and to abide by them. By making use of material from a
digitised thesis, you accept these copyright and disclaimer provisions. Where it is brought to the
attention of Trinity College Library that there may be a breach of copyright or other restraint, it is the
policy to withdraw or take down access to a thesis while the issue is being resolved.
Access Agreement
By using a Digitised Thesis from Trinity College Library you are bound by the following Terms &
Conditions. Please read them carefully.
A Risk Probability Estimation Method for
Security Assessment in Global Computing
TRINITY C O L L E G E
ti S
llG S
^
LIBRARY D U B L IN
^
A thesis subm itted to
the U niversity o f Dublin, Trinity college,
in fulfillm ent o f the requirem ents for the degree o f
D octor o f Philosophy (Com puter Science)
2008
Declaration
Permission to Lend or Copy
Acknowledgements
This has been quite a journey for me, but I never would have m ade it w ithout the
support o f those that believed that I could finish.
This is for Dr. C hristian Dam sgaard Jensen, who provides all his guidance and
patience throughout my academ ic endeavors. This w ork could never have been done
w ithout him.
i also w ant to thank the Prof. Vinny Cahill. There is little doubt that w ithout Vinny
support this thesis w ould not exist.
1 w ould like to express my gratitude to all the m em bers o f DSG, particularly
Jean-M arc Seigneur and Elizabeth Gray, for their unqualified support and expert
know ledge about security.
My appreciation also to the colleagues o f IDIRO Technologies, especially Daniel
Birke, John Loughrey, M ichael M annion and Liam Connolly.
My parents, Q iuying Chen and Daoyuan Liu, have been incredibly supportive
throughout my life. 1 ca n ’t say how much I owe them.
Finally, I would like to thank my wife Lei Xue. She aKvays believed that I could do a
Abstract
Global C om puting is a massively netw orked infrastructure supporting a large
population o f diverse but cooperating entities. The com position and characteristics o f
this infrastructure will be both dynam ic and unpredictable. An entity in this
heterogeneous, unreliable context is required to be capable o f dealing w ith unexpected
interactions and previously unknown entities. The properties o f the global com puting
infrastructure introduce new security challenges that are not adequately addressed by
existing security m odels and m echanism s. Hum an society has developed the
m echanism o f trust to overcom e initial suspicion and gradually evolve privileges.
Fundam entally, it is the ability to reason about trust that allows entities to accept risk
when they are interacting with other entities.
A key requirem ent o f security assessm ent in global com puting is to characterize the
extent to w hich risks are associated with the privileges that may be assigned to an
unknown entity, so that the level o f trust in an entity can be used to establish its level
o f privilege. It has long been recognized that an elem ent o f risk is part o f the context
o f trust; if trust is to becom e a basis for access control decisions then trust, risk and
privilege m ust be associated w ithin a com putational m odel. Particularly, risk
probability estim ation as a fundam ental quantitative analysis is playing an im portant
role in risk assessm ent in global com puting.
Risk probability estim ation is dififlcult in the global com puting environm ent. First, the
datasets containing inform ation about heterogeneous context and entities in global
com puting vary a lot. A t the sam e tim e, the size o f the datasets m ight be very small at
the initial stage as som e entities have little prior inform ation and could becom e very big
with entities accum ulating more experience. This requires that the m ethod is
independent o f the data configuration and self-adaptive. Second, the entity in global
com puting could be a com puter, a PDA, a m obile phone o r even an intelligent sensor.
The com puting capabilities are different w hile a pow erful central server is absent. All
interval. This requires the risk probability estim ation m ethod to be fast enough. Third,
the risk probability estim ation m ethod should provide an accurate prediction and
benefit the security assessm ent in global com puting. T herefore though risk probability
estim ation is not a new problem for both academ ic and industrial research, m ost o f the
existing estim ation m ethods are not suitable in global com puting.
This thesis proposes a new risk probability estim ation m ethod for security assessm ent
in global com puting from a global view that is quite general, adaptive and therefore
independent o f the data configuration. The new algorithm com plies com pletely with
the requirem ents identified in this thesis for estim ating risk probabilities. In the
evaluation experim ents, it proves to be very pow erful in processing various datasets;
fast enough to respond to requests and estim ating risk probability precisely to support
Related Publications
“Risk Probability Estim ating Based on Clustering” , Y. Chen, C. D. Jensen, E. Gray and J.-M.
Seigneur, in Proceedings o f the 4th Annual IEEE Information Assurance Workshop, United States
Military Academy (West Point, NY, USA, June 2003), IEEE Press, 2003.
“Initial Investigation into Cross-Context Trust and Risk Assessm ent”, E. Gray, Y Chen and C. D.
Jensen, in Proceedings o f the lASTED International Conference on Com m unication, N etwork, and
Information Security, 2003, in New York
“Trust Propagation in Small Worlds", E. Gray, J.-M. Seigneur, Y. Chen, and C. D. Jensen, in
Proceedings o f the First International Conference on Trust M anagem ent, LNCS 2692,
Springer-Verlag, 2003
“Towards Security Auto-Configuration for Smart Appliances", J.-M. Seigneur, C. D. Jensen, S.
Farrell, E. Gray, and Y Chen, in Proceedings o f the Smart Objects Conference, Grenoble, France,
2003
“End-to-end Trust Starts with Recognition", J.-M. Seigneur, S. Farrell, C. D. Jensen, E. Gray, and
Y. Chen, in Proceedings o f the First International Conference on Security in Pervasive Computing,
Boppard, Germany, LNCS 2802, Springer-Verlag, 2003.
"U sing Trust for Secure Collaboration in Uncertain Environments", V. Cahill, et al., in Pervasive
Contents
1 Introduction...1
1.1 Introduction... 1
1.2 Thesis C ontributions... 3
1.3 Thesis Structure... 4
2 B ackground... 6
2.1 Introduction... 6
2.2 Term inology... 7
2.3 Security A ssessm ent...8
2.4 Risk A ssessm ent...13
2.5 SECURE Fram ew ork... 18
2.6 Risk Probability E stim ation... 22
2.7 Sum m ary... 27
3 Existing Risk Probability Estim ation M ethods... 28
3.1 Introduction... 28
3.2 Param etric Estim ation M ethods... 29
3.3 Non- Param etric Estim ation M ethods... 39
3.4 S um m ary... 54
4 Design o f the G eneral Risk Probability Estim ation... 56
4.1 Introduction... 56
4.2 The N ature o f Risk Probability...56
4.3 Risk probability calculation... 63
4.4 Param eter to confirm ... 64
4.5 Case Studies... 69
4.6 S um m ary...73
5 Evaluation M ethodology... 74
5.1 Introduction... 74
5.2 Evaluation Criteria and M etrics... 74
5.3 S um m ary...77
6. Applying Risk Probability Estim ation in P2P Community... 78
6.1 Introduction... 78
6.2 Experim ents Design and Related Parameters...79
6.3 Dataset D escription and Preprocessing... 82
6.4 Experim ent Im plementation and Result Analysis... 87
6.5 S um m ary...93
7 Conclusion and Proposals for Future Research... 95
7.1 Introduction... 95
7.2 Review o f T hesis... 95
7.3 Summary o f Thesis Contributions... 96
7.4 Future W ork... 97
7.5 Summary o f C onclusions... 99
1
Introduction
This chapter w ill briefly introduce the concerns o f this w ork, present its key
contributions and outline the rem ainder o f the thesis.
1.1
Introduction
Inform ation system s have long been at risk from m alicious actions or inadvertent user
errors and from natural and m an-m ade disasters [Ahuja, 1996], [Hill, 1995], [James,
1989] and [Jon, 2001], In recent years, system s have becom e m ore susceptible to
these threats because com puters have becom e m ore interconnected and, thus, more
interdependent and accessible to a larger num ber o f individuals. M oreover, global
com m unications infrastructures, such as the Internet, m ean that com puters can be
accessed from anyw here w orldw ide, w hich m eans that global as well as local
attackers have to be considered. As our reliance on inform ation system s and global
com m unications infrastructures increases, the risks arising from m alicious or
accidental dam age to this infrastructure increase dram atically. C om puter and
com m unications security has therefore risen to the top o f the research agenda [Chris,
2004], [Debra, 2002] and [W illiam , 2001].
Construction o f secure inform ation and com m unication technologies is difficult,
because there are no absolutes with security. Protecting the confidentiality, integrity
and availability o f critical inform ation is not easy to achieve due to various
infrastructures and insufficient information. Especially, the global com puting
environm ent has changed from centralized stationary com puters to distributed and
m obile com puting in recent years. The characteristics o f a m assively netw orked
infrastructure in this environm ent will be dynam ic and unpredictable since this
infrastructure has to support a large population o f diverse but cooperating entities,
while the entities will be both autonom ous and m obile.
a system is the purpose o f security assessments in which assessing risic is one key
element o f a set o f security assessment activities. This provides the basis for
establishing appropriate security policies and selecting cost-effective techniques to
enforce these policies [Thomas, 2001].
While there are a few information security assessment standards, methodologies and
frameworks that talk about what areas o f security must be considered [Finne, 1998],
[Kazman, 2000], [Meadows, 2000], [NCSC, 1985], [Stonebumer, 2001], [Stoneburner,
2001a] and [Yoon, 1995], they do not contain specifics on
H O W
security measures
should be assessed precisely. The reason behind this is that qualitative measurements
often are provided while quantitative analysis remains few and estimating risk
probability estimation is one o f unavoidable difficulties. Qualitative risk assessment
processes do not provide sufficient information to make fine grained decisions, and,
while quantitative processes offer the ability to make finer grained decisions, the
quantitative results are based on highly subjective estimates o f the risk environment.
Besides the above challenges, in the potential dynamic environments o f global
computing, by lack o f information or due to uncertainty, there is a probability that
previously unknown computing third-parties in foreign places are malicious. Users
would be overloaded by making decisions every time the context changes. The
usability requirement implies that most decisions will have to be made by the
computing entities themselves, probably autonomously.
Generally, the entities and context o f an interaction in global computing can be
abstracted as a point (or a feature vector) in n-dimensional space. If the interaction is
as expected, the response o f the point is set to 0. Otherwise, the response o f the point
is set to 1. Essentially, risk probability estimation is to examine how the probability o f
the response o f a new point to be 1 based on the distribution o f historical points with
known responses. In a global computing environment, since context and entities from
heterogeneous contexts can be very different, the risk probability estimation method
has to be adaptive to the data distribution. The central server is absent in this
environment and the computing capability o f entities could be small. This requires
that the estimation method be fast enough. At the same time, the risk probability
estimation method should provide an accurate prediction and should benefit the
security assessment in global computing.
This thesis examines the problem o f risk probability estimation in security assessment
in a global computing environment, which is one o f the most important quantitative
security analysis techniques. Som e o f the existing m odels often becom e a poor
predictor w hen their assum ptions cannot be met. Some are not precise in estim ating
the risk probability since they limit them selves to a local inside o f point distribution.
This thesis presents a new risk probability estim ation m ethod from a risk relativity
m easurem ent. This m easurem ent can not only m easure how m any points there are in a
neighborhood as w ell as how close these points are to each other within the
neighborhood, but it can also consider the influence o f the distribution o f sam ple
points both inside and outside o f the neighborhood. A w eighted probability is
constructed and M inim um R elative Inform ation Principle is introduced to confirm
param eters in the relative m easurem ent. Although concrete global com puting
environm ents do not exist yet, sim ulated experim ents are provided to evaluate how
the m ethod benefits the security assessm ent in global com puting.
1.2
Thesis Contributions
This thesis offers three two m ajor contributions to the state-of-the-art in risk
probability estim ation. Firstly, the thesis explores the nature o f risk probability and
presents design requirem ents for estim ating risk probability in global com puting.
These requirem ents include;
•
The m ethod m ust be adaptive to the data distribution.
•
The m ethod m ust be fast enough.
•
M ethod m ust be precise and benefit the security assessm ent in global
com puting.
To achieve precision o f estim ation, this m ethod m easures:
•
H ow m any points there are in a neighborhood
•
H ow close they are to each other w ithin a neighborhood
•
The influence o f points distribution both w ithin and outside o f the
neighborhood
•
The relativity o f different types o f points according the above three
requirem ents.
A third m ajor contribution o f this thesis is the im plem entation o f the proposed m ethod
in a research prototype, which has allowed us to subject it to em pirical evaluation in
the context o f a peer-to-peer com m unity.
1.3
Thesis Structure
C hapter 2 opens this thesis with an introduction o f the field o f inform ation technology
security assessm ent in global com puting. Before discussing the m ajor techniques
currently being used to assess the security and risk in a system , som e key term s w hich
are com m on used are defined and clarified. This is helpful to reduce am biguity
regarding the definitions o f this discipline. Then, it discusses security in general, in
order to give an introduction to the subject for those who are not fam iliar with it and
also to serve as a basis for the discussions in the rem ainder o f the chapter. As a way to
increase the system security, the m ajor security assessm ent and risk assessm ent
techniques are exam ined afterw ards. The SECU RE fram ew ork is introduced w hich is
the background project o f this thesis. Risk probability estim ation, as an unavoidable
issue for quantitative risk analysis, is touched upon and the m athem atic form ulas with
som e assum ptions are discussed.
C hapter 3 review s the current state o f the art in risk probability estim ation. As the
typical param etric estim ation m ethods, param etric probability density functions and
logistic regression both assum e a predefined relationship existing betw een the feature
vector and its response. Unlike those param etric estim ation m ethods, k-nearest
neighbor m ethod (K N N ) and Parzen W indow m ethod explore the point distribution in
a certain neighborhood w ithout these param etric assum ptions. Probabilistic neural
networks based on the Parzen w indow s with constant w indow w idth and m ultivariate
additive regression splines originally designed respectively for classification and
regression as well as being used for risk probability estim ation are discussed. A
sum mary table to com pare existing approaches to estim ate the risk probability is
presented at the end.
C hapter 4 presents the m ajor theoretical contributions o f this thesis. The chapter
presents the m ain principles o f designing risk probability estim ations. It also clarifies
that a good classifier is not necessary a good risk probability estim ator. A general
method based on those principles is described in detail. This includes a new relativity
m easurem ent and its param eters confirm ation from a global view.
C hapter 5 discusses evaluation criteria and metrics. It is not easy to evaluate degree o f
correspondence betw een the estim ated risk probabilities o f a m odel and the actual
underlying distribution though it is a very im portant com ponent in the whole
estim ation procedure.
C hapter 6 describes the em pirical evaluation o f the proposed m ethod and analyzes its
result. A peer-to-peer com m unity is selected as the context o f the experim ent. The
dataset is from raw TC P dum p data o f an intrusion detection program . Each
connection is labelled as either norm al, or as an attack, w ith exactly one specific
attack type. The aim o f the experim ent is to see how the risk probability estim ation
m ethod could benefit the security assessm ent in global com puting. The perform ance
o f applying the m ethod proposed in the experim ent is analyzed and com pared with the
results by using KNN and logistic regression.
2
Background
2.1
Introduction
There has been a trem endous increase in inform ation security research from both
academ ia and industry since too m uch dam age has been caused by attacks and viruses
[Andrew,
1992],
[A nderson, 2001]
and
[M alphrus, 2000],
Protecting the
confidentiality, integrity and availability o f critical data and netw orks is difficult to
achieve due to a variety o f infrastructures and insufficient inform ation. Especially in
recent years, the com puting environm ent has changed from centralized stationary
com puters to distributed and m obile com puting. This evolution has profound
im plications for security models, policies and m echanism s in an increasingly globally
interconnected com puting infrastructure. Traditionally, identity-based security
m echanism cannot authorize an operation or resource w ithout authenticating the
claim ing entity. This m eans that no interaction can take place unless both parties are
known to each other. Furtherm ore in a global com puting environm ent, m obile users
need the ability to autonom ously authenticate and authorize other parties that they
encounter on their way, without relying on a com m on authentication infrastructure.
Therefore, an effective m ethod to evaluate the impact o f vulnerabilities and threats on
the distributed, heterogeneous network infrastructure is needed.
2.2
T erm in o lo g y
To help reduce am biguity regarding the definitions o f this discipline, a few key terms
should be defined. M oreover, we clarify som e term s that we believe are often
m isunderstood and abused.
R isk: John A dam s provides a detailed analysis o f the risk term in [Ada, 1995],
draw ing upon all definitions and usages o f the word. He defines risk as the follows;
Risk is the probability o f an adverse event in a stated time period. This is the
definition o f common parlance.
He also states that social scientists see risk as being an inherently subjective quantity
— people see the w orld differently and react differently, so it is hard to m easure
objective risk because behavior is m odified in response to perceived risk. A classic
exam ple is when roads that are felt to be highly dangerous by local residents have
statistically few er accidents because people are m ore vigilant. H ow ever, in a
com putational decision-m aking fram ework, this distinction o f perceived and objective
risk is irrelevant. I f risk can be perceived then, in a com putational w orld, it m ust be
quantifiable. W ithin the insurance industry, risk is defined as being the potential
variation from the expected outcom e, which can be m easured using standard deviation
o f the outcom e distribution [AB, 2000].
W ithin the safety-critical program m ing industry, the follow ing definition o f risk
seems to be w idely, although not universally, accepted [Lev, 1995]:
A hazard is defined as a state that together with other conditions in the environm ent
w ill lead inevitably to an accident. It has tw o com ponents:
1. Severity (the w orst possible accident that could result from the hazard given
the environm ent in its unfavorable state);
2. Likelihood o f occurrence
The risk o f an event is the probability o f som e com bination o f hazard states occurring
concurrently. Risk is the hazard com bined with:
1. The likelihood that the hazard will lead to an adverse event;
2. H azard exposure or duration (latency).
This thesis w ill adopt this definition and focus on the form er one, i.e., risk probability.
R isk A ssessm en t is the ongoing process o f assessing the risk to inform ation resources
or system s, as part o f a risk-based approach used to determ ine adequate security for a
system by analyzing the threats and vulnerabiUties.
S e c u rity A ssessm en t is an identification o f critical assets, an understanding o f the
internal and external threats and vulnerabilities and an evaluation o f policy and
control effectiveness. Risk A ssessm ent is a part o f security assessm ent.
R isk vs. U n c e rta in ty
M uch has been m ade o f Frank H. K night’s fam ous distinction betw een “risk” and
“uncertainty” [Knight, 1921]. In K night’s interpretation, “risk” refers to situations
where the decision-m aker can assign m athem atical probabilities to the random ness
which he is faced with. In contrast, Knight's “uncertainty” refers to situations when
this random ness “cannot” be expressed in terms o f specific m athem atical probabilities.
E stim a tin g vs. M e a su rin g
Dr. David A. Hillson and Dr. David T. H ulett in their paper provided a good
explanation [David, 2004]: “Risks are possible future events that have not yet
occurred, and as such their probability o f occurrence cannot be m easured but can only
be estim ated. In a philosophical sense it can even be said that the risk does not have a
real existence in the present, but it only exists in the future. It is therefore not possible
to m easure any characteristic o f a risk since it is not present in reality. It is only
possible to estim ate w hat the risk m ight be like if and when it should arise.”
2.3
S e c u rity A ssessm en t
W orld W ar II brought about much advancem ent in inform ation security and m ark the
beginning o f the professional field o f information security. In that period,
advancem ents are saw in the physical protection o f inform ation with barricades and
armed guards controlling access into inform ation centers. The introduction o f
form alized classification o f data is also introduced based upon the sensitivity o f the
information and identification o f those who could have access to the information.
B ackground checks w ere also conducted before granting clearance to classified
information.
At the end o f the 20th century and early years o f the 21st century, the rapid growth
and w idespread use o f electronic data processing and electronic business conducted
through the Internet, along with num erous occurrences o f international terrorism ,
fueled the need for better m ethods o f protecting the com puters and the inform ation
they store, process and transm it. The academ ic disciplines o f com puter security,
information security and inform ation assurance em erged along w ith num erous
professional organizations - all sharing the com m on goals o f insuring the security and
reliability o f inform ation system: In 1990, Thom as Lane(Lane 1990) developed a
fram ew ork for classifying user interface design know ledge so that softw are designers
could m ake good structural choices based on the user’s fiinctional requirem ents.
Kontio (K ontio 1996) first proposed using a w ell-know n decision analysis technique
called A nalytic H ierarchy Process(Saaty 1990) to help softw are engineers make
system atic decisions about selecting com m ercial-off-the-shelf (C O TS) products. The
ISO/IEC 27002:2005 Code o f practice for inform ation security m anagem ent was
presented in 2005 as a very im portant inform ation security standard for security
assessment. There has been an increasing interest in inform ation security over the last
few years. The reason behind this research interest is that num erous published reports
indicate that autom ated operations and electronic data are inadequately protected
against risks from m alicious actions or inadvertent user errors and from natural and
m an-m ade disasters. Today, systems have becom e more susceptible to these threats
because com puters have becom e more interconnected and, thus, m ore interdependent
and accessible to a larger num ber o f individuals. Inform ation security is often
conceptualized as being the protection or preservation o f four key aspects o f
information: availability, integrity, authenticity, and confidentiality.
•
A vailability: A ccessibility o f inform ation for a purpose
•
Integrity: C om pleteness, wholeness, and readability o f inform ation, and the
quality o f being unchanged from a baseline state
•
A uthenticity: V alidity, conform ance, and genuineness o f inform ation
•
C onfidentiality: Lim ited observation and disclosure o f know ledge to only
authorized individuals
Security assessm ent exam ines the level o f trust that a system or a product (e.g.,
operating system , firew all, database, web server, and telecom sw itch) conform s to its
functional security specifications and does not perform unintended functions that
com prom ise its security according the above four aspects o f inform ation security.
Since current system s are extrem ely com plex, distributed and often not under unitary
control; in order to effectively protect the system, security m ust be assessed from
m uhiple view points for the best overall picture. An effective security assessm ent
enables autom ated inform ation system decision m akers and adm inistrators to
understand how m uch security is needed and why, w hat security currently exists and
how effective it is and what degree o f confidence they can rightly place in that
knowledge. Therefore the steps include an identification o f critical assets, an
understanding o f the internal and external threats and vulnerabilities, and a prioritized
set o f cost-effective risk-m itigation measures.
M ost assessm ent m ethods can be divided into tw o categories: quantitative and
qualitative. The form er has an em phasis on num erical calculations and depends on
historical data, w hile the latter relies more on “best guess” ratings.
Q ualitative risk assessm ent m ethods often assess the likelihood o f an attack and its
subsequent im pact in general term s— high, medium , or low— rather than estim ate
specific probabilities to these events. Despite a b rief m apping o f qualitative ratings to
quantitative values, for instance in the N ational Institute o f Standards and
T echnology’s (N IST ) risk m anagem ent guide qualitative m ethod, probabilities ( 0 - 1 )
are assigned to the high-m edium -low rankings. Im pacts o f an attack are classified
from 0 to 100 to determ ine a threat-vulnerability risk level. The result o f the N IST
m ethod is a qualitative assessm ent o f high, m edium , or low risk for each asset
[Stoneburner, 2001].
In contrast to qualitative risk assessing methods, quantitative m ethods attem pt to
make precise security decisions based on a series o f “best estim ates” (e.g., estim ated
probability and expected dam age). They measure the uncertainty about the probability
o f attack and the uncertainty about the consequences o f the attaci< as objective as
possible based on effect factors within the context overall.
The main advantage o f a qualitative analysis is that it prioritizes the risks and
identifies areas for im m ediate im provem ent in addressing the vulnerabilities and
threats. The disadvantage o f qualitative analysis is that it does not provide specific
quantifiable m easurem ents o f the m agnitude o f the effects, therefore m aking a cost-
effective analysis o f any recom m ended controls difficult.
The m ajor advantage o f a quantitative analysis is that it provides a m easurem ent o f
the effect m agnitude, which can be used in the cost-effective analysis o f
recom m ended controls. The disadvantage is that the lack o f reliable data often
precludes precise determ inations o f which inform ation security risks are the most
significant and com parisons o f which controls are the m ost cost-effective.
Furtherm ore, the m eaning o f quantitative analysis may be unclear. Because o f these
lim itations, a com bination o f quantitative and qualitative m easurem ents and estim ates
are often used to assess security.
The assessm ent m ethods can also be categorized into tw o types from decision result
view: probabilistic m ethods and determ inistic methods. D eterm inistic m ethods use a
com bination o f algorithm s and business rules to determ ine if the threats are real
attacks. In a system using determ inistic methods, for exam ple, one rule m ight instruct
the system to match two records with different nam es if the login in nam e and
passw ord coincide. A lgorithm s catch sim ple com m on errors such as typos, phonetic
variations and transpositions. The result is an either/or outcom e: E ither records match
the requirem ents o f the business rule or they don't.
System s using determ inistic m ethods have a relatively lower degree o f accuracy
com pared to probability m atching. Such m ethods are best suited for applications
w here the inform ation is relatively small, there are few data attributes and there is no
great consequence o f error. For example, for the m ailing list processing, if the system
matches a nam e to an incorrect address, the m ailing would be sent to the w rong
person, resulting in the sending com pany w asting postage costs.
Probabilistic m ethods use likelihood ratio theory to assign com parison outcom es to
the correct or m ore likely decision. This m ethod leverages statistical theory and data
analysis and, thus, can establish m ore accurate links betw een system w ith more
com plex typographical errors and error patterns than determ inistic m ethods.
Typically, probabilistic m ethods assign a percentage indicating the probability o f how
a threat becom es a real attack. Because these system s pinpoint variation and nuances
to a much finer degree than a determ inistic approach, they are better suited for
businesses that have com plex data systems with m ultiple databases. Due to the size
o f these data system s, the change o f inform ation, the potential for duplicates, hum an
error, and discrepancies is far greater, m aking a system designed to determ ine links
between records with com plex error patterns m uch m ore effective.
Probabilistic m ethods adapt to the data to which they are being applied and do not
require m uch m anual tuning to im plement and maintain.
Shawn A. B utler proposes the Security Attribute Evaluation M ethod (SA EM ) as an
alternative to current cost-benefit analysis m ethods in her thesis [Shawn, 2003]. M ore
specifically, SAEM develops a quantitative risk assessm ent that security m anagers
can use to com pare and select security technologies. SAEM uses m ulti-attribute
decision analysis techniques from the field o f decision sciences to guide a security
m anager in his or her selection o f risk-m itigation controls for the organization’s
inform ation system security architecture.
SAEM consists o f four steps: 1) a risk assessm ent, 2) a securitj' technology benefit
analysis, 3) a coverage analysis, and 4) a security-technology trad e o ff analysis. Figure
2-1 shows how the steps are related.
System
Threats Design
Coverage Analysi-s ’riorit ze I
Thre 2. Benefit ' Anaiysfs
CounSCTrn sasui
Technology ■Tfadeoff Analysis
[image:22.545.22.538.24.677.2]Possible Countermeasures Outcofiies
Figure 2-1: SAEM Steps
Risk assessm ent is the first step o f the SAEM and relies on the additive m odel to
determ ine the relative ranking o f an organization’s threats. The risk assessm ent
consists o f six steps:
1. Determ ine the threats and initial risk ordering
2. D eteniiine the attack outcom e attributes
3. Elicit expected values
4. W eight the attributes
5. C om pute and rank threats
6. C onduct sensitivity analysis and refine
As the second step a security technology benefit analysis determ ines which security
technologies provide the greatest risk mitigation. Benefit analysis uses the results o f
the risk assessm ent and consists o f three sub steps:
1. Threat/security technology m itigation identification
2. Effectiveness elicitation
3. Effectiveness com putation
The coverage analysis step evaluates the security m anager’s overall m itigation o f
information system threats. Coverage analysis is dependent on the security
technologies identified during the first step o f benefit analysis.
Although the benefit analysis step determ ines which security technologies are the
m ost effective in m itigating threats, security m anagers m ust consider purchase cost,
m aintenance, skill level requirem ents, false positives, etc. before selecting a
technology for inclusion in the security architecture. In fact, the security m anager
often considers purchase cost or m aintenance to be m ore im portant than the
effectiveness o f the technology. The security trad eo ff analysis helps the security
m anagers to com pare security technologies using multi attribute analysis techniques
to rank each security technology according to the organization’s decision objectives.
2.4
Risk Assessment
A ssessing risk is one key elem ent o f a broader set o f security assessm ent activities
[IRM , 2002] and [Stoneburner, 2001]. O ther elem ents include evaluating policy and
control effectiveness. A lthough all elem ents o f the security assessm ent process are
important, risk assessm ent provides the foundation for other elem ents o f the cycle. In
particular, risk assessm ent provides a basis for establishing appropriate policies and
selecting cost-effective techniques to im plem ent these policies.
risks to ail the stakeholders and o f all the costs and all the benefits o f activities
associated with risk.
There are perhaps som e reasons for the increased em phasis on risk assessm ent. One is
the increasing pace o f change. B asing decisions on past experiences is becom ing
increasingly unreliable. D ecisions now need to take account o f a range o f possible
futures and to optim ize opportunities and m inim ize loss in an uncertain and changing
environm ent. The second reason that risk assessm ent has increased in prom inence is
the apparently increasing num ber o f malicious actions or inadvertent user errors from
natural and m an-m ade disasters that (retrospectively) could have been avoided or
better m anaged. A dm inistrators have to think about the risks o f their decisions and to
ensure that appropriate actions are taken to keep risks under control. Part o f this
apparent increase is due to im proved com m unication in the IT field, rather than an
actual increased frequency o f loss. However, disasters do also have an increased
im pact outside their im m ediate area because o f the com plexity o f m odern society. The
third reason is that the success o f risk assessm ent in insurance encourages researchers
in IT to seek for a sim ilar m echanism or transfer the policies to avoid or m itigate
losses resulting from poor decisions and poor control o f com puter associated risks by
an organization.
In practice, risk assessm ent m ethodologies have not yet fully com e to grips with how
to identify possible future scenarios. People still tend to fall back on using experience
to predict w hat m ight happen in the future. The m ajor challenge for risk assessm ent is
to find better w ays, either qualitative or quantitative, o f considering possible
outcom es so that decisions can take a com plete view o f the problem .
A ustralia and N ew Zealand have developed standards for m anaging risk which
involves a series o f logical steps, sim ilar to some o f the steps in the SAEM model.
However, these steps focus on risk m anagem ent and do not include the m ore general
security analysis elem ents o f the SAEM model. The logical steps are illustrated in the
diagram below [Felix, 1999] (see Figure 2-2).
•
Establish C ontext
•
Identify Risks
•
A nalyze Risks
•
Evaluate Risks
•
Treat Risks
•
M onitoring and Review
•
C om m unication and Consultation
TREAT RISKS ANALYSE RISKS IDENTIFY RISKS
EVALUATE RISKS ESTABLISH THE CONTEXT
[image:25.544.14.538.19.773.2]LU
tn w
w
cE
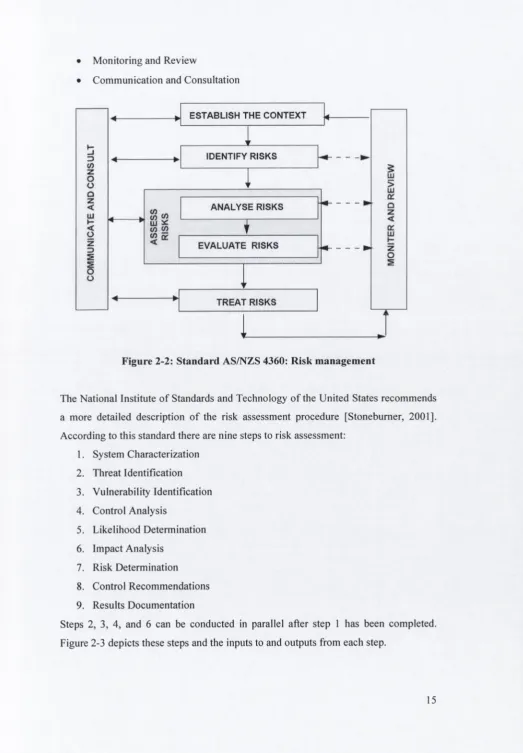
Figure 2-2: Standard AS/NZS 4360: R isk m anagem ent
The N ational Institute o f Standards and Technology o f the U nited States recom m ends
a m ore detailed description o f the risk assessm ent procedure [Stonebum er, 2001].
A ccording to this standard there are nine steps to risk assessm ent:
1.
System C haracterization
2.
Threat Identification
3.
V ulnerability Identification
4.
C ontrol Analysis
5.
Likelihood D eterm ination
6.
Im pact A nalysis
7.
Risk D eterm ination
8.
C ontrol R ecom m endations
9.
Results D ocum entation
Steps 2, 3, 4, and 6 can be conducted in parallel after step 1 has been com pleted.
In assessing risks for a system , the first step is to define the scope o f the effort. In this
step, the boundaries o f the system are identified, along with the resources and the
inform ation that constitute the system. C haracterizing a system establishes the scope
o f the risk assessm ent effort, delineates the operational authorization boundaries, and
provides inform ation essential to defining the risk.
The second step is looking for possible threats or hazards. The goal o f this step is to
identify the potential attacker and com pile a threat statem ent listing potential attackers
that are applicable to the system being evaluated. In assessing threat-sources, it is
important to consider all potential attackers that could cause harm to a system and its
processing environm ent.
The analysis o f threats to a system m ust include an analysis o f the vulnerabilities
associated with the system environm ent. The goal o f this third step is to develop a list
o f system vulnerabilities (flaw s or weaknesses) that could be exploited by potential
threat-sources.
The fourth step is control analysis which aims to analyze the controls that have been
im plem ented or are planned for im plementation by the organization to m inim ize or
elim inate the likelihood (or probability) o f a threat exploiting a system vulnerability.
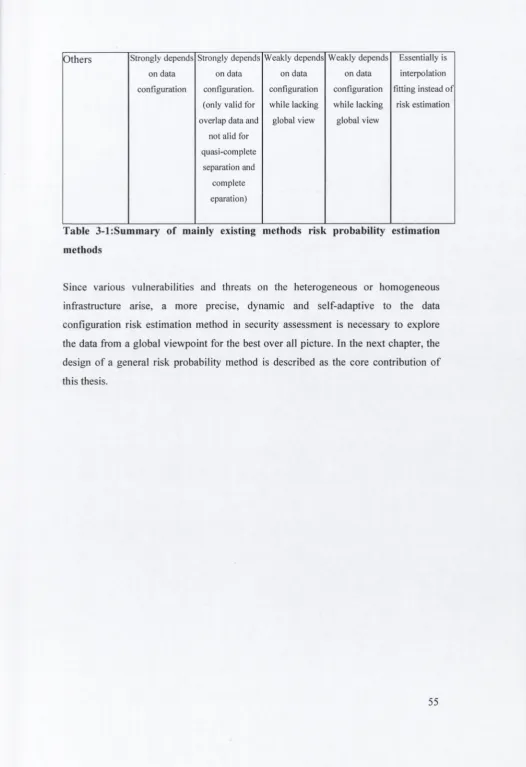
Input Risk Assessment Aclhities Hardwzra
Sofntrsre Sy’.tMU iK*rfK«> D«u and mfoncsdoc P«opid
Sywa; aassion
»HU^ory o f iyssem a ^ c k
' Ikts
af«3£i«L NIPC. OIG. ?«4CtRC, aasi lotdu.
■ Repons from piiox risk a£»«i&ineQts ' A s y iu d it commeati^ ' S«conry r«q;ureai«Ei5 • SeciriJy «st resulTi
I
I
• Mis&ion iopact * Assec cnfic&lityaisessoen^ * Dau cnticjtUty ♦ Dsu s«KSiti\i!y
* Loii of In:egnt>' * Lois of .AviUabilifr * Lo&{ of Coau^Uatuiity
Step 1.
System Characterization w
Step 2.
T h rriit Identification ► /
\
Step 3. Volnei'abilit;' Identification --- ► Output ' Svitem Bsraadan-* SyBsraadan-*»tSB3 F’ilSCtlODS* Svi^ aad
Ciih'csbty * Svitem end Dasa
Sensitivm-Thrtflt
Liii o f P0tfr!uu.l Vuhitrabit:tits
• current cwurols Step 4. Contro! Analysh L:*»t of Cttnea.t and
■ Pksaed coaffoJs 'W C o a lw h
k- -<
• Tlue*t-iouj« a»nv«oo • Threa: atpKiTV • XstuR of
Step 5.
f ” ^
L:k<liho>od lUting lik e lih o o d D etenaination
' C«n«n! coalaois
Step 6. Im pact A nah’^ii
* Lik«liho(xloftb:ett «xp)oitstioa ■ Magnirutld of impsci * .4^uacy of p^acn«d or
cunest coniroli
S te p ? . R iskD eteim m ation Asiocated Hisk Ruks aad Levels
Step 8. 9.ecoaunend«d
Conti'ol Recoininendntions Coctro':;
k
-Step 9. Results Documentation
[image:27.541.12.531.21.800.2]Risk Asiessnu^a; Report
Figure 2-3: Risk Assessment Work Flow (Adapted from (Stoneburner, 2001])
Control analysis involves an exam ination o f the inform ation such as threat-source
m otivation and capability, nature o f the vulnerability and existence and effectiveness
o f current controls, collected from the previous steps. The likelihood that a potential
vulnerability is exercised by a given attackers can be ranked as a real num ber between
0 and 1 or described as high, m edium , or low.
The next m ajor step in m easuring level o f risk is to determ ine the adverse impact
resulting from a successful exploitation o f the vulnerability. The adverse im pact o f a
security event can be described in term s o f loss or degradation o f any, or a
com bination o f any, o f the four security goals; integrity, availability, authenticity and
confidentiality.
Step 7 is risk determ ination which purpose is to assess the level o f risk to the system.
The determ ination o f risk for a particular threat/vulnerability pair can be expressed as
a function o f the likelihood o f a given attacker attem pting to exploit a given
vulnerability, the m agnitude o f the im pact should a threat-source successfully exploit
the vulnerability and the adequacy o f planned or existing security controls for
reducing or elim inating risk.
The aim o f step 8 (recom m ended controls) is to reduce the level o f risk to the system
and its data to an acceptable level. It should be noted that not all possible
recom m ended controls could be im plem ented to reduce loss. To determ ine which
ones are required and appropriate for a specific objective, a cost-benefit analysis
should be conducted for the proposed recom m ended controls.
Once the risk assessm ent has been com pleted (threat-sources and vulnerabilities
identified, risks assessed, and recom m ended controls provided), the results should be
docum ented in an official report or briefing. It is also recom m ended to review the
assessm ent and revise it periodically. This is the final step o f the risk assessm ent
process.
These are com m on steps for assessing risks o f a system. For a particularly system,
som e adjustm ent may need to be m ade to fit the specific task.
2.5
SECURE Framework
Though som e security m odels as above outlined have been proposed in recent years,
they do not fully m eet the requirem ents o f security assessm ent for global com puting.
Traditionally, those security m echanism s cannot authorize an operation without
authenticating the claim ing entity. This m eans that no interaction can take place
unless both parties are know n to each others’ authentication fram ew ork. Spontaneous
interactions would therefore require that a single or a few trusted C ertificate
Authorities (C A s) em erge, which, based on the inability o f a Public Key
Infrastructures (PK I) to em erge over the past decade, this seem s highly unlikely in the
foreseeable future. In the current environm ent, a user w ho w ishes to partake in
spontaneous collaboration with another party has the choice betw een enabling
security and thereby disabling spontaneous collaboration or disabling security and
thereby
enabling spontaneous collaboration.
The
state-of-the-art
is
clearly
unsatisfactory.
In global com puting environm ents, a m assively netw orked infrastructure has to
support a large population o f diverse but cooperating entities. The com position and
characteristics o f this infrastructure will be dynam ic and unpredictable: entities will
be both autonom ous and m obile, and will have to be capable o f dealing with
unforeseen circum stances ranging from unexpected interactions with other entities to
disconnected operation. In this potentially dynam ic environm ent, users w ould be
overloaded by m aking decisions every tim e the context changes. The usability
requirem ent im plies that m ost decisions will have to be m ade by the com puting
entities them selves, probably autonom ously.
This peer-to-peer type o f interaction in an uncertain world w here interactions are
needed to go forw ard resem bles w hat occurs in hum an social netw orks. The notion o f
trust has em erged in hum an society to allow hum ans to m ake decisions under such
circum stances.
T rust engines, based on com putational m odels o f the hum an notion o f trust, have been
proposed to m ake security decisions on beh alf o f their owner. For exam ple, this thesis
has been carried out as part o f the SECU RE project, w hich has built a generic and
reusable security fram ew ork based on a trust engine.
The EU-IST funded SECU RE (Secure Environm ents for C ollaboration am ong
Ubiquitous R oam ing Entities) project, was a three year research project (January 2002
- D ecem ber 2004) that aim ed to produce a novel approach to security to m eet the
challenges outlined above. Five institutions were involved in SECU RE: Trinity
C ollege D ublin, U niversity o f C am bridge, U niversity o f A arhus, U niversity o f
G eneva, and the U niversity o f Strathclyde. Trinity C ollege D ublin led the w ork on the
security fram ew ork, including the risk and access control aspects o f the project, and it
is in this area that this thesis m akes its contribution.
In this fram ew ork, each com puting entity would run a trust engine. These trust
engines allow the entities to com pute levels o f trust based on sources o f trust evidence,
that is, know ledge about the interacting entities: local observations o f interaction
outcom es or recom m endations. Based on the com puted trust value and given a trust
policy, the trust engine can decide to grant or deny access to a requesting entity. Then,
if access is given to an entity, the actions o f the granted entity are m onitored and the
outcom es, positive or negative, are used to refine the trust value.
Trust is an elusive concept with many com peting definitions found in the literature
[Josang 1996]. Intuitively, there is no reason to require trust unless there is som ething
at risk. It has long been recognized that the concepts o f trust and risk are closely
related, and the nature o f this relationship will need to be exam ined. A ccordingly, if
trust is to becom e the basis for access control decisions, then trust, risk, and privilege
must be associated within any com putational model. O nce an entity has established
trust and risk param eters for their situation, security policy w ill determ ine how they
proceed with any interaction. W hilst the goal o f access control is to restrict access to
resources and protect their integrity, global com puting will only succeed if new
relationships can be established and collaborations take place in environm ents where
an entity was previously unknown.
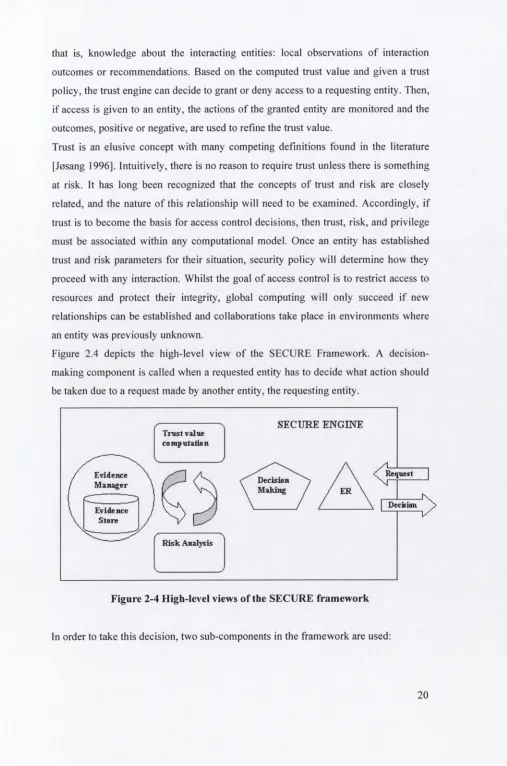
Figure 2.4 depicts the high-level view o f the SEC U R E Fram ew ork. A decision
m aking com ponent is called when a requested entity has to decide w hat action should
be taken due to a request made by another entity, the requesting entity.
SECURE ENGENfE
Trust valuecompulation
Requeit Evidence
Manager Decision
Making ER
Decision Evidence
Store
R isk A nal^is
Figure 2-4 High-level views of the SECURE framework
In order to take this decision, tw o sub-com ponents in the fram ew ork are used:
[image:30.542.22.529.26.792.2]• One that can dynam ically com pute the trust value, that is, the trustw orthiness
o f the requesting entity based on pieces o f evidence ([W agealla, 2003]);
• A risk m odule that can dynam ically evaluate the risk involved in the
interaction [D im m ock, 2003], [Dimm ock, 2004]; risk evidence is also needed.
The Entity R ecognition (ER ) m odule deals with digital virtual identities and is in
charge o f dynam ically recognizing them. In the background, another com ponent is in
charge o f gathering evidence: recom m endations, com parisons betw een expected
outcom es o f the chosen actions and real outcom es. This evidence is used to update
risk and trust inform ation. A key observation on the use o f trust is that trust is
unnecessary unless there is som ething at risk. Therefore the risk engine determ ines
the risk o f the current situation using inform ation supplied by the Evidence M anager.
The chosen action should m aintain the appropriate risk/benefit ratio. D epending on
dispositional trust and system trust, the weight o f the trust value in the final decision
may be small. This thesis is concerned with the risk aspects o f the SECU RE
framework.
2.6
Risk Probability Estimation
When quantitative risk analysis is performed, it is difficult to avoid estimating the risk
probability involved. Figure 2-5 illustrates the relationships o f security assessment,
risk assessment and risk probability estimation.
se cu rity a s s e s s m e n t
risk a sse ssm e n j quantitative an alysis
[image:32.545.15.538.25.823.2]risk probability estim ation
Figure 2-5: Security Assessment Content
Most o f the current methods for analyzing and addressing risk o f event e use a
derivative o f this formula;
R { e ) ^ P { e ) x V { e )
(2.l)
Where
P{e) is the probability o f event
e happening;
V{e) is the impact or
consequence o f e v e n te .
This is not an actual formula that should be used for quantitative analysis. Rather, it is
a guideline that illustrates the components for risk evaluation. This formula tells us
that risk evaluation is defined in two dimensions:
1. The uncertainty dimension: how often or how likely something is to happen,
i.e., probability o f occurrence.
2. The effect dimension; how big the consequence is, i.e., impact on objectives.
Proper evaluation o f risks requires an appropriate assessment o f both probability and
impact. The effect on objectives is relatively simple to estimate, as once the event can
be confirmed, the optimistic and pessimistic expected loss estimate can consist o f a
lower limit and upper limit o f an interval for impact on objectives. Utility theory as
developed by Von Neuman and Morgenstem provides an elegant way to make
consistent choices among risky alternatives by maximizing the expected value o f a
personal utility function over known probability distributions o f outcomes. The theory
is usually presented in the context o f a single (possibly complex) decision, where it
gives little guidance on the choice o f a utility function [Neumann and Morgenstern,
1947]. This thesis only focuses on estimating probability o f occurrence.
Some event probabilities can be predicted, such as the likelihood o f getting the latest
malicious virus if your systems are not patched. But it is not always true for an
arbitrary event. An assumption is that what we predict is not the behavior o f irrational
people or such entities. Additionally, there must be adequate historical data which has
covered all possible patterns for future events. It is hard to estimate the risk for a
person o f riding a motorcycle as he may have experience on riding a bicycle but no
experience in riding a motorcycle, i.e., the patterns o f riding a bicycle do not cover the
pattern o f riding a motorcycle. It is a strict constraint as well as one o f the
disadvantages o f all quantitative methods.
There are some mathematical formulas that need to be introduced for the following
chapters. We assume that any event can be represented as a feature vector and that the
vector elements are comparable. This is reasonable as different discrete numbers can
denote even different non-numeric features. The features describe the context o f and
the principals engaged in the event. R" denotes the n-dimensional feature space. An
event which has n-dimensional features is represented by a point
v e R" .
V =
which is normally called feature vector or independents. A
general risk probability formula is
wherei? is the probability o f the risk o f a certain event, whose range is (o ,l)'. It is
normally called dependent, v is the feature vector and
P
is an unknown
map which
maps
R ”
-> (0,1).
If the result o f the event is unexpected, we say that the response o f v is I and v is an
unexpected point; otherwise the response o f v is 0 and v is a normal point. If there are
m observations in the historical data(v,, Vj, v3,...v„), we convert the formula (2.2) to:
' W e assum e that it does not reach 0 o r 1 because 1 m eans that the event is definitely going to happen w hile 0 m eans that it is im possible to happen. T hey are either certain events o r im possible events and neither can be considered a risk.
R = P(v)
(2.2)
R = P{\
vv
(2.3)
For example, suppose driving car can be represented by a feature vector (location,
time, victim). Then (Dublin, Morning, Tom) is a concrete feature vector which means
Tom is driving a car in the morning in Dublin. If he met an accident in the morning,
then the response is 1. Otherwise, the response is 0. The {(Dublin, Morning, Tom), (1
or 0)} can describe the event and its result. (Dublin, Morning, Tom) is called
independents or feature vector. (1 or 0) is called dependent or response. Let us assume
that the feature vector and its response are observed once a day. If data about the
driving performance for 30 days is collected, then 30 feature vectors are collected. For
a new day, we can estimate the risk probability o f an accident (i.e., the response is 1)
according to the previous 30 days experience.
Risk probability can also be conceived to be a ratio between the number o f
unexpected results o f some events and the total number o f events in some
neighbourhood. Therefore, a general computable risk probability definition is the
following:
(2.4)
K ( v ) | l
Where
N^(v)
is an r-neighbourhood o f point v , A^,(v) =
: /? (v ,
7) < r } . The
r
-neighbourhood is not necessary a super sphere. ||A^^(v)j| is the number o f all the points
in this neighbourhood.
U{N^(v) )
is the number o f unexpected
points in this
neighbourhood.
Some existing estimation methods consider the risk probability estimating a
regression
procedure.
Therefore,
if
the
actual
underlying
formula
is
= /*(V|,V
2, V
3,...v^) , the regression analysis formula i s : /? = P '(v ,,v
2, v
3,...v „ ) .
Here function
P'
is an approximation to the function
P .
There are two broad categories o f probability interpretations which can be called
'objective' and 'subjective' probabilities [Singpurwalla and W ilson, 1999]. Objective
probabilities, which are also called physical or frequency probabilities, are associated
with random physical systems such as roulette wheels, rolling dice and radioactive
atoms. In such systems, a given type o f event (such as the dice yielding a six) tends to
occur at a persistent rate, or 'relative frequency', in a long run o f trials. Objective
probabilities either are, or are invoked to explain, these stable frequencies. Thus talk
about physical probability m akes sense only when dealing with well defined random
experiments.
Subjective probability, also called evidential or Bayesian probability, can be assigned
to any statem ent w hatsoever, even when no random process is involved, as a way to
represent its subjective plausibility, or the degree to which the statem ent is supported
by the available evidence. On m ost accounts, evidential probabilities are considered to
be degrees o f belief, defined in term s o f dispositions to gam ble at certain odds.
Obviously, this paper presents the estim ation m ethod for subjective probability.
In order to find a way to estim ate the risk probability precisely, it is also necessary to
understand the general data distribution and configuration. There are three data
distribution categories according to where the mode o f the data is located: unim odal
distributions, bim odal distributions and m ultimodal distributions. In a set o f data, the
mode is the m ost relative frequently observed data value. There may be no m ode if no
value appears m ore frequently than any other.
Unim odal D istribution
A distribution has only one mode. A typical exam ple is the
Gaussian distribution which happens to be also sym m etrical, but many unimodal
distributions are not sym m etrical (e.g., typically the asym m etry distribution is left-
skewed, see Figure 2-6).
« x -« ! • S »
<1» • «
[image:35.545.5.534.20.784.2]4X»-V "3 •»
Figure 2-6: G aussian and Skew D istribution
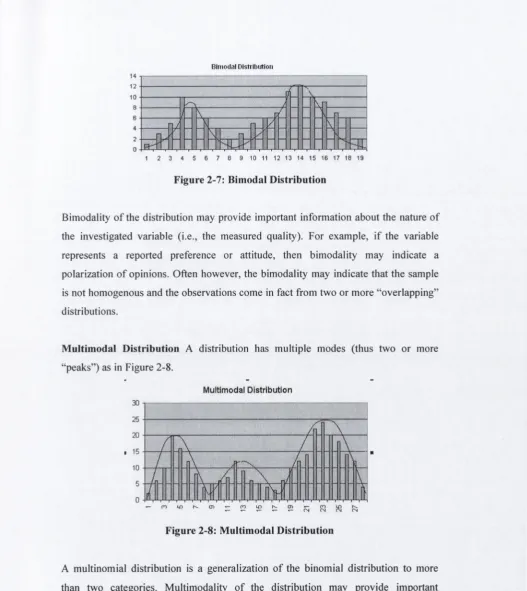
Bim odal D istribution
A distribution has two m odes (thus tw o “peaks” as shown in
Figure 2-7).
Bitiiodal Distrihtitioii 14
12 10 8 6 4 2 0
1 2 3 4 5 6 7 8 9 10 11 12 13 14 15 16 17 18 19
F ig u re 2-7: B im o d al D istrib u tio n
Bimodality o f the distribution may provide im portant inform ation about the nature o f
the investigated variable (i.e., the m easured quality). For exam ple, if the variable
represents a reported preference or attitude, then bim odality may indicate a
polarization o f opinions. O ften how ever, the bim odality may indicate that the sample
is not hom ogenous and the observations com e in fact from two or m ore “overlapping”
distributions.
M u ltim o d a l D istrib u tio n A distribution has m ultiple m odes (thus tw o or more
“peaks”) as in Figure 2-8.
A m ultinom ial distribution is a generalization o f the binom ial distribution to more
than tw o categories. M ultim odality o f the distribution m ay provide important
information about the nature o f the investigated variable (i.e., the m easured quality).
For exam ple, m ultim odality may indicate that there are several pronounced views or
patterns o f response in the questionnaires if the variable represents a reported
preference or attitude. The m ultim odality also may indicate that the sam ple is not
Multimodal Distribution 30
F ig u re 2-8: M u ltim o d a l D istrib u tio n
[image:36.544.12.540.18.610.2]hom ogenous and that observations in fact com e from tw o or m ore “overlapping”
distributions.
M ultinom ial distribution arises when a response variable is categorical in nature, i.e.,
consists o f data describing the m em bership o f the respective cases to a particular
category. I f the categories for the response variable can be ordered, then the

![Figure 2-3: Risk Assessment Work Flow (Adapted from (Stoneburner, 2001])](https://thumb-us.123doks.com/thumbv2/123dok_us/886737.601198/27.541.12.531.21.800/figure-risk-assessment-work-flow-adapted-stoneburner.webp)