www.wjpr.net Vol 3, Issue 9, 2014. 494
VALUE OF ASSESSING POST PRANDIAL AND FASTING PLASMA
GLUCOSE AS A SURROGATE FOR GLYCATED HEMOGLOBIN IN
DIABETIC GLYCEMIC CONTROL
Dr. Subinay Datta1, Dr. Mrinal Pal1 ⃰, Dr. Ritabrata Mitra2, Dr. Amrita Ganguly1, Dr. Subhadeep Basu1, Dr. Subhasish Manna1
1
Department of Biochemistry, Burdwan Medical College, Burdwan, West Bengal, India. 2
Department of Pulmonary Medicine, IPJMER, Kolkata, West Bengal, India.
ABSTRACT
Background: Control of plasma glucose could prevent the progression
of most of the complications of diabetes mellitus and glycated
hemoglobin is the most important criterion in controlling these
complications. But its non-availability in grass root level of health
sector and high cost, post-prandial and fasting blood glucose
estimation have came into the field particularly in developing countries
to assess glycemic control. Aim: To assess the better surrogate
parameter fasing or post-prandial blood glucose for glycated
haemoglobin that help in detecting the glycemic control status of
diabetic patients. Methods: In the study One 120 diabetic patients
attending an out-patient medical clinic were selected after simple
random method. The study population was divided into three groups
based on the HbA1c values i.e. Group 1 (HbA1c<7%-good control), Group 2 (HbA1c
7-9%-fairly controlled), Group 3 (HbA1c >9%-Poorly controlled). Glycated haemoglobin and
blood glucose estimations in all patients were carried out in the fasting state (at least after 8
hours of fasting) as well as postprandial state (two hours after lunch) on the same day.
Result: The mean glycated haemoglobin in three groups were 121.29 ± 28.91mg/dl and
165.61 ± 34.51mg/dl for group I, 154.78 ± 12.83 mg/dl and 206.92 ± 46.95 mg/dl for group II
and for group III 179.38 ± 26.02 mg/dl and 179.38 ± 26.02 mg/dl respectively and the
difference was statistically significant (p < 0.001). Regression analysis has pointed that PPBS
is more significantly correlated with HbA1C than FBS. PPBS showed better sensitivity
(92.5% vs. 85%), specificity (90% vs. 81%), positive predictive value (95% vs. 89%),
Volume 3, Issue 9, 494-503. Research Article ISSN 2277– 7105
Article Received on 24 August 2014,
Revised on 17 Sept 2014, Accepted on 12 Oct 2014
*Correspondence for
Author
Dr. Mrinal Pal
Department of
Biochemistry, Burdwan
Medical College,
Burdwan, West Bengal,
www.wjpr.net Vol 3, Issue 9, 2014. 495
negative predictive value (86% vs. 74%) and accuracy (92% vs. 83%) than Fasting glucose.
Conclusion: HbA1c remains the gold standard in assessment of glycemic control with
availability of standardized methods. However in resource poor settings & in conditions with
limitations for using HbA1c, PPBS can be used to monitor the glycemic control of diabetes.
KEY WORDS: Glycated hemoglobin, glycemic control, fasting glucose, post-prandial
glucose.
INTRODUCTION
Diabetes mellitus is a group of metabolic diseases characterized by hyperglycemia resulting
from defects in insulin secretion, insulin action, or both. [1] The chronic hyperglycemia of diabetes is associated with long term damage, dysfunction, and failure of various organs,
especially the eyes, kidneys, nerves, heart, and blood vessels. [2] Glycemic control is an important aspect in managing diabetes in order to prevent acute or chronic complications of
diabetes mellitus. Control of blood glucose in patients with diabetes can be assessed by
several methods. These include assessment of glycosylated hemoglobin (HBA1C), fasting
blood sugar (FBS), and postprandial blood sugar (PPBS). [3] The gold standard for assessment of glycaemic control at follow up is the glycosylated haemoglobin level. [4] But it is relatively costlier and it is not available in primary as well as secondary health sector level. So this test
is beyond the reach to most patients attending clinics at this trier of health delivery. So, the
present study was conducted in diabetic patients to investigate that overall efficiency of FBS
or PPBS to assess glycemic control in the absence of the ideal standard test for treatment
follow up.
2. MATERIALS AND METHODS
2.1 Study Area
This descriptive and cross-sectional study was conducted in the Department of Biochemistry
of Burdwan Medical College, Burdwan, West Bengal, India, with the collaboration of
Diabetic clinic in the Department of Medicine. All participants were recruited from the same
geographical area of the northern and southern areas of the Burdwan district.
2.2 Selection of Participants
A total of 120 individuals were selected, from 917 diabetic patients irrespective of type of
diabetes residing in the study area, by simple random sampling between February 2011 and
www.wjpr.net Vol 3, Issue 9, 2014. 496
were explained to them. Information regarding age, gender, Body mass index (BMI), type
and duration of intake of hypoglycaemic agents, self-reported dietary and drug compliance
were gathered. All the study population was strictly followed the Diabetic diet [5] and none of them were affected by any infection nor taken any medication that affects the glycemic status
of the subject atleast 6 months. Patients having any concomitant infection and suspicious or
diagnosis of other disease than diabetes mellitus were not included in the study. The study
population was divided into three groups based on the HbA1c values i.e. Group I (n = 40) -
HbA1c <7%-good control, Group II (n = 39) - HbA1c 7-9%,-fairly controlled, Group III (n =
41) HbA1c >9%-Poorly controlled.
2.3 Collection of Samples
Peripheral venous blood was drawn from all participants and the samples were divided into
two aliquots. The first one was collected in oxalate and fluoride vial for obtaining plasma for
fasting glucose estimation (at least eight hours of fasting) as well as in the postprandial state
two hours after lunch) on the same day, second one in EDTA containing vial for HbA1C
assays.
2.4 Estimation of Plasma Glucose Level
It was estimated by glucose oxidase-peroxidase enzymatic method using span diagnostic kit
as per the manufacturer’s instructions [6]
by completely automated clinical chemistry
analyzers – ERBA XL-600 after usual daily calibration and ensuring quality performance
before starting analysis and the samples were analyzed along with the other routine samples.
Intraassay CV% was 1.2% and interassay CV% was 2.1%.
Qualitative detection of glucose in urine was accomplished by Benedict’s test. Acceptable
control level of blood glucose were defined as FBS value equal or less than 110 mg/dL and
PPBS value equal or less than 126 mg/dL. (Harrison)
2.5 Estimation of HBA1C
Using commercially available Hemoglobin A1C kit supplied by Siemens Company did
Hemoglobin A1C test. It implies the principle of turbidimetric inhibition immunoassay
www.wjpr.net Vol 3, Issue 9, 2014. 497 2.6 Anthropometric Measurements
Weight and height measurements were obtained, usingstandardized technique. [10] BMI was calculated as the weight in kilograms divided by the square of height in meters.
2.7 Statistical Analysis
The data for biochemical analysis was subjected to standard statistical analysis using the
Statistical Package for Social Science (SPSS) 11.5 software for windows.
3. RESULT
3.1 Personal Profile and Clinical Details of Population under the Study
[image:4.595.156.439.335.611.2]The personal profiles and clinical parameters of all the subjects under study are shown in
Table 1.
Table 1: Baseline Characteristics of the Study Population.
Characteristics Value p value
n 120
Age (Years) 51± 12.2
Sex
Male Female
56 (46.7) 64 (53.3)
0.14
BMI 25.9 ± 5.1
Types of DM
1 2
58 (48.3) 62 (51.7)
0.22
Duration of diabetic treatment
in years ϯ 6.5 (2-25)
Treatment modality
Diet and life-style
management only
Sulfonylurea only Metformin only
Sulfonylurea + Metformin Insulin
21 (17.5) 20 (16.7) 28 (23.3) 27 (22.5) 24 (20)
0.08
Data are expressed as numbers (group percentages in parentheses) for categorical variables
and mean values ± SD for continuous variables. When variables were not normally
distributed, median values (Q1-Q3 IQR in parentheses) are given instead (indicated by ϯ);
IQR means Interquartile range.
Abbreviations
www.wjpr.net Vol 3, Issue 9, 2014. 498 3.2 Comparison of Mean Fasting and Post Prandial Blood Glucose Levels Among the
Study Groups.
The mean fasting plasma glucose and PPBS level in all three groups were 121.29 ±
28.91mg/dl and 165.61 ± 34.51mg/dl for group I, 154.78 ± 12.83 mg/dl and 206.92 ± 46.95
mg/dl for group II and for group III 179.38 ± 26.02 mg/dl and 179.38 ± 26.02 mg/dl
respectively and the difference was statistically significant (p<0.001) as shown in the Table 2.
Table 2: Mean Fasting And Post Prandial Blood Glucose Levels Among The Study
Groups.
Parameters Group I (n =40) Group II (n = 39) Group III (n = 41)
Mean FBS (mg/dl) 121.29 ± 28.91 154.78 ± 12.83 ⃰ 179.38 ± 26.0179.38 ± 26.02 2 ⃰
Mean PPBS (mg/dl) 165.61 ± 34.51 206.92 ± 46.95 ⃰ 234.98 ± 43.12 ⃰
Value are mean ± SD; n = number of cases;٭ indicates p < 0.05 (Statistically significant)
3.3 Correlation of HbA1C with PPBS and FBS
Regression analysis is performed to evaluate which method blood glucose estimation shows
best correlate with HbA1C parameter. Over the HbA1C, the PPBS shows a higher r value (r =
0.859, p 0.028) and FBS a lower r value (r = 0.838, p 0.041) of blood glucose estimation.
That signifies that PPBS is more significantly correlated with HbA1C than FBS as shown in
Table 3.
Table 3: Pearson’s Correlation of HbA1C with PPBS and FBS
Category r value Significance
HbA1C vs PPBS 0.859 0.028
HbA1C vs FBS 0.838 0.041
3.4 Detection of Performance of FBS and PPBS
To find out the validity of PPBS as an alternative to HbA1C over FBS in detection of diabetic
control status it was observed that the sensitivity of elevated PPBS in detecting the controlled
status of the patients was 87% with a specificity of 72%. The positive predictive value of
elevated PPBS was 87% and the negative predictive value of normal PPBS was 72% (Table 4
and Figure 1).
The sensitivity of elevated FBS in detecting the controlled status of the patients was 76%
with a specificity of 63%. The positive predictive value of elevated PPBS was 78% and the
www.wjpr.net Vol 3, Issue 9, 2014. 499
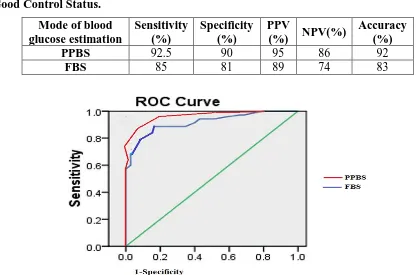
Table 4: Validity of Ppbs as an Alternative to Hba1c over Fbs in Detection of Diabetic
Good Control Status.
Mode of blood glucose estimation
Sensitivity (%)
Specificity (%)
PPV
(%) NPV(%)
Accuracy (%)
PPBS 92.5 90 95 86 92
FBS 85 81 89 74 83
Figure 1: Receiver Operative Characteristic (ROC) Curves of Two Modes of Blood
Glucose Estimation.
The area under the curve (AUC) of ROC curve of PPBS is more than FBS as shown in Table
3 and Figure 1 that is also proves PPBS is the better alternative than FBS.
Table 3: Area under the Roc Curve and Ci between the Different Modes of Blood
Glucose Estimation.
Category Area under the ROC curve CI
PPBS 0.933 86.1% - 99.2%
FBS 0.897 85.7% - 97.8%
4. DISCUSSION
Diabetes is a common non-communicable disease. In developing countries like India, posing
a huge economic burden on the family and nation as a whole. .Diabetes mellitus is a chronic
illness that requires continuing medical care, patient education, and support to prevent acute
complications and to reduce the risk of long-term complications. Control of blood glucose in
patients with diabetes can be assessed by several methods. These include assessment of
glycated hemoglobin (HBA1c), fasting blood sugar (FBS), and postprandial blood sugar
(PPBS). The gold standard for assessment of glycaemic control at follow up is the glycated
[image:6.595.80.498.96.371.2]www.wjpr.net Vol 3, Issue 9, 2014. 500
proteins such as HbA1c, formed through the non-enzymatic attachment of glucose to
haemoglobin, which is commonly considered to reflect the integrated mean glucose level
over the previous 8–12 weeks, the time period being dictated by the 120-day lifespan of the
erythrocyte.[12] The concentration of HbA1c predicts diabetes complications because it reflects more harmful glycation sequelae of diabetes, such as retinopathy and nephropathy,
which are understood to be due to harmful advanced glycation end products. [13-15] Moreover, HbA1c is undoubtedly a user friendly and stable test with very minimal biological variability
and which is not affected by factors which otherwise has considerable impact on glucose
measurement. [1, 6, 16] So the compliance of diabetic subjects is increased which is an important and welcome feature in diabetic management for patient as well as the treating
physicians. But despite its good compliance, a large number of medical conditions are
associated with alterations in the HbA1c values. Hematological conditions such as the
presence of hemoglobin variants, iron deficiency, and hemolytic anemia, the presence of
carbamylated hemoglobin in uremia, a variety of systemic conditions, including certain forms
of dyslipidemia, malignancies, and liver cirrhosis, various medications, and finally,
pregnancy are among the factors that influence the HbA1c measurement. [17, 18] So, the present study was performed to relate PPBS and FBS with HbA1C to search a better
alternative of HbA1C in developing countries like India where relatively costlier test HbA1C
is the beyond the reach of most patients attending clinics at state hospitals.
It was found that PPBS is more significantly correlated with HbA1C than FBS. Numerous
factors like stress, acute illness, medication, venous stasis, posture, sample handling, food
ingestion, prolonged fasting and exercise can alter fasting plasma glucose [19] not the PPBS. Very recent studies have also shown that PPBS predicts cardiovascular complications in
diabetic subjects.[20-23] Another study observed that with the focus on FBS did not show
signifdicant reduction in macrovascular but with PPBS monitoring, there was better
reduction of macrovascul;ar complications. [24-26]
From the data, sensitivity, specificity and positive predictive value was also calculated, to
predict good control of diabetes (HbA1c<7%) was considered as per American Diabetic
association (ADA) guidelines. PPBS showed better performance than Fasting glucose, in
detection of better glycemic control status. Result of the study indicate that PPBS level
www.wjpr.net Vol 3, Issue 9, 2014. 501 5. CONCLUSION
Our results indicate that PPBS level increased in all three groups and has a strong relationship
with the rising of HbA1C level. Increasing of HbA1C has shown more dependency with PPBS
as compared to with FBS level. So the PPBS is the better alternative to HbA1C than FBS in
developing countries to reduce the microvascular as well as macrovacular complications and
thus overall mortality in diabetes mellitus.
6. ACKNOWLEDGEMENT
Authors are thankful to Dr. Keya Pal, Dr. Supreeti Biswas and Dr. Shikha Banerjee and
Dr.G.D.Mitra of Burdwan Medical College and Hospital for constant support & inspiration.
7. Declaration of Conflict of Interest
We, the authors, are declaring that we do not have any conflict of interest regarding this
study.
REFERENCES
1. Swetha NK. Comparison of fasting blood glucose & post prandial blood glucose with
HbA1c in assessing the glycemic control. International J. of Healthcare and Biomedical
Research, 2014; 2(3):134-139.
2. Vinod Mahato R, Gyawali P, Raut PP, Regmi P, Singh KP, Raj Pandeya DP et.al.
Association between glycaemic control and serum lipid profile in type 2 diabetic patients:
Glycated haemoglobin as a dual biomarker. Biomedical Researchm, 2011; 22 (3): 375-80.
3. Goldstein DE, Little RR, Lorenz RA, Malone JI, Nathan D, Peterson D: Tests of
Glycaemia in diabetes (Technical Review) Diabetes Care, 1995; 18:896-909.
4. Rholfing CL, Weidmyer HM, Little RR, England JD, Tennil A, Goldstein DE: Defining
the relationship between plasma glucose and HBA1C Analysis Diabetes Care, 2002; 25:
275-8.
5. Viswanathan M, Mohan V. Dietary Management of Indian Vegetarian Diabetics. Bulletin
of the nutrition foundation of India, 1991; 12(2):1-2.
6. Sacks DB, Bruns DE, Goldstein DE, Maclaren NK, McDonald JM, Parrott M. Guidelines
and recommendations for laboratory analysis in the diagnosis and management of
diabetes mellitus. Clin. Chem. 2002; 48: 436-472.
7. Harrison
8. Hoelzel W, Weykamp C, Jeppsson JO, Miedema K, Barr JR, Goodall I, Hoshino T, John
www.wjpr.net Vol 3, Issue 9, 2014. 502
Umemoto M, Wiedmeyer HM. IFCC reference system for measurementof hemoglobin
A1c in human blood and the national standardization schemes in the United States, Japan,
and Sweden: a method-comparison study. Clin Chem. 2004; 50(1): 166-174.
9. Geistanger A, Arends S, Berding C, Hoshino T, Jeppsson JO, Little R, Siebelder C,
Weykamp C. Statistical methods for monitoring the relationship between the IFCC
reference measurement procedure for hemoglobin A1c and the designated comparison
methods in the United States, Japan, and Sweden. Clin Chem. 2008; 54(8): 1379-1385.
10.Deepa M, Pradeepa R, Rema M, et al. The Chennai Urban Rural Epidemiology Study
(CURES): Study design and Methodolgy (Urban component) CURES-1 J Assoc
Physicians India, 2003; 51:863-70.
11.Ghazanfari Z, Haghdoost AA, Alizadeh SM, Atapour J, Zolala F. A Comparison of
HbA1c and Fasting Blood Sugar Tests in General Population. Int J Prev Med. 2010;
1(3):187–194.
12.Klipatrik ES. Glycated haemoglobin in the year 2000. J. Cline pathol, 2000; 53:335-9.
13.Weykamp C, Garry John W, Mosca A. A Review of the Challenge in Measuring
Hemoglobin A1c.Journal of Diabetes Science and Technology, 2009; 3(3):439-45.
14.Pasupathi,P, Manivannan P M, Uma M, Deepa M, Glycated haemoglobin (HbA1c) as a
stable indicator of type 2 diabetes. Int J Pharm Biomed Res. 2010;1(2) :53-56.
15.Ken Sikaris. The Correlation of Hemoglobin A1c to Blood Glucose J Diabetes Sci
Technol, 2009; 3(3):429-38.
16.Little RR, Rohlfing CL, Tennill AL, Connolly S, Hanson S; Effects of sample storage
conditions on glycated haemoglobin measurement: evaluation of five different high
performance liquid chromatography methods. Diabetes Technol Ther, 2007; 9(1): 36–42.
17.Kilpatrick ES. Haemoglobin A1c in the diagnosis and monitoring of diabetes mellitus. J
Clin Pathol. 2008; 61(9):977–82.
18.Bloomgarden ZT. A1c: recommendations, debates, and questions. Diabetes Care. 2009;
32(12):141–7.
19.Young DS, Bermes EW; Preanalytical variables and biological variations. In Tietz
Textbook of Clinical Chemistry and Molecular Diagnostics. Burtis CA, Ashwood ER,
Bruns DE editors; St. Louis, Elsevier Saunders, 2006; 449–473.
20.Richard J Schrot. Targeting Plasma Glucose: Preprandial Versus Postprandial. Clinical
Diabetes, 2004; 22(4):169-72.
21.Rohlfing CL, Wiedmeyer HM, Little RR, England JD, Tennill A, Goldstein DE. Defining
www.wjpr.net Vol 3, Issue 9, 2014. 503
22.Temelkova-Kurktschiev TS, Koehler C, Henkel E, Leonhardt W, Fuecker K, Hanefeld M.
Post challenge plasma glucose and glycemic spikes are more strongly associated with
atherosclerosis than fasting glucose or HbA1C level. Diabetic Care, 2002; 23:1830-4.
23.Action to Control Cardiovascular Risk in Diabetes Study Group, Gerstein HC, Miller
ME, Byington RP, Goff DC Jr, Bigger JT, et al. Effects of intensive glucose lowering in
type 2 diabetes N Engl J Med, 2008; 358:2545-59.
24.Erlinger TP, Brancati FL. Post challenge hyperglycemia in a national sample of use
Adults with type 2 Diabetes. Diabetes Care, 2001; 24:1734-8.
25.Tominaga M, Eguchi H, Manaka H, Igarashi K, Kato T, Sekikawa A. Impaired glucose
tolerance is a risk factor for cardiovascular disease, but not impaired fasting glucose.
Diabetes Care, 1999; 22:920-4.
26.Parkin CG, Brooks N. Is postprandial glucose control important? Is it practical in primary