Munich Personal RePEc Archive
Corruption and the Shadow Economy at
the Regional Level
Gillanders, Robert and Parviainen, Sinikka
May 2015
öMmföäflsäafaäsflassflassflas
fffffffffffffffffffffffffffffffffff
Discussion Papers
Corruption and the Shadow Economy at the
Regional Level
Robert Gillanders
Hanken School of Economics and HECER
and
Sinikka Parviainen
Aalto University and UNU-WIDER
Discussion Paper No. 392
May 2015
ISSN 1795-0562
HECER
–
Helsinki Center of Economic Research, P.O. Box 17 (Arkadiankatu 7), FI-00014
HECER
Discussion Paper No. 392
Corruption and the Shadow Economy at the
Regional Level*
Abstract
The links between corruption and the shadow economy have mostly been studied
empirically at the country level. This paper contributes to this literature by examining the
relationship at the sub-national level. Using World Bank Enterprise Survey data, we find
that sub-national units in which more firms report that corruption is an obstacle to their
operations also tend to have more firms that report informal competitors as an obstacle
and vice versa. We also ask whether within country variation matters and find that regions
with a bigger problem in one of these dimensions than their national average also tend to
have a relatively bigger problem in the other dimension. Sub-Saharan Africa is different in
that neither of these findings are evident in that sub-sample.
JEL Classification:
D73, K49, O17
Keywords:
corruption, shadow economy, regional variation, within-country variation
Robert Gillanders
Sinikka Parviainen
Hanken School of Economics
Aalto University School of Business
Department of Economics
Department of Economics
P.O. Box 479
P.O. Box 21240
FI-00101 Helsinki
FI-00076 Aalto
FINLAND
FINLAND
e-mail: rgillanders@gmail.com
e-mail: sinikka.parviainen@aalto.fi
*
We are grateful to Michael Breen, Tom Berglund and seminar participants at the Hanken
1
Introduction
This paper contributes to an interesting and important literature that has sought to establish the existence and nature of the relationship between corruption and the shadow economy. The weight of the existing evidence, which we discuss below, suggests that corruption and the shadow economy are complements in the sense that countries with a larger shadow economy tend to perform worse on various indices of perceived corruption. We take the analysis to the regional (or sub-national) level by using data from the World Bank’s Enterprise Surveys (ES). We ask whether sub-national regions in which more firms say that corruption is a problem for their operations also have more firms claiming that informal sector competitors are a problem for their operations. Our findings that more corrupt regions tend to have a bigger problem with the shadow economy and vice versa is in line with the existing cross-country literature. We also find that within cross-country variation matters in that regions which are more corrupt than their national average tend to have a bigger problem with the informal sector than the average region in that country and vice versa. Africa seems to be different though in that neither of these findings holds when we restrict our sample to sub-Saharan African countries.
Corruption and informal economic activities remain widespread in the world and have been shown to be rather costly illicit phenomena in a variety of ways. For example, the seminal works of Mauro (1995) and Wei (2000) show that corruption has negative implications for economic growth and foreign direct investment flows respectively. Gupta et al. (2002) find that corruption increases both inequality and poverty and Breen and Gillanders (2012) argue that corruption leads to more burdensome regulation of firms. Informal economic activity is costly in terms of lost revenue to the state. Recent estimates presented by Schneider et al. (2010) put the weighted average size of the informal economy as a percentage of GDP at nearly 38% in sub-Saharan Africa, 36% in the Europe and Central Asia region and 13% in the OECD (p 457). Schneider and Enste (2000) point out that a large shadow economy also distorts policymaking via the generation of biased statistics on employment, consumption and other such quantities of interest. Dreher et al. (2014) argue and demonstrate that correcting output information to include shadow output can matter for the formulation of policy when the objective is to improve income rather than official income.
corruption incentivises and enables firms to move to the shadows. Models of this flavour can be found in Johnson et al. (1997), Hindriks et al. (1999), and Hibbs and Piculescu (2005). As mentioned above and elaborated on below, while there is empirical evidence in favour of both sets of theories, the weight of evidence seems to fall in favour of the complement theories. This evidence though has been mostly generated from cross country data with a necessarily small number of observations. Taking the analysis to the regional level offers a new perspective and means of testing these theories as well as being of interest in its own right. Within country variation in corruption has been shown to exist in the case of Italy by Golden and Picci (2005) and in the countries covered by the ES by Gillanders (2014). Torgler et al. (2010) and Buehn (2012) demonstrate that there is variation in the extent of the shadow economy across Swiss cantons and German districts respectively and Tafenau et al. (2010) similarly show that the depth of the shadow economy varies within European countries. The ES allows us to illustrate that this is true for a broad range of countries. Understanding how these two particular types of illicit activity associate with each other is important for regional policy, especially in this age of targeted development interventions. If we target the shadow economy in a region with, say, a incentivised registration scheme, are we likely to improve or worsen the region’s corruption problem?
The next section of this paper further reviews the relevant empirical literature. Section 3 discusses the data and our approach. Section 4 presents our results and discusses their implications and Section 5 concludes.
2
The Existing Literature
While the literature on the links between corruption and the shadow economy is rather small, it has attracted the attention of many leading researchers and they have uncovered some interesting, albeit occasionally conflicting, results. We noted above that there exist theoretical models which predict a complementary relationship (Johnson et al. (1997), Hin-driks et al. (1999), and Hibbs and Piculescu (2005)) and those that suggest the relationship is substitutive (Choi and Thum (2005) and Dreher et al. (2009)).
Johnson et al. (1997) and Johnson et al. (1999) provide early empirical investigations into the relationship between corruption and the shadow economy and find that countries with greater levels of perceived corruption have larger shadow economies.1
Friedman et al. (2000) similarly find that corruption and informal activity are complements in this way in a some-what larger sample and motivate this finding with a micro level model of an entrepreneur’s choice. Johnson et al. (2000) use firm level data and find that firms that pay bribes tend to
1
hide output. This first wave of empirical work therefore seemed to confirm the early models of complementarity. Lassen (2007) and Torgler and Schneider (2009) also lend some more recent support to these models in that they both find that more corruption in a country, alongside other measures such as ethnic fractionalisation and poor institutional quality re-spectively, is associated with a larger shadow economy. Dreher et al. (2009) on the other hand present evidence in favour of their model in which the shadow economy affects corruption and the two are substitutes.
The majority of these empirical contributions are framed as studies of the effects of corrup-tion on the shadow economy and for the most part do not tackle the issue of whether the shadow economy feeds or tempers corruption, Dreher et al. (2009) being a notable excep-tion.2
A recent strand of the literature has explicitly looked at both sides of the relationship simultaneously and attempted to resolve this mixed evidence. Dreher and Schneider (2010) attempt to resolve the conflicting evidence by speculating that a complementary relation-ship may obtain in low income countries while the two may be substitutes in high income settings.3
Estimating equations for both corruption and the shadow economy they find no robust overall relationship, however they do find evidence of a complementary relationship in low income countries. Buehn and Schneider (2012) further acknowledge the probable interre-lationship of corruption and the shadow economy by estimating a structural equation model. Given the requirements of their methodology they are limited to examining 51 countries over a five year period but they do find robust evidence of a complementary relationship within this sample. Goel and Saunoris (2014) provides an interesting new take on the question by employing spatial econometric methods. They present some evidence of complementarity within countries though it is not robust. They do however find evidence of own contagion in corruption and the shadow economy while their evidence on cross-contagion suggests that there is substitution between a country’s own shadow economy and neighbouring corruption (and vice versa).
The weight of the available evidence therefore suggests that the shadow economy and cor-ruption are complements though it seems that this may depend on the context to some degree and also that there may be interesting things going on with regards to spatial effects. It should be noted that almost all of this evidence comes from country level studies where the sample sizes are often somewhat small and constrained by the needs of the methodol-ogy chosen. Our approach, to which we will now turn, can be viewed in the light of this literature as an attempt to test the competing theories with larger sample sizes by making use of previously untapped variation in both variables of interest. In addition, by taking the analysis to the regional level we hope to offer a fresh viewpoint on the issue for policymakers.
2
Dreher et al. mention in Footnote 22 of their paper that they also estimated models in which corruption could influence the shadow economy and found no significant effect.
3
G¨erxhani (2004) similarly argues that the differences between developed and developing are important
3
Data
3.1
Measurements of Corruption and the Shadow Economy
The data used in this paper comes from the World Bank’s Enterprise Surveys (ES) project. The ES collect data from firms in an increasing number of countries and are designed to be a representative sample.4
From this firm level data we create regional indicators as is done in Gillanders (2014). To measure corruption and the shadow economy at the regional level we make use of two questions that ask firms how much of an obstacle corruption and informal competitors are to their operations. Firms can offer answers ranging from no obstacle to very severe obstacle. For both the corruption and the shadow economy questions, we create a firm level dummy variable that takes a value of one if the firm says that the issue is a major or very severe obstacle and zero otherwise. By averaging these firm level dummies by region we obtain regional indicators that we use in the analysis below. It should be noted that the sub-national units identified in the data are not necessarily real administrative divisions. Some countries and therefore some regions have been surveyed more than once. We have available to us a sample of 400 regional observations from across the world. The countries included in our sample are listed in Table A1 in the appendix.
The resulting corruption measure may at first glance be seen as a product of necessity in that we need a measure at the regional level and the more commonly used corruption indices mostly exist only at the national level. However these commonly used indices have been the subject of increasing criticism with leading scholars pointing out that measures such as the Corruption Perceptions Index are subject to perceptions biases (Svensson (2003); Reinikka and Svensson (2006); Treisman (2007); Fan et al. (2009)) and they may lag reality (Knack (2007); Kenny (2009)). It has been argued that well designed surveys, of which the ES are an exemplar, can yield more convincing evidence on the nature and extent of corruption (Svensson (2005); Reinikka and Svensson (2006)) and it has been demonstrated that the difference between perceptions and the reality of experienced corruption can be large (Treisman (2007); Razafindrakoto and Roubaud (2010); Donchev and Ujhelyi (2014); Gillanders and Parviainen (2014)). Gillanders (2014) uses this index to study the relationship between corruption and infrastructure at the regional level and shows that there is substantial within and cross-country variation.
Several methods of estimating the extent of the shadow economy have been employed in the literature. The most commonly used and accepted is perhaps the multiple-indicators multiple-causes (MIMIC) procedure used by Schneider and coauthors in several papers. De-tails of the method can be found in Schneider et al. (2010). Elgin and ¨Oztunali (2012) criticise this approach and present estimates obtained from a calibrated dynamic general
4
equilibrium model. Another set of estimates are provided by Alm and Embaye (2013) whose approach makes use of dynamic panel data methods. However, Torgler et al. (2010) ac-knowledge the limitations and likely errors in MIMIC estimates and that measurement error is likely to be unavoidable in any attempt to measure a phenomenon that by its very name evokes darkness. Further, the results of Goel and Saunoris (2014) are insensitive to which of these three estimates of the shadow economy they use. There have been many more at-tempts to estimate the size of the shadow economies and the appendix to Schneider (2005) provides an excellent overview. Measurement is further complicated by definitional problems (Schneider and Enste (2000); G¨erxhani (2004)).
The measure we use here is clearly more straightforward than the ones mentioned above and differs from them in a key sense. While methods such as the MIMIC approach provide information about the extent of the shadow economy, the ES based measure we use provides information about the extent to which firms see the shadow economy as a problem. This is not a trivial distinction.5
Again it may initially seem that we are obliged to use this measure out of necessity but both pieces of information should be of interest to policymakers. A larger shadow economy may indicate that a lot of potential tax revenue is failing to be captured by the state while a more burdensome shadow economy in the eyes of the official sector is of clear importance for policymaking.6
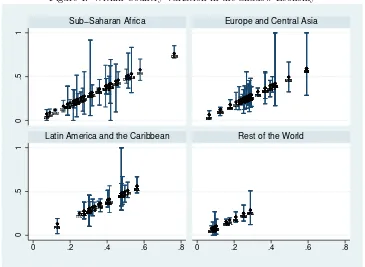
Figure 1 shows that there is large cross and within country variation in this index of the shadow economy. The dots give the country average while the upper and lower bars show the maximum and minimum values reported by the regions in that country. Table 1 presents means and summary statistics (at the sub-national level) for the variables used in this paper. 33% of firms in the average region in Sub-Saharan Africa feel that the shadow economy is an obstacle and, similar to the pattern in Schneider et al. (2010), this fraction is only slightly lower in the Europe and Central Asia sample. The story is much the same with regards to corruption. In the Latin America and Caribbean sample, both of these numbers are substanitally higher and this is the case for the other variables we use that ask about obstacles. This may be in part an artifact of cultural propensities to complain more or less about certain things and so it will be important to control for country fixed effects in our analysis. That said, Schneider et al. (2010) also identify this region as having the highest (unweighted) mean informality.
5
The correlation between the Schneider et al. (2010) shadow economy measure and the ES variable at the macro level is only 0.17 though as we only have a small overlap of 34 observations this is perhaps not overly informative.
6
Figure 1: Within Country Variation in the Shadow Economy AGO AGO AGO AGO AGO AGO BEN BEN BEN BFA BFA BWA BWA BWA BWA CIV CIV CIV CMR CMR CMR COG COG CPV CPV CPV GAB GAB GAB GIN GIN GMB GMB KEN KEN KEN KEN LBR LBR LBR MDG MDG MDG MDG MLI MLI MLI MLI MLI MLI MLI MLIMOZMOZMOZMOZ MRT MRT MUS MUS MUS MUS MUS MUS MWI MWI MWI NAM NAM NER NER NGA NGA NGA NGA NGA NGA NGA NGA NGA NGA NGA RWA RWA SEN SEN SEN SEN SLE SLE SWZ SWZ SWZ TZA TZA TZA TZA UGA UGA UGA UGA UGA ZAF ZAF ZAF ZAF ZMB ZMB ZMB ZMB ALB ALB ALB ALB ALB ALB ALB ALB ARM ARM ARM ARM AZE AZE AZE AZE BGR BGR BGR BGR BGR BGR BGR BGR BGR BGR BIH BIH BIH BIH BLR BLR BLR BLR BLR BLR BLRCZECZECZECZECZECZECZECZE
EST EST EST EST EST GEO GEO GEO GEO GEO GEO HRV HRV HRV HRV HRV HRV HUN HUN HUNKAZKAZKAZKAZKAZ
KGZ KGZ KGZ KGZ KGZ LTU LTU LTU LTU LVA LVA LVA LVA LVA LVA MDA MDA MDA MDA MKD MKD MKD MKD MNG MNG MNG MNG MNG POL POL POL POL POL POL RUS RUS RUS RUS RUS RUS RUS SVK SVK SVK SVK SVN SVN TJK TJK TJK TJK TUR TUR TUR TUR TUR UKR UKR UKR UKR UKR UZB UZB UZB ARG ARG ARG ARG ARG ARG ARG ARG ARG BOL BOL BOL BOL BOL BOL BRA BRA BRA BRA BRA BRA BRA BRA BRA BRA BRA BRA BRA BRA BRA CHL CHL CHL CHL CHL CHL CHL CHL CHL COL COL COL COL COL COL COL COL CRI CRI DOM DOM ECU ECU ECU ECU ECU ECU GTM GTM GTM GTM JAM JAM MEX MEX MEX MEX MEX MEX MEX MEX MEX MEX MEX MEX MEX MEX MEX MEXNICNICNICNIC
PAN PAN PAN PAN PER PER PER PER PER PER PERPRYPRYPRYPRY SLV SLV SLV SLV TTO TTO URY URY URY URY AFG AFG AFG AFG AFG AFG BGD BGD BGD BGD BGD BGD BTN BTN BTN BTNLAOLAOLAOLAOIDNIDNIDNIDNIDNIDNIDNIDNIDN
NPL NPL NPL PHL PHL PHL PHL PHL VNM VNM VNM VNM VNM YEM YEM YEM YEM YEM YEM 0 .5 1 0 .5 1
0 .2 .4 .6 .8 0 .2 .4 .6 .8
Sub−Saharan Africa Europe and Central Asia
Latin America and the Caribbean Rest of the World
Table 1: Summary Statistics
Full Sub-Saharan Europe and Latin America Rest of
Sample Africa Central Asia and Caribbean the World
Shadow 0.318 0.331 0.305 0.390 0.161
(0.176) (0.205) (0.161) (0.140) (0.103)
Corruption 0.374 0.330 0.321 0.500 0.338
(0.215) (0.231) (0.162) (0.183) (0.259)
Log of Average Total Cost of Labour 12.581 11.457 13.022 13.530 11.799
(1.585) (1.583) (1.301) (1.110) (1.304)
Average % of Sales That Are National 90.658 94.858 87.466 91.463 88.135
(8.076) (5.373) (8.584) (5.731) (11.183)
Bureaucratic Burden 0.688 0.635 0.636 0.907 0.464
(0.449) (0.478) (0.283) (0.544) (0.334)
Inadequately Educated Workforce 0.275 0.185 0.312 0.380 0.144
(0.189) (0.171) (0.155) (0.198) (0.118)
[image:9.595.113.502.445.657.2]3.2
Specification and Controls
Following closely the specification of Dreher and Schneider (2010), we estimate models of the following form:
Yij =α+β1Xij+β2Zij′ +uj+ǫij (1)
whereYij is our measure of corruption (the shadow economy) in regioniin countryj while
Xij measures the shadow economy (corruption). Zij′ includes controls which we will discuss
in a moment,uj are country dummies, andǫij is an error term. It is well known and rather
obvious that endogeneity is a problem in estimating the relationship between the shadow economy and corruption. As discussed above, solid theories exist for a relationship running in both directions. Macro level studies have availed of instrumental variables capturing deep historical and geographical characteristics of the society (Dreher and Schneider (2010)) and structural equation models (Buehn and Schneider (2012)). Since we are dealing with data based on surveys of individual firms in sometimes loosely defined sub-national units, we estimate Equation (1) with OLS and are formally limited to talking in terms of associations and not causal relationships. Still, we feel that by studying these relationships at this level we can learn something new and interesting about them, especially when we turn to consider deviations from the national average. The inclusion of country fixed effects may lessen concerns about corruption and the shadow economy being commonly caused by macro level phenomenon.
Table 2: Corruption and the Shadow Economy at the Regional Level
(1) (2) (3) (4)
Corruption Corruption Shadow Shadow
Shadow 0.340*** 0.178**
(0.0912) (0.0782)
Corruption 0.288*** 0.147**
(0.0795) (0.0718)
Log of Average Total Cost of Labour -0.0221** -0.000989
(0.00974) (0.00777)
Average % of Sales That Are National 0.000861 0.00116
(0.00117) (0.000888)
Bureaucratic Burden 0.149*** 0.165***
(0.0401) (0.0431)
Inadequately Educated Workforce 0.283*** 0.0480
(0.0796) (0.0776)
Constant 0.437*** 0.513** 0.134* -0.00809
(0.124) (0.210) (0.0741) (0.152)
Country Fixed Effects Yes Yes Yes Yes
N 400 398 400 398
R2
0.704 0.762 0.628 0.695
Robust standard errors in parentheses
*p <0.10, **p <0.05, ***p <0.01
4
Results
4.1
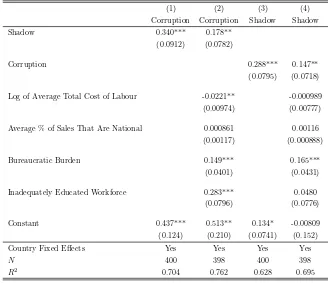
Complements or Substitutes?
endogeneity this is a potentially important and useful finding as it gives policy-makers some reason to expect that reducing the size of the shadow economy in a region will also yield benefits in terms of abating corruption. Likewise, curbing corruption would seem to be associated with a diminution of the shadow economy - an additional factor to be considered in the cost-benefit analysis of anti-corruption measures. We will discuss how future work could take these simple OLS results as a starting point for more conclusive, and expensive, research in the concluding section.
The results for some of the control variables are interesting and worth noting in brief. Our proxy for regional income is associated with corruption but not the shadow economy. The international focus of a region seems to play no role in either regard. Something that matters a great deal is the level of bureaucratic burden. Regions with more burdensome regulation, according to our index, tend to have a larger shadow economy and a greater problem with corruption.7
This is in line with much of the previous literature that we discussed above and again offers a fresh perspective on the issue. Finally, regions with an inadequately educated workforce in the eyes of firms tend to have a larger corruption problem but the level of human capital, thus defined, does not matter for the shadow economy.
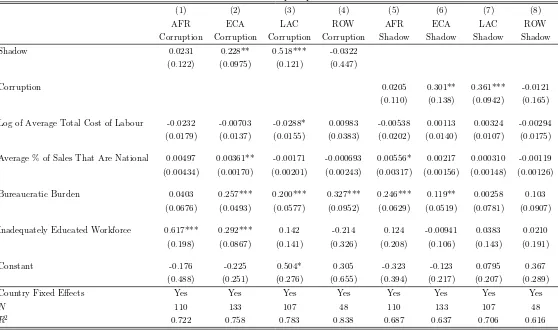
While corruption and the shadow economy may be complements at the sub-national level on average, it does not follow that this need be the case everywhere. G¨erxhani (2004) argues that the differences between different types of country should be borne in mind and Dreher and Schneider (2010) find that while there is a complementary relationship in low income countries this does not seem to be the case in high income countries. In addition, there are important social and cultural characteristics that we are not explicitly controlling for, though we do have country fixed effects. Lassen (2007), for example, argues that trust and ethnic fractionalisation matter for the size of the shadow economy. Dreher et al. (2009) argue for the importance of institutional quality for both phenomena of interest. Goel and Saunoris (2014) show that the neighbourhood a country finds itself in matters. Thus, context can matter and with this in mind and in order to refine our policy advice, we split our sample into groups defined by broad global region.
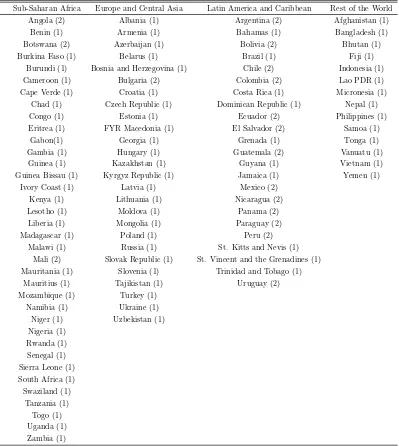
Table 3 presents the results. Even splitting our sample into four groups, the composition of which can be seen in Table A1 in the appendix, we still have a reasonable number of observations in three of them (the rest of the world category being a small and rather heterogeneous group). While our conclusions from Table 2 above are still applicable for both the Europe and Central Asia, and Latin America and Caribbean samples, in the case
7
Table 3: Sample Splits
(1) (2) (3) (4) (5) (6) (7) (8)
AFR ECA LAC ROW AFR ECA LAC ROW
Corruption Corruption Corruption Corruption Shadow Shadow Shadow Shadow Shadow 0.0231 0.228** 0.518*** -0.0322
(0.122) (0.0975) (0.121) (0.447)
Corruption 0.0205 0.301** 0.361*** -0.0121
(0.110) (0.138) (0.0942) (0.165)
Log of Average Total Cost of Labour -0.0232 -0.00703 -0.0288* 0.00983 -0.00538 0.00113 0.00324 -0.00294 (0.0179) (0.0137) (0.0155) (0.0383) (0.0202) (0.0140) (0.0107) (0.0175)
Average % of Sales That Are National 0.00497 0.00361** -0.00171 -0.000693 0.00556* 0.00217 0.000310 -0.00119 (0.00434) (0.00170) (0.00201) (0.00243) (0.00317) (0.00156) (0.00148) (0.00126)
Bureaucratic Burden 0.0403 0.257*** 0.200*** 0.327*** 0.246*** 0.119** 0.00258 0.103 (0.0676) (0.0493) (0.0577) (0.0952) (0.0629) (0.0519) (0.0781) (0.0907)
Inadequately Educated Workforce 0.617*** 0.292*** 0.142 -0.214 0.124 -0.00941 0.0383 0.0210 (0.198) (0.0867) (0.141) (0.326) (0.208) (0.106) (0.143) (0.191)
Constant -0.176 -0.225 0.504* 0.305 -0.323 -0.123 0.0795 0.367 (0.488) (0.251) (0.276) (0.655) (0.394) (0.217) (0.207) (0.289) Country Fixed Effects Yes Yes Yes Yes Yes Yes Yes Yes
N 110 133 107 48 110 133 107 48
R2 0.722 0.758 0.783 0.838 0.687 0.637 0.706 0.616
Robust standard errors in parentheses
of sub-Saharan Africa we fail to find any significant association between corruption and the shadow economy. Not only are the relevant coefficients insignificant they are much smaller in magnitude.
One plausible explanation for this is that the measures that we are using might not be ap-propriate for measuring corruption and the shadow economy in sub-Saharan Africa. Asking about “obstacles” might not make sense in a context in which, according to the popular narrative and measurements, corruption and informal activity are all pervasive. The fact that according to Table 1 many firms in sub-Saharan Africa do see these factors as obstacles gives us some reassurance that inappropriate measurement is not the problem. Indeed as we noted above the means in the African sample are much the same as those in the Europe and Central Asia sample and this is in line with the pattern in the Schneider et al. (2010) data. Still, the possibility remains that due to acclimatisation to a hugely and persistently corrupt environment, for example, the true number of firms who are objectively hampered by corruption in Africa is much higher than we observe in the ES data. It could also be the case that the mechanisms proposed in the theories break down at the sub-national level in the case of sub-Saharan Africa. This could be due to the nature of corruption differing in this part of the world or to a different relationship between a country’s regions and the centre when it comes to corruption and the shadow economy. A final consideration is the fact that the significance of some of the other covariates also changes across samples. This supports the idea that the importance of certain factors for corruption and the shadow economy varies around the world.
4.2
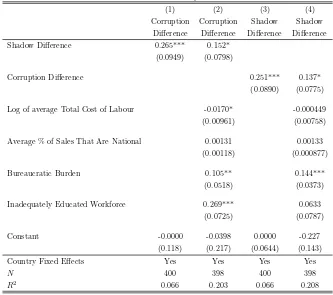
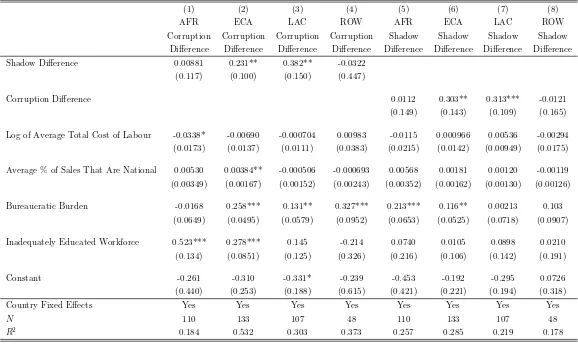
Within Country Variation
Table 4: Within Country Variation
(1) (2) (3) (4)
Corruption Corruption Shadow Shadow
Difference Difference Difference Difference
Shadow Difference 0.265*** 0.152*
(0.0949) (0.0798)
Corruption Difference 0.251*** 0.137*
(0.0890) (0.0775)
Log of average Total Cost of Labour -0.0170* -0.000449
(0.00961) (0.00758)
Average % of Sales That Are National 0.00131 0.00133
(0.00118) (0.000877)
Bureaucratic Burden 0.105** 0.144***
(0.0518) (0.0373)
Inadequately Educated Workforce 0.269*** 0.0633
(0.0725) (0.0787)
Constant -0.0000 -0.0398 0.0000 -0.227
(0.118) (0.217) (0.0644) (0.143)
Country Fixed Effects Yes Yes Yes Yes
N 400 398 400 398
R2
0.066 0.203 0.066 0.208
Robust standard errors in parentheses.
*p <0.10, **p <0.05, ***p <0.01.
The term “difference” refers to the sub-national unit’s variation from it’s national average.
used as a motivation and starting point for future work.
5
Conclusions
This paper contributes to a literature that has, for the most part, found that corruption and the shadow economy are complements at the country level. Our analysis at the level of sub-national units using Enterprise Surveys data likewise finds that the two illicit phenomena are strongly and significantly positively correlated. Regions with more of a problem in terms of one tend to have more of a problem in terms of the other. Expressing our measures of the problems in terms of deviations from national averages showed a similar pattern. Relatively more corrupt regions tend to be relatively more burdened by the shadow economy. Motivated by interesting findings in the literature, we split the sample into groups defined by broad global region and found that while our results hold in the Europe and Central Asia, and Latin America and Caribbean groups, these relationships are not evident in sub-Saharan Africa.
While our OLS results limit us to speaking of associations rather than causality, they fit well with the literature at the macro level. At the macro level, researchers have had available to them certain instrumental variable and structural modeling strategies that, to us, seem infeasible with the survey data we employ in this regional analysis. These findings should be of interest to policymakers and to other actors interested in the design and evaluation of targeted regional development interventions. According to these results, encouraging and incentivising firms to move from the shadows may yield additional benefits in terms of reduced corruption. Similarly, reducing corruption in a region may give rise to an increase in the number of firms caught in the tax net.
Table 5: Within Country Variation: Sample Splits
(1) (2) (3) (4) (5) (6) (7) (8)
AFR ECA LAC ROW AFR ECA LAC ROW
Corruption Corruption Corruption Corruption Shadow Shadow Shadow Shadow Difference Difference Difference Difference Difference Difference Difference Difference Shadow Difference 0.00881 0.231** 0.382** -0.0322
(0.117) (0.100) (0.150) (0.447)
Corruption Difference 0.0112 0.303** 0.313*** -0.0121 (0.149) (0.143) (0.109) (0.165)
Log of Average Total Cost of Labour -0.0338* -0.00690 -0.000704 0.00983 -0.0115 0.000966 0.00536 -0.00294 (0.0173) (0.0137) (0.0111) (0.0383) (0.0215) (0.0142) (0.00949) (0.0175)
Average % of Sales That Are National 0.00530 0.00384** -0.000506 -0.000693 0.00568 0.00181 0.00120 -0.00119 (0.00349) (0.00167) (0.00152) (0.00243) (0.00352) (0.00162) (0.00130) (0.00126)
Bureaucratic Burden -0.0168 0.258*** 0.131** 0.327*** 0.213*** 0.116** 0.00213 0.103 (0.0649) (0.0495) (0.0579) (0.0952) (0.0653) (0.0525) (0.0718) (0.0907)
Inadequately Educated Workforce 0.523*** 0.278*** 0.145 -0.214 0.0740 0.0105 0.0898 0.0210 (0.134) (0.0851) (0.125) (0.326) (0.216) (0.106) (0.142) (0.191)
Constant -0.261 -0.310 -0.331* -0.239 -0.453 -0.192 -0.295 0.0726 (0.440) (0.253) (0.188) (0.615) (0.421) (0.221) (0.194) (0.318) Country Fixed Effects Yes Yes Yes Yes Yes Yes Yes Yes
N 110 133 107 48 110 133 107 48
R2 0.184 0.532 0.303 0.373 0.257 0.285 0.219 0.178
Robust standard errors in parentheses
*p <0.10, **p <0.05, ***p <0.01
Table A1: List of Countries Included in the Analysis
Sub-Saharan Africa Europe and Central Asia Latin America and Caribbean Rest of the World
Angola (2) Albania (1) Argentina (2) Afghanistan (1)
Benin (1) Armenia (1) Bahamas (1) Bangladesh (1)
Botswana (2) Azerbaijan (1) Bolivia (2) Bhutan (1)
Burkina Faso (1) Belarus (1) Brazil (1) Fiji (1)
Burundi (1) Bosnia and Herzegovina (1) Chile (2) Indonesia (1)
Cameroon (1) Bulgaria (2) Colombia (2) Lao PDR (1)
Cape Verde (1) Croatia (1) Costa Rica (1) Micronesia (1)
Chad (1) Czech Republic (1) Dominican Republic (1) Nepal (1)
Congo (1) Estonia (1) Ecuador (2) Philippines (1)
Eritrea (1) FYR Macedonia (1) El Salvador (2) Samoa (1)
Gabon(1) Georgia (1) Grenada (1) Tonga (1)
Gambia (1) Hungary (1) Guatemala (2) Vanuatu (1)
Guinea (1) Kazakhstan (1) Guyana (1) Vietnam (1)
Guinea Bissau (1) Kyrgyz Republic (1) Jamaica (1) Yemen (1)
Ivory Coast (1) Latvia (1) Mexico (2)
Kenya (1) Lithuania (1) Nicaragua (2)
Lesotho (1) Moldova (1) Panama (2)
Liberia (1) Mongolia (1) Paraguay (2)
Madagascar (1) Poland (1) Peru (2)
Malawi (1) Russia (1) St. Kitts and Nevis (1)
Mali (2) Slovak Republic (1) St. Vincent and the Grenadines (1)
Mauritania (1) Slovenia (1) Trinidad and Tobago (1)
Mauritius (1) Tajikistan (1) Uruguay (2)
Mozambique (1) Turkey (1)
Namibia (1) Ukraine (1)
Niger (1) Uzbekistan (1)
Nigeria (1) Rwanda (1) Senegal (1) Sierra Leone (1) South Africa (1) Swaziland (1)
Tanzania (1) Togo (1) Uganda (1) Zambia (1)
References
Alm, James, and Abel Embaye (2013) ‘Using dynamic panel methods to estimate shadow economies around the world, 1984–2006.’Public Finance Review41(5), 510–543
Breen, Michael, and Robert Gillanders (2012) ‘Corruption, institutions and regulation.’
Economics of Governance13(3), 263–285
Buehn, Andreas (2012) ‘The shadow economy in german regions: an empirical assessment.’
German Economic Review13(3), 275–290
Buehn, Andreas, and Friedrich Schneider (2012) ‘Corruption and the shadow economy: like oil and vinegar, like water and fire?’ International Tax and Public Finance19(1), 172–194 Choi, Jay Pil, and Marcel Thum (2005) ‘Corruption and the shadow economy.’International
Economic Review46(3), 817–836
Donchev, Dilyan, and Gergely Ujhelyi (2014) ‘What do corruption indices measure?’ Eco-nomics & Politics26(2), 309–331
Dreher, Axel, and Friedrich Schneider (2010) ‘Corruption and the shadow economy: an empirical analysis.’Public Choice144(1-2), 215–238
Dreher, Axel, Christos Kotsogiannis, and Steve McCorriston (2009) ‘How do institutions affect corruption and the shadow economy?’ International Tax and Public Finance
16(6), 773–796
Dreher, Axel, Pierre-Guillaume M´eon, and Friedrich Schneider (2014) ‘The devil is in the shadow. do institutions affect income and productivity or only official income and official productivity?’ Public Choice 158(1-2), 121–141
Elgin, Ceyhun, and O˘guz ¨Oztunali (2012) ‘Shadow economies around the world: model based estimates.’ Working Papers 5, Bogazici University Department of Economics Fan, C Simon, Chen Lin, and Daniel Treisman (2009) ‘Political decentralization and
corrup-tion: Evidence from around the world.’Journal of Public Economics93(1), 14–34 Friedman, Eric, Simon Johnson, Daniel Kaufmann, and Pablo Zoido-Lobaton (2000)
‘Dodg-ing the grabb‘Dodg-ing hand: the determinants of unofficial activity in 69 countries.’Journal of public economics76(3), 459–493
G¨erxhani, Klarita (2004) ‘The informal sector in developed and less developed countries: a literature survey.’Public Choice120(3-4), 267–300
Gillanders, Robert (2014) ‘Corruption and infrastructure at the country and regional level.’
Gillanders, Robert, and Sinikka Parviainen (2014) ‘Experts perceptions versus firms experi-ences of corruption and foreign direct investment.’ Discussion Papers 384, Helsinki Center of Economic Research
Goel, Rajeev K, and James W Saunoris (2014) ‘Global corruption and the shadow economy: spatial aspects.’Public Choice161(1-2), 119–139
Golden, Miriam A, and Lucio Picci (2005) ‘Proposal for a new measure of corruption, illus-trated with italian data.’Economics & Politics17(1), 37–75
Gupta, S., H. Davoodi, and R. Alonso-Terme (2002) ‘Does corruption affect income inequal-ity and poverty?’ Economics of Governance 3(1), 23–45
Hibbs, Douglas A Jr, and Violeta Piculescu (2005) ‘Institutions, corruption and tax evasion in the unofficial economy.’ Discussion Papers, G¨oteburg University
Hindriks, Jean, Michael Keen, and Abhinay Muthoo (1999) ‘Corruption, extortion and eva-sion.’Journal of Public Economics74(3), 395–430
Johnson, Simon, Daniel Kaufman, and Andrei Shleifer (1997) ‘The unofficial economy in transition.’Brookings Papers on Economic Activity28(2), 159–240
Johnson, Simon, Daniel Kaufmann, and Pablo Zoido-Lobaton (1999) ‘Corruption, public finances, and the unofficial economy.’ Policy Research Working Paper Series 2169, The World Bank, August
Johnson, Simon, Daniel Kaufmann, John McMillan, and Christopher Woodruff (2000) ‘Why do firms hide? bribes and unofficial activity after communism.’ Journal of Public Eco-nomics76(3), 495–520
Kenny, Charles (2009) ‘Measuring corruption in infrastructure: Evidence from transition and developing countries.’The Journal of Development Studies45(3), 314–332
Knack, Stephen (2007) ‘Measuring corruption: A critique of indicators in eastern europe and central asia.’Journal of Public Policy27(03), 255–291
Lassen, David Dreyer (2007) ‘Ethnic divisions, trust, and the size of the informal sector.’
Journal of Economic Behavior & Organization63(3), 423–438
Liu, Yongzheng, and Haibo Feng (2015) ‘Tax structure and corruption: cross-country evi-dence.’Public Choice162(1), 57–78
Razafindrakoto, Mireille, and Fran¸cois Roubaud (2010) ‘Are international databases on cor-ruption reliable? a comparison of expert opinion surveys and household surveys in sub-saharan africa.’World development 38(8), 1057–1069
Reinikka, Ritva, and Jakob Svensson (2006) ‘Using micro-surveys to measure and explain corruption.’World Development 34(2), 359–370
Schneider, Friedrich (2005) ‘Shadow economies around the world: what do we really know?’
European Journal of Political Economy21(3), 598–642
Schneider, Friedrich, and Dominik H Enste (2000) ‘Shadow economies: Size, causes, and consequences.’Journal of Economic Literature38(1), 77–114
Schneider, Friedrich, Andreas Buehn, and Claudio E Montenegro (2010) ‘New estimates for the shadow economies all over the world.’International Economic Journal24(4), 443–461 Svensson, Jakob (2003) ‘Who must pay bribes and how much? evidence from a cross section
of firms.’The Quarterly Journal of Economics118(1), pp. 207–230
(2005) ‘Eight questions about corruption.’ The Journal of Economic Perspectives
19(3), 19–42
Tafenau, Egle, Helmut Herwartz, and Friedrich Schneider (2010) ‘Regional estimates of the shadow economy in europe.’International Economic Journal24(4), 629–636
Torgler, Benno, and Friedrich Schneider (2009) ‘The impact of tax morale and institutional quality on the shadow economy.’Journal of Economic Psychology30(2), 228–245
Torgler, Benno, Friedrich Schneider, and Christoph A Schaltegger (2010) ‘Local autonomy, tax morale, and the shadow economy.’Public Choice 144(1-2), 293–321
Treisman, Daniel (2007) ‘What have we learned about the causes of corruption from ten years of cross-national empirical research?’ Annu. Rev. Polit. Sci.10, 211–244