Raman and Infrared Spectroscopic Studies on Li
4RuH
6Combined
with First-Principles Calculations
Toyoto Sato
1,+, Shigeyuki Takagi
1, Motoaki Matsuo
1, Katsutoshi Aoki
1,
Stefano Deledda
2, Bjørn C. Hauback
2and Shin-ichi Orimo
31Institute for Materials Research, Tohoku University, Sendai 980-8577, Japan
2Physics Department, Institute for Energy Technology, P. O. Box 40, Kjeller NO-2027, Norway 3WPI-Advanced Institute for Materials Research, Tohoku University, Sendai 980-8577, Japan
We have studied the vibrational properties of Li4RuH6, consisting of the lightest Li+metal cation, and the octahedral [RuH6]4¹complex
anion by Raman and Fourier Transform Infrared (FTIR) spectroscopies andfirst-principles calculations. The Li+forms a cubic framework with the [RuH6]4¹inside as the local atomic arrangement of Li4RuH6, which is similar to that of a relatedMA2RuH6with a divalent metal cationMB
(MB=Mg, Ca, Sr, Ba, and Yb). Comparing the vibrational studies on Li4RuH6withMB2RuH6, the peak frequencies for the antisymmetric RuH
stretching mode (¯anti-str) showed a reasonable relationship with the RuH bond distances (dRuH) in [RuH6]4¹, with higher peak frequencies for
shorter bond distances according to the linear relation¯anti-str=10052¹4990©(dRuH). [doi:10.2320/matertrans.MG201403]
(Received February 3, 2014; Accepted March 24, 2014; Published May 2, 2014)
Keywords: hydrogen storage, complex hydride, Raman and infrared spectroscopies,first-principles calculations
1. Introduction
Transition metal elements T belonging to group 8 in the periodic table, i.e., Fe, Ru, and Os, are known to primarily form octahedral [TH6]4¹ complex anions with hydrogen.
These complex anions ionically bond with metal cationMn+ (n=1, 2: valence of a metal cation, M) to form a T-based complex hydrideM4(TH6)n.14)Among metal cations, Li+is particularly interesting due to the its mass, which is the lowest of all metals. Because of this, the complex hydride Li4TH6has a higher gravimetric hydrogen density than other
alkali metals. Recently, novel Li4FeH6 (6.7 mass%) was
synthesized by hydrogenation of a mixture of LiH and Fe powders at high temperatures and high pressures, on the basis of the theoretical prediction offirst-principles calculations.5,6) Thus, owing to the high hydrogen density, Li4TH6 has
potential as a hydrogen storage material.
From X-ray and neutron diffraction and first-principles calculations, the crystal structure of Li4TH6 has been
elucidated to have a trigonal K4CdCl6-type structure in the
space group R3c(No. 167) andZ=6 (Fig. 1).57)The unit
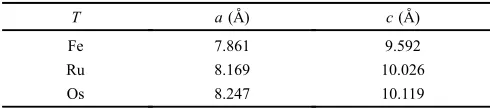
cell parameters are summarized in Table 1. Transition metals Tare octahedrally coordinated by six hydrogen atoms to form an octahedral [TH6]4¹complex anion withT-H distances of
1.61, 1.71, and 1.71¡for T=Fe, Ru and Os, respectively. The local atomic arrangement can be described by Li atoms with two crystallographically different sites (Li1 and Li2) forming a slightly distorted cube containing [TH6]4¹inside.
Each cube is linked by corner-sharing (Li atoms), with the Li1 atoms in thec-direction and the Li2 atoms perpendicular to the c-direction. Interestingly, the local atomic arrangements within the framework of Li atoms containing each [TH6]4¹
are similar to the related compound MB2TH6(MB=divalent
metal cation), in spite of the different crystal structure for MB2TH6(face-centered cubic K2PtCl6-type structure).1,2)Each
cube inMB2TH6is connected by edge-sharing.
In addition to the knowledge about the crystal structure the vibrational properties, i.e., atomic vibrations, of Li4TH6
provide important information on the hydrogen-related vibrations especially in [TH6]4¹. Furthermore this could also
contribute to understanding of important material properties, e.g., hydrogen release reaction, as reported for the Al-based complex hydride LiAlH4, where broadening and softening
of librational modes of [AlH4]¹ and shortened Li+-[AlH4]¹
Fig. 1 Crystal structure of Li4TH6. Li1, Li2,T, and H atoms are displayed
as black, gray, white, and small black circles, respectively. The [TH6]4¹
[image:1.595.310.541.329.506.2]complex anions and Li frameworks are drawn as octahedra and cubes, respectively. The Li cube is slightly distorted and linked to adjacent cubes by corner-sharing.5,7)
Table 1 Unit cell parameters for Li4TH6.5,7)The unit cell parameters for
Li4FeH6were obtained from the theoretical values.5)
T a(¡) c(¡)
Fe 7.861 9.592
Ru 8.169 10.026
Os 8.247 10.119
+Corresponding author, E-mail: toyoto@imr.tohoku.ac.jp
Special Issue on Advanced Materials for Hydrogen Energy Applications II
[image:1.595.304.549.603.657.2]distances were observed before hydrogen release.8,9)
How-ever, to the best of our knowledge, atomic vibrations in Li4TH6 have not been studied.
Therefore, in this study, we have measured Raman scattering and Fourier Transform Infrared (FTIR) absorption spectra for Li4RuH6, and made mode assignments for the
observed vibrational peaks with the help of first-principles calculations. Li4RuH6 has the same crystal structure as
Li4FeH6and Li4OsH6, and thus their vibrational spectral data
is expected to provide insight into the T-H vibration in [TH6]4¹. Li4RuH6, which is thermodynamically more stable
than Li4FeH6 and contains the transition metal element
Ru, lighter than Os, can be synthesized under moderate conditions (hydrogen pressure:<1 MPa; temperature:
<800 K).7) We will discuss the relationship between peak
frequencies of the antisymmetric RuH stretching modes and RuH bond distances for Li4RuH6, and derive a general trend
using a series of Ru-based complex hydrides MB2RuH6
(MB=Mg, Ca, Sr, Ba, and Yb)1016) with the similar local
atomic arrangements.
2. Experimental and Calculation Procedures
2.1 Synthesis
Li4RuH6 was synthesized from mechanochemical milling
of LiH (Alfa Aesar, 99.4%) and Ru (Kojundo Chemical Laboratory Co., Ltd., 99.9%) with a molar ratio of4 : 1and subsequent heat treatment under hydrogen gas at 1 MPa at 753 K for 12 h.
2.2 Characterizations
The morphology and the crystal structure of the synthe-sized samples were characterized by scanning electron microscopy (JEOL JSM-6009, 15 kV) and X-ray powder diffraction (PANalytical X’PERT diffractometer) using Cu K¡ radiation (=1.5406¡ for K¡1 and 1.5444¡ for
K¡2). In order to estimate the quality of the Li4RuH6sample,
Rietveld refinement on the X-ray diffraction pattern was performed using GSAS17) with the graphical interface EXPGUI (version 1.80).18) In the Rietveld analysis, the pseudo-Voigt peak shape function with the FingerCox Jephcoat asymmetry correction19,20)was used.
The vibrational spectra of Li4RuH6 were measured using
Raman (Nicolet Almega-HD with a Nd:YVO4 laser (532
nm)) and FTIR (Thermo Scientific Nicolet iZ10) spectros-copies. For the Raman spectroscopic studies, the sample was placed under Ar gas in a sample holder with a glass window, and spectra were measured using the backscattering confi g-uration with a microscope Raman spectrometer. For the FTIR spectroscopic studies, a thin sample, approximately a few µm thick, was prepared in an Ar-gas-filled diamond anvil cell, and transmission spectra were measured with a microscope FTIR spectrometer.
All samples were handled in an Ar-gas-filled glove box with a dew point below 183 K and with less than 1 ppm of O2
to avoid hydro-oxidation.
2.3 First-principles calculations
The calculations reported here were performed using plane-wave basis sets and the projector augmented-wave
method21,22) within the generalized gradient approximation
(GGA) of Perdew, Burke, and Ernzerhof,23)as implemented
in the Vienna Ab-Initio Simulation Package (VASP).24,25)We first performed the structure optimization starting from the experimentally determined K4CdCl6-type structure7) using
plane-wave basis sets with cutoff energies of 800 and 7200 eV for wavefunction and charge density, respectively, and a 4©4©4 special k-point sampling of the Brillouin zone, which well reproduced the experimental data.7) Subsequently, the¥-point phonon calculation was performed using a 22-atom primitive unit cell of Li4RuH6 with cutoff
energies of 800 and 7200 eV for wavefunction and charge density, respectively, and an 8©8©8 specialk-point mesh.
3. Results and Discussions
3.1 Synthesis
Figure 2 shows X-ray diffraction patterns, scanning electron microscopic images (secondary electron images (SEI) and backscattered electron images (BEI)) of the as-milled and hydrogenated samples. In the X-ray diffraction pattern of the as-milled samples, peaks were mainly identified as originating from Ru. No peaks of LiH were observed due to its low X-ray scattering factor. By contrast, the electron microscope images clearly show texture in the as-milled sample. The BEI shows bright and dark (i.e., no scattering) areas, while the SEI shows the aggregation of particles in the corresponding dark areas. This indicates that the sample is a mixture of heavy (i.e., Ru) and light (i.e., LiH) elements. In the X-ray diffraction pattern of the hydrogenated sample, peaks from Li4RuH6dominate with minor peaks
correspond-ing to unreacted Ru. The SEI and BEI images are also homogeneous, indicating that the as-milled mixture was entirely hydrogenated to form Li4RuH6.
In order to estimate the quality of the Li4RuH6 sample,
Rietveld refinement was performed with the X-ray diffraction data. The previously reported crystal structure of Li4RuD67)
was taken as the starting point for the refinements. Hexagonal Ru, a=2.7087(2)¡ and c=4.2870(5)¡, was added as a second phase in the refinement. The resulting fit shows reasonably good agreement with the experimental data with Rwp=0.0721 (Fig. 3). The final refinement gave 88 mass%
of Li4RuH6, and then dominating in the sample. The
crystallographic parameters for Li4RuH6used in the Rietveld
refinement are listed in Table 2 (see Fig. 1 for the crystal structure). All the atomic positions agree with the previously reported crystal structure.7)The larger unit cell volume of our
Li4RuH6sample (V=580.11¡3) compared to the previously
reported deuteride (V=576.16¡3) is due to the isotope
effect. Our hydride sample was used for the vibrational spectroscopic measurements.
3.2 Vibrational properties
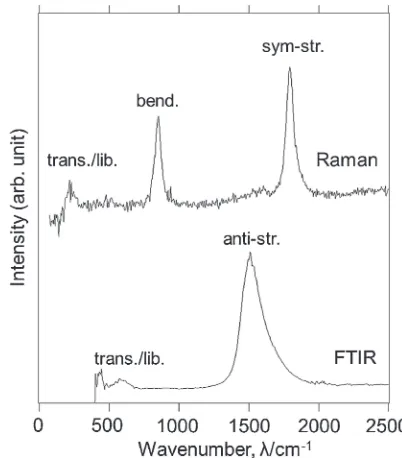
Figure 4 shows the Raman and FTIR spectra of Li4RuH6.
The Raman spectrum shows three peaks at approximately 215, 852, and 1795 cm¹1, whereas the IR spectrum shows
two peaks at approximately 574 and 1527 cm¹1 (peak
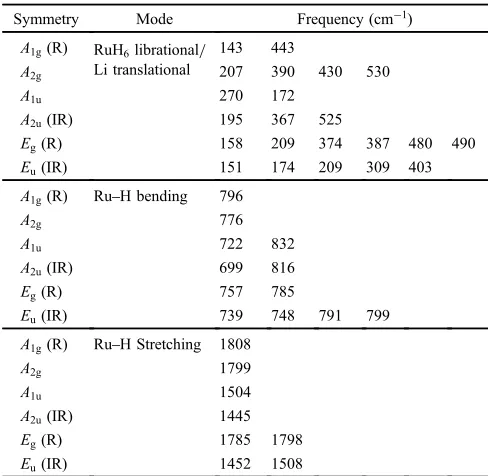
positions are taken from the peak top in each spectrum). We then performed¥-point phonon calculation to assign the experimentally observed vibrational modes. The results are
summarized in Table 3. Since the primitive unit cell of Li4RuH6 consists of 22 atoms, there are in total 63 optical
phonon modes: 22 Raman active modes (4A1gand 9Eg) and
23 IR active modes (5A2u and 9Eu). The calculated phonon
modes are roughly divided into four groups: the Li transla-tional modes and the RuH6 librational modes (trans./lib.)
below 530 cm¹1, the RuH bending modes (bend.) at 699 832 cm¹1, the antisymmetric RuH stretching modes (anti-str.) at 14451508 cm¹1, and the symmetric RuH stretching
modes (sym-str.) at 17851808 cm¹1. Comparison of the
observed peak frequencies and calculated phonon frequencies allows mode assignments of Raman active translational and librational, IR active translational and librational, Raman active bending, IR active antisymmetric stretching, and Raman active symmetric stretching modes at 215, 574, 852, 1527, and 1795 cm¹1, respectively.
Fig. 3 Rietveld refinementfit for Li4RuH6(Rwp=0.0721). The observed,
calculated, and difference between the observed and calculated patterns are indicated by opened circles, gray line, and black line, respectively. Vertical bars indicate the positions of Bragg peaks for Li4RuH6(top) and
[image:3.595.99.499.64.280.2]Ru (bottom).
Table 2 Crystallographic parameters for Li4RuH6 with a=8.1900(2)¡
andc=9.9864(3)¡ (a=8.128¡and c=9.955¡ (calculated)) in the space groupR3c(No. 167) andZ=6. Positions of H atoms andUisoof
all atoms were not refined. The terms in parentheses were obtained from
first-principles calculations.
Atom Wyckoff x y z Uiso(¡2) Occu.
Li1 6a 0 0 0.25 0.01 1.0
(0) (0) (0.25) (1.0)
Li2 18e 0.3741(24) 0 0.25 0.01 1.0
(0.3875) (0) (0.25) (1.0)
Ru 6b 0 0 0 0.01 1.0
(0) (0) (0) (1.0)
H 36f 0.1870 0.0400 0.1000 0.04 1.0
(0.1895) (0.0424) (0.1000) (1.0)
Fig. 2 X-ray diffraction patterns (left) and morphologies (right) with secondary electron images (SEI) and compositional images in the backscattering mode (BEI) for the as-milled (bottom) and hydrogenated (top) samples.
Fig. 4 Observed Raman (top) and FTIR (bottom) spectra for Li4RuH6.
The calculated phonon modes were roughly divided into four groups according to the mode assignment of the observed Raman and FTIR peaks (see text).
[image:3.595.64.281.321.489.2] [image:3.595.323.524.322.551.2] [image:3.595.46.291.620.731.2]To further investigate the antisymmetric stretching modes, we considered the relationship between the peak frequencies of the RuH antisymmetric stretching modes and the RuH bond distances for a series of Ru-based complex hydrides with [RuH6]4¹. According to the reports on Ru-based
complex hydrides with divalent metals,MB2RuH6(MB=Mg,
Ca, Sr, Ba, and Yb),1016) the peak frequencies show a
tendency to increase with decreasing RuH bond distances or the unit cell parameters.814) Since MB2RuH6 and Li4RuH6
adopt different structures (face-centered cubic K2PtCl6-type
and trigonal K4CdCl6-type structure, respectively), we
focused on the comparison between RuH stretching modes and RuH bond distances in [RuH6]4¹ contained in both
Li4RuH6andMB2RuH6.7,1016)
The peak frequencies of the antisymmetric RuH stretch-ing modes (¯anti-str.) are plotted as a function of the RuH
distances (dRuH) in Fig. 5. It is clearly seen that the peak
frequencies decrease with increasing RuH bond distances and, following Badger’s rule,26,27)they can befit well with an
approximate straight line ¯anti-str=10052¹4990©(dRuH).
It should be worth here comparing the local atomic arrangements in the crystal structures of Li4RuH6 and
MA2RuH6. As mentioned above, Li4RuH6 and MB2RuH6 are
commonly built up by similar cubes formed by metal cation frameworks containing [RuH6]4¹; thus their local atomic
arrangements are similar. Therefore, the relationship between
¯anti-str. and dRuH shows qualitatively reasonable tendency
in spite of the different crystal structures of Li4RuH6 and
MB2RuH6. However, the cubes in Li4RuH6 are linked by
corner-sharing, as shown in Fig. 1, and the ones inMB2RuH6
by edge-sharing.1,2) This indicates that Li
4RuH6 has less
interaction between neighboring cubes than MB2RuH6. This
might explain the greater statistical dispersion in the peak frequencies inMB2RuH6.
4. Conclusion
We measured Raman and FTIR spectra for the light-weight alkali metal complex hydride, Li4RuH6, and the mode
assignment of the observed vibrational peaks was made on the basis of the ¥-point phonon calculation. The antisym-metric stretching frequencies of [RuH6]4¹ complex anions
were compiled for Li4RuH6 and MB2RuH6, providing an
approximate linear relation between the frequency and RuH distance expressed by ¯anti-str (cm¹1)=10052¹
4990©dRuH(¡). A similar study of a series of the sister
complex anion [FeH6]4¹complex anions (Li4FeH6, Mg2FeH6
and so on) will provide more general insight into the vibrational properties of complex transition metal hydrides.
Acknowledgments
The authors would like to thank Ms. H. Ohmiya and Ms. N. Warifune for technical supports, and the use of SR16000 supercomputing resources at the Center for Computational Materials Science of the Institute for Materials Research, Tohoku University. This research was supported by the JSPS KAKENHI Grant Numbers 25220911 from MEXT, Japan and Integrated Project of ICC-IMR of Tohoku University, and the Inter-University Cooperative Research Program of the Institute for Materials Research, Tohoku University.
REFERENCES
1) W. Bronger:Angew. Chem. Int. Ed.30(1991) 759768.
2) K. Yvon: CHIMIA52(1998) 613619.
3) M. Matsuo, H. Saitoh, A. Machida, R. Sato, S. Takagi, K. Miwa, T. Watanuki, Y. Katayama and S. Orimo:RSC Adv.3(2013) 10131016.
4) K. Miwa, S. Takagi, M. Matsuo and S. Orimo:J. Phys. Chem. C117
(2013) 80148019.
5) S. Takagi, T. Ikeshoji, T. Sato, K. Aoki and S. Orimo:J. Japan Inst. Met. Mater.77(2013) 604608.
[image:4.595.318.532.67.245.2]6) H. Saitoh, S. Takagi, M. Matsuo, Y. Iijima, N. Endo, K. Aoki and S. Orimo: to be submitted.
Table 3 Optical¥-point phonon frequencies calculated for the 22 atom primitive cell of Li4RuH6. Raman and infrared activities are shown in
parentheses: R=Raman active; IR=infrared active.
Symmetry Mode Frequency (cm¹1)
A1g(R) RuH6librational/
Li translational
143 443
A2g 207 390 430 530
A1u 270 172
A2u(IR) 195 367 525
Eg(R) 158 209 374 387 480 490
Eu(IR) 151 174 209 309 403
A1g(R) RuH bending 796
A2g 776
A1u 722 832
A2u(IR) 699 816
Eg(R) 757 785
Eu(IR) 739 748 791 799
A1g(R) RuH Stretching 1808
A2g 1799
A1u 1504
A2u(IR) 1445
Eg(R) 1785 1798
Eu(IR) 1452 1508
Fig. 5 Antisymmetric stretching frequencies of Li4RuH6(filled circle) and
MB2RuH6(opened circle) plotted as a function of RuH bond distance.
The labels on each point represent the alkaline earth metals MB in MB2RuH6. The average RuH bond distances were determined from the
deuterides.7,10,11)The gray line is a straight linefit of the plot.
[image:4.595.46.290.103.341.2]7) M. Kritikos, D. Noréus and P. Fischer:J. Solid State Chem.92(1991) 514519.
8) K. Tomiyasu, T. Sato, K. Horigane, S. Orimo and K. Yamada:Appl. Phys. Lett.100(2012) 193901.
9) T. Sato, K. Tomiyasu, K. Ikeda, T. Otomo, M. Feygenson, J. Neuefeind, K. Yamada and S. Orimo:J. Alloy. Compd.586(2014) 244247.
10) R. O. Moyer, Jr., C. Stanitski, J. Tanaka, M. I. Kay and R. Kleinberg:
J. Solid State Chem.3(1971) 541549.
11) M. Kritikos and D. Noréus:J. Solid State Chem.93(1991) 256262.
12) H. Hagemann and R. O. Moyer:J. Alloy. Compd.330332(2002) 296.
13) H. Hagemann, V. D’Anna, L. M. Lawson Daku, S. Gomes, G.
Renaudin and K. Yvon:J. Phys. Chem. Solid72(2011) 286.
14) R. O. Moyer, Jr., S. M. Antao, B. H. Toby, F. G. Morin and D. F. R. Gilson:J. Alloy. Compd.460(2008) 138141.
15) M. M. Barsan, I. S. Butler, D. F. R. Gilson, R. O. Moyer, Jr., W. Zhou, H. Wu and T. J. Udovic:J. Phys. Chem. A112(2008) 69366938.
16) R. O. Moyer, Jr., D. F. R. Gilson and B. H. Toby:J. Solid State Chem.
184(2011) 18951898.
17) A. C. Larson and R. B. von Dreele: Los Alamos National Laboratory Report, LAUR86-749.
18) B. H. Toby:J. Appl. Crystallogr.34(2001) 210213.
19) B. van Laar and W. B. Yelon:J. Appl. Crystallogr.17(1984) 4754.
20) P. Thompson, D. E. Cox and J. B. Hastings:J. Appl. Crystallogr.20
(1987) 7983.
21) P. E. Blöchl:Phys. Rev. B50(1994) 17953.
22) G. Kresse and D. Joubert:Phys. Rev. B59(1999) 1758.
23) J. P. Perdew, K. Burke and M. Ernzerhof:Phys. Rev. Lett.77(1996) 3865.
24) G. Kresse and J. Hafner:Phys. Rev. B47(1993) 558.
25) G. Kresse and J. Furthmüller:Phys. Rev. B54(1996) 11169.
26) R. M. Badger:J. Chem. Phys.3(1935) 710714.
27) J. Cioslowski, G. Liu and R. A. M. Castro:Chem. Phys. Lett.331
(2000) 497501.