2School of Materials Science and Engineering, Northwestern Polytechnical University, Xi’an 710072, China 3China North Vehicle Research Institute, Beijing 100071, China
The formation mechanism of the high angle boundaries in drawn single crystal copper wires was investigated using electron backscattering diffraction. Two stages for formation of high angle boundaries were found: at low strains, the high angle boundaries correspond to the boundaries between differentfiber texture components referred to the drawn direction of wires while the high angle boundaries start to present within onefiber texture at high strains. The critical strain for the two-stage transformation depends on the initial orientations parallel to axis direction of single crystal wires. Such difference in formation of high angle boundaries with increasing strain is associated with the deformation homogeneity. [doi:10.2320/matertrans.M2014458]
(Received December 18, 2014; Accepted April 13, 2015; Published June 5, 2015)
Keywords: single crystal copper, cold drawn, high-angle boundaries, microstructure, textures
1. Introduction
In the past two decades, deformation microstructure of face-centered cubic (FCC) metals with medium to high stacking fault energy has been extensively investigated to understand their properties.14) One of the most commonly recognized features is the subdivision of the original grains into subgrains separated via the dislocation boundaries generated during the plastic deformation. Furthermore, part of those newly formed boundaries are high angle boundaries (HABs). The generation of new HABs is attributed to two major mechanisms:5)microstructure and texture. The HABs
formed via microstructural mechanism include dense dis-location walls (DDWs) and/or micro-bands (MBs). The misorientation angles across DDWs/MBs increase with increasing strain. Such HABs have misorientation angles in the range of 1530°. The texture mechanism involves grain subdivision via cell blocks and the rotation of the subdivided subgrains to different preferred textures during deformation. Such HABs correspond to the boundaries between different texture components and show a wider range of misorientation angles (20° to 60°).
The above framework of HAB formation proposed by Hughes and Hansen is based on the studies of cold rolling and torsion,5) and is supported by the recent studies on hot
torsion6) and equal channel angular extrusion.7) In those
studies, the texture component is described by (uvw)[hkl]. For cold rolling, (uvw) is the rolling plane and [hkl] represents the rolling direction. When the orientation of one crystal is more than the critical deviation of 15° away from an ideal texture component (uvw)[hkl], the crystal could be considered as another texture component. It is, thus, reasonable to conclude that the misorientation of HABs within one texture component is less than 30° and that the HABs with larger misorientation angles correspond to the boundaries between different texture components. For cold-drawn wires, however, the texture component is not usually described by (uvw)[hkl] but [rst] (where [rst] is closely
parallel to the drawn direction of wires), which will lead to that the crystal orientation could not be uniquely determined. For example, when the crystallographic direction [rst] is parallel to the axis direction (drawn direction) of wires, there is still a possibility that a significant orientation difference occurs along radial direction of the wire. This brings about a question: does the HAB formation mechanism during the cold drawing process still follow the above framework if the texture component is described by [rst]? In the present paper, therefore, the formation of HABs in the drawn copper wires has been analyzed using electron backscattering diffraction (EBSD) technique in order to answer the above question. To authors’knowledge, two stages for HABs formation during cold drawing process have been reported forfirst time.
2. Experimental Procedure
To exclude the influence of grain boundary on the HAB analysis, single crystal copper was used in this study. Single crystal copper rods with a diameter of 8 mm were prepared by seed growth method in a unidirectional solidification equip-ment with a liquid metal of 62%Ga-25%In-13%Sn. Since the single crystals made by the seed growth method were not enough long to be drawn, the end of the single crystal was welded to a commercial polycrystalline copper wire with same size in diameter. The single crystal copper wires were drawn into different diameters at room temperature. The details of the cold drawing process can be found in the literature.8)
Samples for EBSD were polished mechanically, and then electro-polished at 4 V and ¹15°C for 4 min in a solution of 500 mL distilled water, 250 mL HPO3, 250 mL ethanol,
50 mL propanal, and 5 g carbamide. EBSD analysis was performed in an FEI Quanta-400F thermal FEG scanning electron microscope operating at 20 kV using an Oxford
Instruments HKL NordlysF+ camera with a working
microscopy (TEM) were electropolished. TEM analysis was carried out on a JEM 2010 with an acceleration voltage of 200 kV. The drawn direction of wires was made coincident with the longitudinal axis of the double-tilt specimen holder.
3. Results and Discussion
3.1 Texture and microstructure
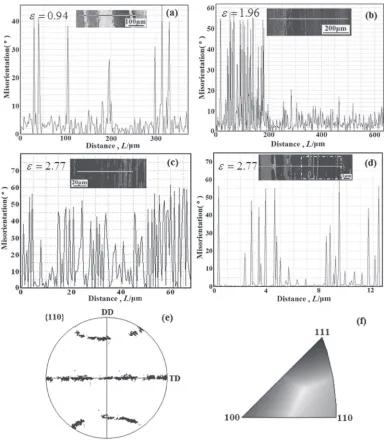
The orientation maps of the drawn single crystal copper wire with initial orientation of©110ª are shown in Fig. 1. In orientation maps, the crystal directions indicated by color are parallel to the drawn direction of the wires (i.e., the vertical direction of the orientation maps) and ¾ denotes the strain of the wires. For drawn FCC metals,©111ªand©100ªparallel
to the drawn direction are considered as preferred final
orientations.911)Therefore, the initial orientation of©110ªis
expected to be unstable. At a strain of 0.96, grain subdivision takes place and the deformation bands with the drawn direction deviated from ©110ª can be observed (Fig. 1(a)).
When the strains are larger than 1.96, the double fiber
textures consisting of ©111ª and ©100ª are well developed (Fig. 1(b) and 1(c)).
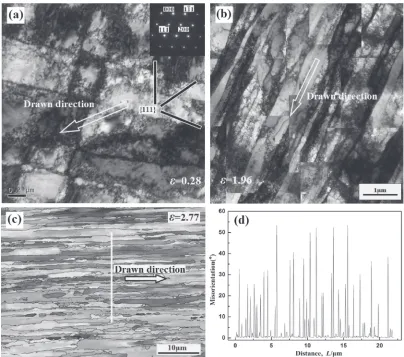
Figure 2 shows the microstructure of the drawn ©110ª
single crystal copper wires with different strains. In Fig. 2(c), the crystal directions indicated by color are parallel to the radial direction of the wire. From Fig. 2, it can be found that the microstructure evolution of the drawn©110ªsingle crystal copper wires is similar to the previous results of polycrystal-line copper on cold rolling and torsion.57)At low strains, two types of extended planar boundaries not parallel to the drawn direction can be observed and the deviation of the extended planar boundaries from {111}is more than 5°, as shown in
[image:2.595.106.490.68.508.2]Fig. 2(a), indicating the extended planar boundaries are of non-crystalline character. With strain increasing, the devia-tion of extended planar boundaries from the drawn direcdevia-tion decreases. When the strains are higher than 1.96, most of extended planar boundaries produced by deformation are parallel to the drawn direction and lamellar boundaries (LBs) start to form (Fig. 2(b) and 2(c)). Measurement of LBs spacing along the direction perpendicular to LBs shows that the mean spacing of LBs is about 0.34 µm at a strain of 2.77 (Fig. 2(d)).
3.2 Misorientation angle between dislocation bounda-ries
EBSD data can also be used to calculate the misorientation angle distribution of boundaries resulting from deformation in drawn©110ªsingle copper wires with different strains, as shown in Fig. 3. Because orientation noise of EBSD is usually lower than 1°, a misorientation angle threshold of 1.5° was used during calculating the misorientation angles between dislocation boundaries. The results in Fig. 3 indicate that at a strain of 0.94, most of the dislocation boundaries have misorientation angle of<15° and there is only one peak in a range lower than 5°. When the strain is increased to 1.96, a bimodal distribution of misorientation angles can be observed: one is in the range lower than 5° and the other is
higher than 50° (Fig. 3(b)). From Fig. 3(b)(c), it can be found that the bimodal distribution becomes more evident with strain increasing.
To investigate the HAB formation mechanism of the drawn
©110ª single crystal, the misorientation of adjacent points
along the horizontal lines in the orientation maps was analyzed (Fig. 1). With strain increasing, a two-stage of HAB formation is observed. When strains are less than 2.77, the
misorientation angle within one fiber texture component
is less than 15° and HABs correspond to the boundaries between different fiber texture components (Fig. 1(a)(b)). These are in agreement with the framework proposed by Hughes and Hansen.7)This indicates that crystallites such as
cell blocks formed by different active slip systems rotate towards different final fiber texture components (e.g. ©111ª
and ©100ª) or towards same stablefiber texture components
but at different rates, thus resulting in the HAB formation in the drawn copper wires with low strains. However, when the strain is increased to more than 2.77, a large number of HABs with misorientation angle of more than 30° can be observed within one fiber texture component (Fig. 1(c)), which does not follow the framework by Hughes and Hansen. It should be mentioned that in order to obtain statistical results, a step size of 0.8 µm, which is larger than the mean spacing of LBs (0.34 µm), was used to collect the EBSD data of Fig. 1(c).
[image:3.595.96.500.68.425.2]This could lead to that the high misorientation angle within one fiber texture component may not correspond to the boundary between adjacent cell blocks. Thus, a smaller step size of 30 nm was used to collect EBSD data, as shown in Fig. 1(d). From Fig. 1(d), it can be found that the HABs with misorientation angle of more than 30° are still visible within
©111ª or ©100ª fiber texture component, which is similar to
the result in Fig. 1(c). Figure 1(e) is the {110} polefigure calculated from the data of the region denoted by white dash lines in Fig. 1(d), indicating that significant rotation of subgrains along the drawn direction of wires is observed within one fiber texture component.
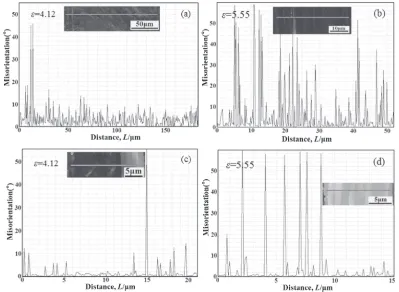
Figure 4 shows misorientation distributions along the horizontal lines in the orientation maps for the drawn©100ª and ©111ªsingle crystals. A two-stage for HAB formation is also observed. At strains of less than 5.55, the HABs
correspond to boundaries between different fiber texture
components referred to the drawn direction of wires, whereas
the HABs present within one fiber texture component at
strains of more than 5.55. However, the critical strain (where HABs start to present within onefiber texture component) for the samples with initial orientations of ©100ª and ©111ª is higher than for the sample with initial orientation of ©110ª (5.55 vs. 2.77), which may be associated with the difference in stability of these initial orientations.8)
3.3 Effect of deformation homogeneity on HAB for-mation
The above results has clearly shown that during cold drawing the HAB formation could be classified into two stages: at low strains, the HABs correspond to the boundaries between different fiber texture components referred to the drawn direction of wires; whereas the HABs present within onefiber texture component at high strains. The critical strain for the two-stage transformation depends on the initial orientations of single crystals.
[image:4.595.107.490.70.178.2] [image:4.595.99.498.222.514.2]Some studies on cold rolling12,13) have demonstrated that
the deformation homogeneity affects the crystal rotation axes. For example, inhomogeneous deformation brings about significant crystal rotation in the three directions (e.g. transverse, normal, and rolling), whereas crystal rotation mainly occurs in the transverse direction under homogeneous deformation. As mentioned in the introduction, the texture component of cold rolling is commonly described by (uvw)[hkl]. When the orientation of one crystal is more than the critical deviation of 15° away from an ideal texture component (uvw)[hkl], the crystal can be considered as another texture component. Regardless inhomogeneous or homogeneous deformation, therefore, the misorientation of HABs within one texture component is less than 30° and the HABs with larger misorientation angles correspond to the boundaries between different texture components. However, if the texture component of cold rolling samples is not described by (uvw)[hkl] but [rst] (where [rst] is closely parallel to the transverse direction of cold rolling samples), the difference in HAB formation between inhomogeneous or homogeneous deformation might be observed. Under in-homogeneous deformation, significant crystal rotations in the three directions of rolling samples mean that the HABs would correspond to the boundaries between different fiber texture components referred to the transverse direction. However,
homogeneous deformation only brings about significant
crystal rotation in the transverse direction, which means that
the HABs may appear within one fiber texture component
referred to the transverse direction. Therefore, it is possible that two stages for HAB formation could also be observed in the cold rolling materials when inhomogeneous and homo-geneous deformations take places as two stages during cold rolling process and [rst] is used to describe the texture component for the cold rolling materials.
For cold-drawn wires, deformation geometry and friction between wire and die bring about non-uniform distribution of shear strain along the radial direction of the wire and the shear strain usually increases with the distance from the
center of wires.8,12,13) However, work hardening would
decrease heterogeneity of strain.13,14) This could promote
the homogeneous deformation region to spread to the surface of wire from the center with strain increasing.8)Therefore, it
might be reasonable that the deformation for whole wire except for close to the surface could be homogeneous at a
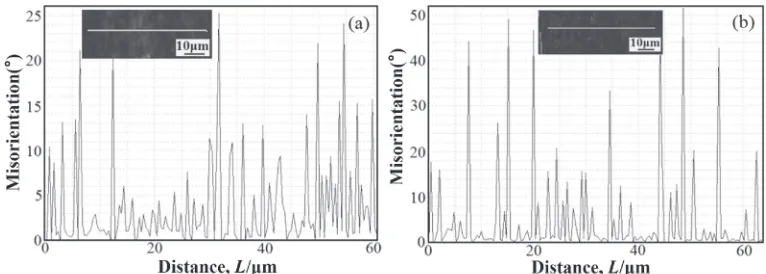
critical strain for the drawn wire. In order to reveal the effect of deformation homogeneity on HAB formation, a distribu-tion of misorientadistribu-tion angle at close to the surface and at the center of the drawn©110ªsingle crystal copper with a strain of 2.77 (which is the critical strain of the two stages of HAB formation) is illustrated in Fig. 5. Misorientation difference between close to the surface and the centre is found: at close to the surface the misorientation angle of HABs is less than 25° within one fiber texture component whereas up to more than 50° at the center. Therefore, it could be considered that the occurrence of two stages for HAB formation of drawn copper wires is related to the change in deformation homogeneity with strain increasing.
4. Conclusions
In the present study, the formation mechanism of HABs in drawn single crystal copper wires has been investigated. The two stages for the HAB formation was observed during cold drawing process, which is attributed to the change in the deformation homogeneity with increasing strains. At low strains, the HABs correspond to the boundaries between different fiber textures components referred to the drawn direction of wires. However, at high strains, the HABs also present within onefiber texture component. The critical strain for the two-stage transformation depends on the initial orientations of single crystals.
Acknowledgments
The authors are grateful for the financial support of the National Natural Science Foundation of China (51171135 and 51371132), Key Science and Technology Program of Shaanxi Province (2012K07-08 and 2013KJXX-61), and Education Department Foundation of Shaanxi Province (2013JC14).
REFERENCES
1) K. Kashihara, Y. Tsujimoto, D. Terada and N. Tsuji:Mater. Charact.75 (2013) 129137.
2) J. Chen, X. G. Ma, W. Yan, F. Xia and X. H. Fan: J. Mater. Sci. Technol.30(2014) 185191.
3) K. Hanazaki, N. Shigeiri and N. Tsuji:Mater. Sci. Eng. A527(2010) 56995707.
[image:5.595.106.489.69.206.2]