Munich Personal RePEc Archive
On the dynamic effects of foreign aid on
corruption
Asongu, Simplice
January 2015
Online at
https://mpra.ub.uni-muenchen.de/67852/
1
AFRICAN GOVERNANCE AND DEVELOPMENT
INSTITUTE
A G D I Working Paper
WP/15/015
On the dynamic effects of foreign aid on corruption
Simplice A. Asongu
African Governance and Development Institute, Yaoundé, Cameroon.
2 © 2015 African Governance and Development Institute WP/15/015
AGDI Working Paper
Research Department
On the dynamic effects of foreign aid on corruption
Simplice A. Asongu1
January 2015
Abstract
We assemble more pieces on the puzzle of the aid-corruption nexus. In essence, we
extend the debate on the effect of foreign aid on corruption by providing evidence on dynamic
effects of wealth, legal origin, religious-domination, regional proximity, openness to sea,
natural resources and politico-economic stability. The empirical evidence from dynamic panel
GMM estimation is based on 53 African countries for the period 1996-2010. The findings
show that the positive effect of foreign aid on corruption is most significant in:
Middle-income, French civil-law, Christian-dominated, non-oil exporting and landlocked countries.
Moreover, there is also some scanty evidence of foreign aid increasing corruption-control in
Lower Middle income and Not-landlocked countries. Justifications for the dynamics are
discussed.
JEL Classification: B20; F35; F50; O10; O55
Keywords: Foreign Aid; Political Economy; Development; Africa
1. Introduction
The recent debate on the effect of foreign aid on corruption has had an important
influence in academic and policy circles (Okada & Samreth, 2012; Asongu, 2012a, 2013a;
Asongu & Jellal, 2013). Policy implications from the debate in its current state are based on
blanket recommendations across countries. However, it has recently been documented that
fundamental characteristics of corruption substantially affect the modeling of corruption
1
3
(Kodila-Tedika, 2012, 2013; Asongu, 2014a; Jellal & Bouzahzah, 2012; Musila, 2013;
Ndikumana & Boyce, 2011; Hollyer & Wantchekon, 2012). In light of the above, this note
assembles more pieces on the puzzle by providing dynamic assessments in terms of: the
wealth of nations, legal origins, religious-domination, regional proximity, openness to sea,
natural resources and politico-economic stability (Knack & Keefer, 1995; Knack, 2001)2. The
weight of these fundamental characteristics is important for more focused policy implications.
Consistent with Asongu & Jellal (2013), the puzzle can be discussed in three main
strands. In the first strand, Asongu (2012a) has responded to the findings of Okada & Samreth
(O & S) by partially negating their criticism of the mainstream approach to the
aid-development nexus. The empirical evidence of O & S (2012) which is based on a sample of
120 developing countries for the period 1995-2009 concludes that development assistance
mitigates corruption and its mitigating effect is greater in less corrupt countries. Asongu
(2012a) on his side has concluded that the findings of O & S may not be relevant for African
countries because foreign aid stifles (inflames) corruption-control (corruption). These
contradictory findings are based on 52 African countries for the period 1996-2010.
The second strand is based on comments from policy-making and academic circles
that have informally criticized Asongu (2012a) for neglecting the conditional element on
which the O & S policy recommendations are based (“…reduces corruption especially and its
reduction effect is greater in less corrupt countries” p.1). In response to the growing
criticisms, Asongu (2013a) has updated his account of the debate by: extending the realm of
the puzzle from corruption to eight good governance indicators and fully considering the
methodological underpinnings of O & S. Accordingly, the hypotheses underlying the
empirical strategy is that the effect of aid maybe contingent on existing levels of institutional
development such that countries with initially high levels of institutional quality respond
differently to their counterparts with lower levels. When the O & S hypothesis on institutional
benchmarks of development assistance are fully taken into account in the estimation strategy,
the negative effect of foreign aid on institutional quality is overwhelmingly validated in 53
African countries for the period 1996-2010 (Asongu, 2013a). These findings have been
subsequently confirmed in recent literature of the same scope and empirical strategy (Asongu,
2013b, c).
The third strand is motivated by some scholars that have informally criticized the
debate for not taking into account investment and fiscal policy channels. Consistent with
2
4
Asongu & Jellal (2013), the debate had remained within the findings of Fielding et al. (2006)
on the straight forward relationship between development assistance and economic prosperity.
Hence, drawing from the recommendations of Knack & Keefer (1995) on the need for more
indicators in the assessment of institutions, Asongu & Jellal have extended the debate by
providing an indirect dimension via modeling with transmission channels. The empirical
evidence which is based on 53 African countries for the period 1996-2010 provides two main
findings: while development assistance channeled via government expenditure increases
corruption, foreign aid channeled via tax effort mitigates the scourge.
The present note focuses on the fourth strand of the debate that has arisen from
informal criticisms by some researchers in policy-making and academic circles. According to
them, the aid-corruption nexus is a complex and multidimensional relationship. Hence, the
focus of the debate in Africa has to incorporate the heterogeneous nature of the continent,
notably: wealth-effects (income-levels), colonial legacy (legal-origins), landlocked nature
(openness to sea), natural resources (petroleum exporting countries for instance), regional proximity…etc. This note aims to extend the debate by taking the above points into account for more focused policy implications. The rest of the note is organized as follows. Section 2
discusses the data and outlines the methodology. Section 3 covers the empirical analysis and
corresponding discussion. We conclude with Section 4.
2. Data and Methodology
Consistent with the literature underpinning of the debate, we examine a panel of 53
African countries with data from the World Bank indicators for the period 1996-2010.
Restricting the sample to this periodicity and focusing on African countries are in accordance
with the papers underlying the debate3. The dependent variables are the corruption perception
index (CPI) and corruption-control index (Asongu, 2012a, 2013a; Okada & Samreth, 2012;
Asongu & Jellal, 2013). The main independent variables are Total Net Official Development
Assistance (NODA), NODA from Multilateral Donors (MD), and NODA from the
Development Assistance Committee (DAC) countries. While the first is used in the
estimations, the last-two are used for robustness purposes to assess the consistency of the
findings. We use government expenditure and public investment as control variables, in line
with the foreign aid literature. Accordingly, the theoretical and empirical underpinnings of the
3
5
investment and fiscal behavior mechanisms have been substantially covered in the literature
(Rostow, 1960; Chenery & Strout, 1966; Mosley et al., 1992; Boone, 1996; Addison et al.,
2005; Reichel, 1995; Gomane et al., 2003; Larrain & Tavares, 2004; Mosley et al., 2004 ;
Easterly, 2005; Bird, 2007; Baliamoune-Lutz & Ndikumana, 2008; Benedek et al., 2012;
Morrissey, 2012).
Details about the variable definitions (with corresponding sources), correlation
analysis and summary statistics can be provided upon request. The summary statistics shows
that there is quite a degree of variation in the data such that significant estimated nexuses
would emerge. The purpose of the correlation matrix is to avoid concerns of multicollinearity
and overparametization.
For brevity and lack of space, we do not expatiate on the determination of fundamental
characteristics which have been substantially covered in the literature (Weeks, 2012; Asongu,
2014bcd; La Porta et al., 1998, 1999, 2008, p. 289; Asongu, 2012b, p. 191; Arvis et al., 2007;
CIA, 2011; Boyce & Ndikumana, 2008).
In order to control for endogeneity, the estimation strategy adopted is a dynamic panel
estimation technique. Consistent with recent literature, there are some appealing features and
one principal draw-back in using this estimation strategy (Demirgüç-Kunt & Levine, 2008;
Asongu, 2013d). On the downside, the use of short-term time spans with data-averages
implies that the findings should be interpreted as short-term impacts and not long-run effects.
However, this setback is not a relevant concern for the present paper because data-averages
are not employed. Accordingly, one of the prime conditions for adopting the Generalized
Methods of Moments (GMM) is not violated: N>T (53>15). With regard to the advantages,
the principal arguments raised for the adoption of dynamic system GMM are: it mitigates
potential biases of the difference estimator in small samples; it controls for the potential
endogeneity in all the regressors; and it does not eliminate cross-country variation (Asongu,
2013e).
Between the existing GMM approaches (Difference and System estimator) the
empirical strategy adopted is the system GMM estimation (Arellano & Bover, 1995; Blundell
& Bond, 1998) instead of the difference GMM estimator (Arellano & Bond, 1991), in
accordance with Bond et al. (2001, pp. 3-4). In modeling the GMM, we prefer the two-step
option to the one-step because it accounts for heteroscedasticity. In the one-step approach, the
6 3. Empirical results and discussion
3.1 Presentation of results
Tables 1-2 below present the empirical findings. While Table 1 reports results on
wealth (income-levels), colonial legacy (legal origin) and religious domination, Table 2 shows
findings on regional proximity, natural resources, political stability and openness to sea. For
both tables, the two null hypotheses for the validity of the models and absence of
auto-correlation are overwhelmingly not rejected. Hence, confirming the absence of
autocorrelation and validity of the instruments4. While Panel A of either table investigates the
effects on corruption, Panel B assesses the incidences on corruption-control.
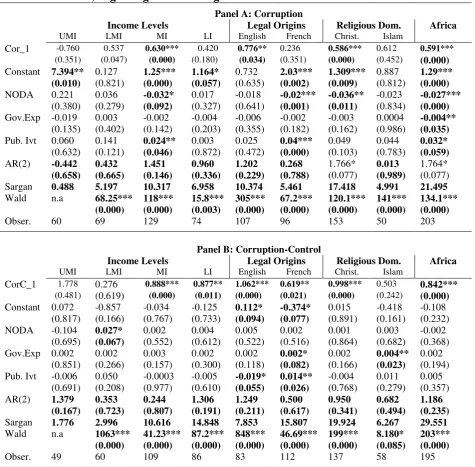
From Table 1, the following findings can be established in Panel A. (1) The positive
effect of foreign aid on corruption is most significant in: Middle-income countries (for
wealth-effects), French civil-law countries (for legal-origin effects) and Christian-dominated
countries (for religious effects). (2) The results of Panel B are not so significant to enable
comparative inferences. It should be noted that the corruption indicators are measured in
decreasing order by Transparency International; with the most corrupt countries having the
least values.
While the estimations in Table 2 suffer from some degree of freedom issues, two main
results broadly standout: the aid-corruption nexus is more corrosive in non-oil exporting
countries (Panel A). Moreover, there is also some scanty evidence of foreign aid increasing
corruption-control in Lower Middle income and Not-landlocked countries (Panel B). For
both tables the baseline (or overall African) aid-corruption nexus results in the last column are
consistent with recent literature and the control variables have the expected signs (Asongu,
2012a, 2013a; Asongu & Jellal, 2013”).
4
7 Table 1: Wealth-, ‘legal origin’- and ‘religious domination’- effects
Panel A: Corruption
Income Levels Legal Origins Religious Dom. Africa
UMI LMI MI LI English French Christ. Islam
Cor_1 -0.760 0.537 0.630*** 0.420 0.776** 0.236 0.586*** 0.612 0.591***
(0.351) (0.047) (0.000) (0.180) (0.034) (0.351) (0.000) (0.452) (0.000) Constant 7.394** 0.127 1.25*** 1.164* 0.732 2.03*** 1.309*** 0.887 1.29***
(0.010) (0.821) (0.000) (0.057) (0.635) (0.002) (0.009) (0.812) (0.000)
NODA 0.221 0.036 -0.032* 0.017 -0.018 -0.02*** -0.036** -0.023 -0.027*** (0.380) (0.279) (0.092) (0.327) (0.641) (0.001) (0.011) (0.834) (0.000) Gov.Exp -0.019 0.003 -0.002 -0.004 -0.006 -0.002 -0.003 0.0004 -0.004**
(0.135) (0.402) (0.142) (0.203) (0.355) (0.182) (0.162) (0.986) (0.035) Pub. Ivt 0.060 0.141 0.024** 0.003 0.025 0.04*** 0.049 0.044 0.032* (0.632) (0.121) (0.046) (0.872) (0.472) (0.000) (0.103) (0.783) (0.059) AR(2) -0.442 0.432 1.451 0.960 1.202 0.268 1.766* 0.013 1.764*
(0.658) (0.665) (0.146) (0.336) (0.229) (0.788) (0.077) (0.989) (0.077)
Sargan 0.488 5.197 10.317 6.958 10.374 5.461 17.418 4.991 21.495 Wald n.a 68.25*** 118*** 15.8*** 305*** 67.2*** 120.1*** 141*** 134.1***
(0.000) (0.000) (0.003) (0.000) (0.000) (0.000) (0.000) (0.000)
Obser. 60 69 129 74 107 96 153 50 203
Panel B: Corruption-Control
Income Levels Legal Origins Religious Dom. Africa
UMI LMI MI LI English French Christ. Islam
CorC_1 1.778 0.276 0.888*** 0.877** 1.062*** 0.619** 0.998*** 0.503 0.842***
(0.481) (0.619) (0.000) (0.011) (0.000) (0.021) (0.000) (0.242) (0.000) Constant 0.072 -0.857 -0.034 -0.125 0.112* -0.374* 0.015 -0.418 -0.108
(0.817) (0.166) (0.767) (0.733) (0.094) (0.077) (0.891) (0.161) (0.232) NODA -0.104 0.027* 0.002 0.004 0.005 0.002 0.001 0.003 -0.002
(0.695) (0.067) (0.552) (0.612) (0.522) (0.516) (0.864) (0.682) (0.368) Gov.Exp 0.002 0.002 0.003 0.002 0.002 0.002* 0.002 0.004** 0.002
(0.851) (0.266) (0.157) (0.300) (0.118) (0.082) (0.166) (0.023) (0.194) Pub. Ivt -0.006 0.050 -0.0003 -0.005 -0.019* 0.014** -0.004 0.011 0.005
(0.691) (0.208) (0.977) (0.610) (0.055) (0.026) (0.768) (0.279) (0.357) AR(2) 1.379 0.353 0.244 1.306 1.249 0.500 0.950 0.682 1.186
(0.167) (0.723) (0.807) (0.191) (0.211) (0.617) (0.341) (0.494) (0.235)
Sargan 1.776 2.996 10.616 14.848 7.853 15.807 19.924 6.267 29.551 Wald n.a 1063*** 41.23*** 87.2*** 848*** 46.69*** 199*** 8.180* 203***
(0.000) (0.000) (0.000) (0.000) (0.000) (0.000) (0.085) (0.000)
Obser. 49 60 109 86 83 112 137 58 195
8 Table 2: Regional-, Resources-, Political Stability- and Landlocked-effects
Panel A: Corruption
Regions Resources Stability Landlocked (LL) Africa
SSA NA Oil Non-oil Conflict Non-co. LL Not LL
Cor_1 0.64*** --- -1.377 0.58*** --- 0.58*** 0.806 0.20*** 0.591***
(0.000) (0.541) (0.000) (0.000) (0.248) (0.000) (0.000)
Constant 1.06*** --- 5.054 1.38*** --- 1.38*** 1.923 0.0004 1.29***
(0.000) (0.462) (0.000) (0.000) (0.460) (0.892) (0.000)
NODA -0.028** --- -0.117 -0.03*** --- -0.03*** -0.038 -0.010 -0.027***
(0.020) (0.707) (0.000) (0.000) (0.321) (0.120) (0.000)
Gov.Exp -0.003 --- 0.022 -0.003 --- -0.003 -0.006 -0.003*** -0.004** (0.167) (0.200) (0.145) (0.145) (0.216) (0.000) (0.035) Pub. Ivt 0.042** --- 0.114 0.037** --- 0.037** n.a 0.002 0.032*
(0.038) (0.218) (0.026) (0.026) (0.541) (0.059)
AR(2) 1.889* --- -0.649 1.772* --- 1.772* 0.352 1.382 1.764* (0.058) (0.515) (0.076) (0.076) (0.724) (0.167) (0.077) Sargan 20.385 --- n.a 19.297 --- 19.297 4.144 13.539 21.495 Wald 129.8*** --- 68.9*** 124.3*** --- 124*** n.a 28.6*** 134.1***
(0.000) (0.000) (0.000) (0.000) (0.000) (0.000)
Obser. 174 27 176 176 51 132 203
Panel B: Corruption-Control
Regions Resources Stability Landlocked (LL) Africa
SSA NA Oil Non-oil Conflict Non-co. LL Not LL
Cor_1 0.878*** --- 4.116 1.02*** --- 1.02*** 0.652* -0.023 0.842***
(0.000) (0.280) (0.000) (0.000) (0.089) (0.752) (0.000)
Constant -0.068 --- 4.429 0.017 --- 0.017 0.023 -0.016** -0.108 (0.483) (0.301) (0.863) (0.863) (0.913) (0.010) (0.232) NODA -0.002 --- 0.050 0.001 --- 0.001 -0.022 0.006** -0.002
(0.612) (0.749) (0.717) (0.717) (0.224) (0.027) (0.368) Gov.Exp 0.002 --- -0.025 0.003* --- 0.003 0.001 0.002** 0.002
(0.193) (0.212) (0.097) (0.097) (0.307) (0.014) (0.194) Pub. Ivt 0.002 --- -0.186 -0.007 --- -0.007 0.004 0.004 0.005
(0.800) (0.222) (0.564) (0.564) (0.838) (0.430) (0.357) AR(2) 1.081 --- n.a 0.573 --- 0.573 1.405 -0.024 1.186
(0.279) (0.566) (0.566) (0.159) (0.980) (0.235)
Sargan 26.202 --- n.a 22.821 --- 22.821 4.968 19.724 29.551 Wald 201*** --- 49.03*** 147.8*** --- 147*** 191*** 11.51** 203***
(0.000) (0.000) (0.000) (0.000) (0.000) (0.021) (0.000)
Obser. 171 29 166 166 52 119 195
***, **, and * indicate significance at 1%, 5% and 10% levels respectively. AR(2): Second Order Autocorrelation test. Sargan: Sargan OIR: Overidentifying Restrictions test. Gov. Exp: Government Expenditure. Pub. Invt: Public Investment. UMI: Upper Middle Income. SSA: Sub-Saharan Africa. NA: North Africa. Oil: Petroleum exporting countries. Non-oil: Countries with no significant exports in petroleum. Conflict: Countries with significant political instability. Non-co: Countries without significant political instability. Dom: Domination. na: insignificant estimate or variable not included in model. The significance of bold values is twofold. 1) The significance of estimated coefficients and the Wald statistics. 2) The failure to reject the null hypotheses of: a) no autocorrelation in the AR(2) tests and; b) the validity of the instruments in the Sargan OIR test. ---: estimation not feasible due to issues in degrees of freedom.
3.2 Discussion of results
Poor quality of institutions has been substantially documented as the one of the root
causes of Africa’s poverty: lack of property rights, high corruption, weak courts and contract
enforcements, hostile regulatory environment for private investment and political stability
9
more advanced nations need to promote good institutions. A growing literature has been
devoted to assessing how aid influences the quality of institutions (Alesina & Dollar, 2000;
Alesina & Weder, 2002; Knack, 2001; Dixit, 2004; Djankov et al., 2005; Asongu & Jellal,
2013). For over five decades, this interesting development assistance literature has revolved
around three main concerns. First, the issue of whether Donors allocate more to poor
countries with good institutions. Second, the concern of if foreign aid leads to worse or better
institutional quality. Third, the manner in which Donors use foreign aid as an instrument in
improving government quality. The present paper that is positioned on the second strand has
established that the positive effect of foreign aid on corruption is most significant in:
Middle-income, French civil-law, Christian-dominated, non-oil exporting and, landlocked countries.
On the colonial legacy effect, the fact that French civil-law countries become more
corrupt with foreign aid than their English common law counterparts is consistent with the
predictions of theoretical and empirical literature. The law and property rights theory holds
that legal systems that place more emphasize on State power vis-à-vis private property rights
tend to be more corrupt (La Porta et al., 1998; La Porta et al., 1999). Hence the likelihood that
a greater proportion of foreign aid will be misappropriated when the institutional web of
formal rules, informal norms and enforcement characteristics are poorer. Consistent with
Asongu (2012c), the edge of English legal origins over the French colonial legacy has been
extended to other management areas: more informative accounting standards (La Porta et al.,
1998), better institutions with less corrupt governments (La Porta et al., 1999) and more
efficient courts (Djankov et al., 2003). These findings have broadly been confirmed in recent
African literature on the weight of legal origins in government quality (Asongu, 2012b,
2014c) and property rights institutions (Asongu, 2014e).
The higher positive aid-corruption nexus in Christian-dominated countries relative to
their Islam-oriented counterparts could be explained by the weight of foreign aid in the
fundamental characteristics. In essence, the former are averagely more reliant on development
assistance than the latter: 11.36 versus 9.79 as a percentage of GDP. Another explanation
could be that the punishment against corruption related to foreign aid maybe less severe in the
former than in the latter set of countries.
The reason Non-oil exporting countries are more exposed to corruption as a result of
development assistance is simple. In fact, petroleum exporting countries averagely receive far
less foreign aid (3.29 as a percentage of GDP), relative to their non-exporting counterparts
10
The fact that aid leads to more corruption-control in countries that are open to the sea,
relative to their landlocked counterparts is expected. This is essentially because apart from
the higher institutional cost of being closed from the sea, landlocked countries also averagely
receive more aid: 12.55 versus 10.06 as a percentage of GDP.
4. Conclusion
We have assembled more pieces on the puzzle of the aid-corruption nexus. In essence,
have we extended the debate on the effect of foreign aid on corruption by providing evidence
on dynamic effects of wealth, legal origin, religious-domination, regional proximity, openness
to sea, natural resources and politico-economic stability. The empirical evidence from
dynamic panel GMM estimation is based on 53 African countries for the period 1996-2010.
The findings show that the positive effect of foreign aid on corruption is most significant in:
Middle-income, French civil-law, Christian-dominated, non-oil exporting and landlocked
countries. Moreover, there is also some scanty evidence of foreign aid increasing
corruption-control in Lower Middle income and Not-landlocked countries. Justifications for the
11 References
Addison, T., Mavrotas, G., and McGillivray, M. (2005) “Development Assistance and Development Finance: Evidence and Global Policy Agendas” Journal of International Development17, 819-836.
Alesina, A., and Dollar, D. (2000) “Who gives Foreign Aid to Whom and Why?” Journal of Economic Growth, 5, 33-64.
Alesina, A., and Weder, B. (2002) “Do Corrupt Governments Receive Less Foreign Aid?”
American Economic Review92, 1126-1137.
Arellano, M., and Bond, S. (1991) “Some tests of specification for panel data: Monte Carlo evidence and an application to employment equations” The Review of Economic Studies 58, 277-297.
Arellano, M., and Bover, O. (1995) “Another look at the instrumental variable estimation of error-components models” Journal of Econometrics68, 29-52.
Asongu, S. A. (2012a) “On the effect of foreign aid on corruption” Economics Bulletin32(3), 2174-2180.
Asongu, S. A., (2012b), “Government quality determinants of stock market performance in African countries”, Journal of African Business, 13(2), pp. 183-199.
Asongu, S. A., (2012c), “Law and finance in Africa”, Brussels Economic Review, 55(4), pp. 385-408.
Asongu, S. A. (2013a) “On the effectiveness of foreign aid in institutional quality” European Economics Letters2(1), 12-19.
Asongu, S. A. (2013b) “Fighting corruption in Africa: do existing corruption-control levels matter?” International Journal of Development Issues12(1), 36-52.
Asongu, S. A. (2013c) “Fighting Corruption when Existing Corruption-Control Level Count: What do Wealth-Effects Tell us in Africa?”, Institutions and Economies, 5(3), pp. 53-74.
Asongu, S. A., (2013d). “How has politico-economic liberalization affected financial allocation efficiency? Fresh African evidence”, Economics Bulletin, 33(1), pp. 663-676.
Asongu, S. A., (2013e). “Harmonizing IPRs on Software Piracy: Empirics of Trajectories in Africa”, Journal of Business Ethics, 118(1), pp. 45-60.
Asongu, S. A. (2014a) “Fighting African corruption when existing corruption-control levels matter in a dynamic cultural setting”, International Journal of Social Economics: Forthcoming.
12
Asongu, S. A., (2014c), “Law, finance, economic growth and welfare: why does legal origin matter?”, Institutions and Economies: Forthcoming.
Asongu, S. A., (2014d), “Fighting corruption with existing corruption-control levels count: what do wealth-effects tell us in Africa?”, Institutions and Economies: Forthcoming.
Asongu, S. A., (2014e), “Fighting software piracy in Africa: how do legal origins and IPRs protection channels matter?” Journal of the Knowledge Economy: Forthcoming.
Asongu, S. A., & Jellal, M., (2013) “On the channels of foreign aid to corruption”, Economics Bulletin, 33(3), pp. 2191-2201.
Arvis, J-F., Marteau, J-F., & Raballand, G., (2007), “The cost of being landlocked: logistics costs and supply chain reliability”, Word Bank Working Paper Series No. 4258.
Baliamoune-Lutz, M., and Ndikumana, L. (2008), “Corruption and Growth: Exploring the Investment Channel”, University of Massachusetts, Amherst.
Benedek, D., Crivelli, E., Gupta, S., and Muthoora, P. (2012) “Foreign Aid and Revenue: Still a Crowding Out Effect?” IMF Working Paper 12/186.
Bird, R. M. (2007) “Tax Effort: The Impact of Corruption, Voice and Accountability”, ITP Paper 0702.
Blundell, R., & Bond, S., (1998). “Initial conditions and moment restrictions in dynamic panel data models” Journal of Econometrics, 87(1), 115-143.
Bond, S., Hoeffler, A., and Tample, J. (2001) “GMM Estimation of Empirical Growth Models”, University of Oxford.
Boyce, J. K., & Ndikumana, L., (2008), “New Estimate of Capital Flight from Sub-Saharan African Countries: Linkages with External Borrowing and Policy Option”, PERI Working Paper No. 166, University of Massachusetts Amherst, USA.
Boone, P. (1996) “Politics and Effectiveness of Foreign Aid,” European Economic Review,
40, 289-329.
Chenery, H. B., and Strout, A. M. (1966) “Foreign Assistance and Economic Development”,
American Economic Review56, 679-733.
CIA (2011). Central Intelligence Agency, The World Factbook 2011.
Demirgüç-Kunt, A., and Levine, R. (2008) “Finance, Financial Sector Policies, and Long-Run Growth” World Bank Policy Research Working Paper No. 4469, Washington, DC: The World Bank.
Dixit, A. (2004), Lawlessness and Economics: Alternative Modes of Governance. Princeton: University Press.
13
Djankov, S., Jose, G. M., and Marta, R. (2005) The Curse of Aid. World Bank, Mimeo, April, 2005.
Easterly, W. (2005) “Can foreign aid save Africa”, Saint John’s University.
Fielding, D., McGillivray, M., & Torres, S., (2006), “A Wider Approach to Aid Effectiveness: Correlated Impacts on Health, Wealth, Fertility and Education”, The World Institute for Development Economics Research(UNU-WIDER).
Gomane, K., Morrissey, O., Mosley, P., and Verschoor, A. (2003) “Aid, pro-poor Government Spending and Welfare” CREDIT Working Paper 03/01.
Hollyer, J. R., & Wantchekon, L., (2012). “Corruption in Autocracies”, University of Minnesota, http://papers.ssrn.com/sol3/papers.cfm?abstract_id=1861464 (accessed: 28/12/2013).
Jellal, M., & Bouzahzah, M., (2012). “Corruption and tax evasion: an optimal policy”, MPRA Paper No. 38813.
Knack, S. (2001) “Aid Dependence and the Quality of Governance: Cross-Country Empirical Tests” Southern Economic Journal68(2), 310-329.
Knack, S., and Keefer, P. (1995) “Institutions and Economic Performance: cross-country tests using alternative institutional measures” Economics and Politics7(3), 207-227.
Kodila-Tedika, O. (2012) “Empirical Survey on the Causes of Corruption” MPRA Paper No. 41484.
Kodila-Tedika, O. (2013) “Corruption and Failed African States” MPRA Paper No. 44686.
La Porta, R., Lopez-de-Silanes, F., Shleifer, A., & Vishny, R. W., (1998), “Law and finance”,
Journal of Political Economy, 106, pp. 1113-1155.
La Porta, R., Lopez-de-Silanes, F., Shleifer, A., & Vishny, R. W., (1999), “The quality of government”, Journal of Law, Economics and Organization, 15, pp. 222-279.
La Porta, R., Lopez-de-Silanes, F., & Shleifer, A., (2008), “The Economic Consequences of Legal Origin,” Journal of Economic Literature, 46(2), pp. 285-332.
Larrain, F., and Tavares, J. (2004) “Does Foreign Direct Investment Decrease Corruption”
Cuadernos de Economia-Latin American Journal of Economics 41(123), 217-230.
Morrissey, O. (2012) “Aid and Government Fiscal Behavior. What Does the Evidence Say?”
UNU-WIDER Working Paper No. 2012/01.
14
Mosley, P., Hudson, J., and Verschoor, A. (2004) “Aid, Poverty Reduction and the ‘new’ Conditionality” Economic Journal114, F217–F243.
Musila, J. W., (2013) “Does Democracy Have a Different Impact on Corruption in Africa?”, Journal of African Business, Journal of African Business, 14(3), pp. 162-170.
Ndikumana, L., & Boyce, J., (2011) “Capital flight from sub-Saharan Africa: linkages with external borrowing and policy options”, International Review of Applied Economics, 25(2), pp. 149-170.
Okada, K., and Samreth, S. (2012) “The effect of foreign aid on corruption: A quantile regression approach” Economic Letters11, 240-243.
Reichel, R. (1995) “Development, Aid, Savings and Growth in the 1980s: A Cross-Sectional Analysis” Savings and Development19(3), 279-296.
Rostow, W. W. (1960) The Stages of Economic Growth: A Non-Communist Manifesto.