Munich Personal RePEc Archive
Identifying the Median Path of a
Stochastic Processes
Bell, Peter N
26 November 2015
Online at
https://mpra.ub.uni-muenchen.de/72680/
© Peter Bell, 2015
Identifying the Median Path of a Stochastic Processes
Peter N. Bell
Author note
MEDIAN PATH METHOD 2
Abstract
This paper presents a method to characterize the typical path of a stochastic process, which I
refer to as the Median Path. The paper describes how to estimate the Median Path in simulation
and compares it to a different estimate of the typical path that is defined as the median value at
each time step, like an ensemble average. The Median Path is an actual path from the stochastic
process, whereas the path of median values is not. Therefore, the two paths may have very
different properties. The Median Path is a single path from a set of simulated paths and is
identified using a Ranking Algorithm that calculates the rank of each path at each time and then
averages the ranks over time, similar to a time average. The Median Path is potentially useful in
simulation applications where it is important to characterize the actual behaviour of a path
generated by the stochastic process rather than the behaviour of statistics of the process over
time.
Keywords: Simulation, Ensemble Average, Time Average.
Identifying the Median Path of a Stochastic Processes
1. Introduction
The paper introduces the Median Path, which is an estimate of the typical behaviour of a
stochastic process over time. The Median Path is a particular path in a set of simulated paths
generated by a stochastic process. The Median Path is identified by a Ranking Algorithm that
compares the values of all paths at each time step, ranks each path at each time step, and then
averages the ranks over time. In this way, the Ranking Algorithm can identify a path that is
consistently in the midst of the set of simulated paths over time. In contrast, the typical path
could be described by the median values for the stochastic process over time, which I refer to as
the Benchmark Path. The Median Path is more representative of the typical behaviour of the
stochastic process because it is an actual path generated by the stochastic process, rather than a
path defined by statistics at each time step.
( 1 ) X ( t , n ) = X ( t - 1 , n ) + e .
The paper uses a stationary time series generated by Equation (1), where X(t,n) denotes the
value of n-th path at time t. I assume that the total number of paths is large, N=10,000 to ensure
that the statistics calculated across paths are close to theoretical values. Note that the median
rank is N/2=5000. I assume that there are a relatively small of number time steps, T=100, to
provide enough length of path to show phenomenon of interest. I also assume that X(0)=100 and
e~U(-0.01,0.01) throughout for simplicity.
2. The Median Path
MEDIAN PATH METHOD 4
To identify the Median Path, I use a Ranking Algorithm that compares all of the simulated
paths at each time step. I describe the algorithm below.
1. For each time t, rank the value of the n-th path against the value of all other paths at
that time. Denote this ranking as R(n,t), which takes values from 1 to N.
2. Calculate the average of the ranks over time, R'(n)=average(R(n,t)), and then rank the
paths again based on the value of R'(n). The new ranking R''(n) takes values from 1
to N.
3. Identify the path n* that produces the median value amongst the re-ranked scores,
R''(n*)=N/2. This path is the Median Path.
The Ranking Algorithm is designed to capture information about the ranking of a single path
in comparison to others over time. If a particular path is consistently in the middle of the set of
simulated paths, then that path will receive a medium ranking over time R'(n) approximately N/2
and the re-ranked score will also be near the median R''(n) approximately N/2. In general, these
rankings can be used to identify paths that are consistently in the middle of the pack for all
simulated paths. However, a particular path may have high ranking in some times and low
rankings in others that offset each other and cause the average ranking to be approximately N/2,
which raises a concern that I address with a Revised Ranking Algorithm below.
For comparison, I define the Benchmark Path as the median across all paths at each time
M(t)=median(X(n,t)). The Benchmark Path provides a simple way to characterize the typical
level of a stochastic process but has small variation over time in large samples because it is
defined as an estimate of the median value at each time step.
Figure 1 shows two estimates of the Median Path and one estimate of the Benchmark Path.
The Median Paths are very different from the Benchmark Path, as expected. The Median Paths
moves between 96 and 104, whereas the Benchmark Path has much smaller variation. This
occurs because the Median Path has more natural variation that accurately represents the typical
behaviour of this time series, whereas the Benchmark Path has less variation because it is
[image:6.612.74.545.243.601.2]constructed as a statistic with little variance in large samples.
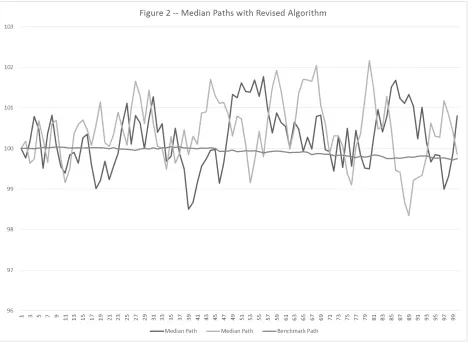
Figure 2 shows that the two estimates of the Median Path have very different behaviour over
time, which reflects just how much variability is typical for the underlying stochastic process. In
contrast, the Benchmark Path may accurately represent the level of the typical path but not the
MEDIAN PATH METHOD 6
the dispersion of a path around the typical level, but this will not give a sense for what a
particular path generated by the stochastic process will actually look like in the same manner as
an estimate of the Median Path.
2.3 Revised Ranking Algorithm
To address the concern that a particular path could offset high rankings in some periods with
low rankings in other periods, I introduce a weighting scheme to penalize paths that have
rankings far from the median value at any time. I use the sum squares of differences to
emphasize that the ranking should be close to the median value over time. The Revised Ranking
Algorithm is given below.
1. For each time t, rank the value of the n-th path against all other simulated values at
that time. Denote this ranking as R(n,t), which takes values from 1 to N.
2. Calculate the average over time of the sum of squared differences between the rank
and median rank, R'(n)=average[ (R(n,t)-N/2)2 ].
3. Identify the path that minimizes the re-ranked scores, n*: min(R'(n)). This path is the
Median Path.
The Revised Ranking Algorithm identifies the path that minimizes the sum of squared
differences between its rank and the median rank over time. Using the sum of squared
differences in this ways penalizes paths that deviate far from the median at any time point and
mitigates the risk that a path can offset a high ranking in one period with a low ranking in other
period. The path that minimizes the sum of squared differences is close to the median of all paths
in a stronger sense than the initial Ranking Algorithm. I provide two estimates of the Median
Figure 3 shows that the two estimates of the Median Path are still different from each other,
but are both more closely concentrated around the Benchmark Path over time. The Median Paths
here do not take values far above or below the median value over time and this suggests that
Revised Ranking Algorithm more effectively identifies paths that are consistently the in midst of
all the simulated paths.
3. Discussion
The Median Path is a numerical method that is useful for characterizing the typical behaviour
of a stochastic process because it identifies an actual path generated by the process, rather than a
path defined by a statistic at each time step. Therefore, the Median Path more accurately reflects
MEDIAN PATH METHOD 8
such variation can give important insight that goes beyond what can be learned from the system
response to the Benchmark Path. Furthermore, it is possible to extend the Median Path method
to characterize other percentile-paths, such as the Upper-Quartile Path or 99-Percentile Path.
These methods can follow similar a construction as described here and help characterize the