Extracting Social Power Relationships from Natural Language
Philip Bramsen Louisville, KY
bramsen@alum.mit.edu*
Ami Patel
Massachusetts Institute of Technology Cambridge, MA
ampatel@mit.edu*
Martha Escobar-Molano San Diego, CA
mescobar@asgard.com*
Rafael Alonso SET Corporation
Arlington, VA
ralonso@setcorp.com
Abstract
Sociolinguists have long argued that social context influences language use in all manner of ways, resulting in lects1. This paper ex-plores a text classification problem we will call lect modeling, an example of what has been termed computational sociolinguistics. In particular, we use machine learning techniques to identify social power relationships between members of a social network, based purely on the content of their interpersonal communica-tion. We rely on statistical methods, as op-posed to language-specific engineering, to extract features which represent vocabulary and grammar usage indicative of social power lect. We then apply support vector machines to model the social power lects representing su-perior-subordinate communication in the En-ron email corpus. Our results validate the treatment of lect modeling as a text classifica-tion problem – albeit a hard one – and consti-tute a case for future research in computational sociolinguistics.
1 Introduction
Linguists in sociolinguistics, pragmatics and re-lated fields have analyzed the influence of social context on language and have catalogued countless phenomena that are influenced by it, confirming many with qualitative and quantitative studies.
* This work was done while these authors were at SET Corpo-ration, an SAIC Company.
1
Fields that deal with society and language have inconsistent terminology; “lect” is chosen here because “lect” has no other English definitions and the etymology of the word gives it the sense we consider most relevant.
deed, social context and function influence lan-guage at every level – morphologically, lexically, syntactically, and semantically, through discourse structure, and through higher-level abstractions such as pragmatics.
Considered together, the extent to which speak-ers modify their language for a social context amounts to an identifiable variation on language, which we call a lect. Lect is a backformation from words such as dialect (geographically defined lan-guage) and ethnolect (language defined by ethnic context).
In this paper, we describe lect classifiers for so-cial power relationships. We refer to these lects as:
• UpSpeak: Communication directed to someone with greater social authority.
• DownSpeak: Communication directed to someone with less social authority.
• PeerSpeak:Communication to someone of equal social authority.
We call the problem of modeling these lects Social Power Modeling (SPM). The experiments reported in this paper focused primarily on modeling Up-Speak and DownUp-Speak.
Manually constructing tools that effectively model specific linguistic phenomena suggested by sociolinguistics would be a Herculean effort. Moreover, it would be necessary to repeat the ef-fort in every language! Our approach first identi-fies statistically salient phrases of words and parts of speech – known as n-grams – in training texts generated in conditions where the social power
relationship is known. Then, we apply machine learning to train classifiers with groups of these n-grams as features. The classifiers assign the Up-Speak and DownUp-Speak labels to unseen text. This methodology is a cost-effective approach to model-ing social information and requires no language- or culture-specific feature engineering, although we believe sociolinguistics-inspired features hold promise.
When applied to the corpus of emails sent and received by Enron employees (CALO Project 2009), this approach produced solid results, despite a limited number of training and test instances.
This has many implications. Since manually de-termining the power structure of social networks is a time-consuming process, even for an expert, ef-fective SPM could support data driven socio-cultural research and greatly aid analysts doing national intelligence work. Social network analysis (SNA) presupposes a collection of individuals, whereas a social power lect classifier, once trained, would provide useful information about individual author-recipient links. On networks where SNA already has traction, SPM could provide comple-mentary information based on the content of com-munications.
If SPM were yoked with sentiment analysis, we might identify which opinions belong to respected members of online communities or lay the groundwork for understanding how respect is earned in social networks.
More broadly, computational sociolinguistics is a nascent field with significant potential to aid in modeling and understanding human relationships. The results in this paper suggest that successes to date modeling authorship, sentiment, emotion, and personality extend to social power modeling, and our approach may well be applicable to other di-mensions of social meaning.
In the coming sections, we first establish the
Related Work, primarily from Statistical NLP. We then cover our Approach, the Evaluation, and, finally, the Conclusions and Future Re-search.
2 Related Work
The feasibility of Social Power Modeling is sup-ported by sociolinguistic research identifying spe-cific ways in which a person’s language reflects his relative power over others. Fairclough's classic
work Language and Power explores how "sociolinguistic conventions . . . arise out of -- and give rise to – particular relations of power" (Fair-clough, 1989). Brown and Levinson created a the-ory of politeness, articulating a set of strategies which people employ to demonstrate different lev-els of politeness (Brown & Levinson, 1987). Mo-rand drew upon this theory in his analysis of emails sent within a corporate hierarchy; in it, he quantitatively showed that emails from subordi-nates to superiors are, in fact, perceived as more polite, and that this perceived politeness is corre-lated with specific linguistic tactics, including ones set out by Brown and Levinson (Morand, 2000). Similarly, Erikson et al identified measurable char-acteristics of the speech of witnesses in a court-room setting which were directly associated with the witness’s level of social power (Erikson, 1978). Given, then, that there are distinct differences among what we term UpSpeak and DownSpeak, we treat Social Power Modeling as an instance of
text classification (or categorization): we seek to assign a class (UpSpeak or DownSpeak) to a text sample. Closely related natural language process-ing problems are authorship attribution, sentiment analysis, emotion detection, and personality classi-fication: all aim to extract higher-level information from language.
Authorship attribution in computational linguis-tics is the task of identifying the author of a text. The earliest modern authorship attribution work was (Mosteller & Wallace, 1964), although foren-sic authorship analysis has been around much longer. Mosteller and Wallace used statistical lan-guage-modeling techniques to measure the similar-ity of disputed Federalist Papers to samples of known authorship. Since then, authorship identifi-cation has become a mature area productively ex-ploring a broad spectrum of features (stylistic, lexical, syntactic, and semantic) and many genera-tive and discriminagenera-tive modeling approaches (Sta-matatos, 2009). The generative models of authorship identification motivated our statistically extracted lexical and grammatical features, and future work should consider these language model-ing (a.k.a. compression) approaches.
& Cardie, 2007). For example, one problem is classifying user reviews as positive, negative or neutral. Typically, polarity lexicons (each term is labeled as positive, negative or neutral) help de-termine attitudes in text (Hiroya & Takamura, 2005, Ravichandran 2009, Choi & Cardie 2009).
The polarity of an expression can be determined based on the polarity of its component lexical items (Choi & Cardie 2008). For example, the po-larity of the expression is determined by the major-ity polarmajor-ity of its lexical items or by rules applied to syntactic patterns of expressions on how to de-termine the polarity from its lexical components. McDonald et al studied models that classify senti-ment on multiple levels of granularity: sentence and document-level (McDonald, 2007). Their work jointly classifies sentiment at both levels instead of using independent classifiers for each level or cas-caded classifiers. Similar to our techniques, these studies determine the polarity of text based on its component lexical and grammatical sequences. Unlike their works, our text classification tech-niques take into account the frequency of occur-rence of word n-grams and part-of-speech (POS) tag sequences, and other measures of statistical salience in training data.
Text-based emotion prediction is another in-stance of text classification, where the goal is to detect the emotion appropriate to a text (Alm, Roth & Sproat, 2005) or provoked by an author, for ex-ample (Strapparava & Mihalcea, 2008). Alm, Roth, and Sproat explored a broad array of lexical and syntactic features, reminiscent of those of author-ship attribution, as well as features related to story structure. A Winnow-based learning algorithm trained on these features convincingly predicted an appropriate emotion for individual sentences of narrative text. Strapparava and Mihalcea try to predict the emotion the author of a headline intends to provoke by leveraging words with known affec-tive sense and by expanding those words’ syno-nyms. They used a Naïve Bayes classifier trained on short blogposts of known emotive sense. The knowledge engineering approaches were generally superior to the Naïve Bayes approach. Our proach is corpus-driven like the Naïve Bayes ap-proach, but we interject statistically driven feature selection between the corpus and the machine learning classifiers.
In personality classification, a person’s lan-guage is used to classify him on different personal-ity dimensions, such as extraversion or neuroticism (Oberlander & Nowson, 2006; Mairesse & Walker; 2006). The goal is to recover the more permanent traits of a person, rather than fleeting characteris-tics such as sentiment or emotion. Oberlander and Nowson explore using a Naïve Bayes and an SVM classifier to perform binary classification of text on each personality dimension. For example, one clas-sifier might determine if a person displays a high or low level of extraversion. Their attempt to clas-sify each personality trait as either “high” or “low” echoes early sentiment analysis work that reduced sentiments to either positive or negative (Pang, Lee, & Vaithyanathan, 2002), and supports ini-tially treating Social Power Modeling as a binary classification task. Personality classification seems to be the application of text classification which is the most relevant to Social Power Modeling. As Mairesse and Walker note, certain personality traits are indicative of leaders. Thus, the ability to model personality suggests an ability to model so-cial power lects as well.
Apart from text classification, work from the topic modeling community is also closely related to Social Power Modeling. Andrew McCallum ex-tended Latent Dirichlet Allocation to model the author and recipient dependencies of per-message topic distributions with an Author-Recipient-Topic (ART) model (McCallum, Wang, & Corrada-Emmanuel, 2007). This was the first significant work to model the content and relationships of communication in a social network. McCallum et al applied ART to the Enron email corpus to show that the resulting topics are strongly tied to role. They suggest that clustering these topic distribu-tions would yield roles and argue that the person-to-person similarity matrix yielded by this ap-proach has advantages over those of canonical so-cial network analysis. The same authors proposed several Role-Author-Recipient-Topic (RART) models to model authors, roles and words simulta-neously. With a RART modeling roles-per-word, they produced per-author distributions of generated roles that appeared reasonable (e.g. they labeled Role 10 as ‘grant issues’ and Role 2 as ‘natural language researcher’).
communica-tion. However, we model social power relation-ships, not roles or topics, and our approach pro-duces discriminative classifiers, not generative models, which enables more concrete evaluation.
Namata, Getoor, and Diehl effectively applied role modeling to the Enron email corpus, allowing them to infer the social hierarchy structure of En-ron (Namata et al., 2006). They applied machine learning classifiers to map individuals to their roles in the hierarchy based on features related to email traffic patterns. They also attempt to identify cases of manager-subordinate relationships within the email domain by ranking emails using traffic-based and content-based features (Diehl et al., 2007). While their task is similar to ours, our goal is to classify any case in which one person has more social power than the other, not just identify in-stances of direct reporting.
3 Approach
3.1 Feature Set-Up
Previous work in traditional text classification and its variants – such as sentiment analysis – has achieved successful results by using the bag-of-words representation; that is, by treating text as a collection of words with no interdependencies, training a classifier on a large feature set of word unigrams which appear in the corpus. However, our hypothesis was that this approach would not be the best for SPM. Morand’s study, for instance, identified specific features that correlate with the direction of communication within a social hierar-chy (Morand, 2000). Few of these tactics would be effectively encapsulated by word unigrams. Many would be better modeled by POS tag unigrams (with no word information) or by longer n-grams consisting of either words, POS tags, or a combina-tion of the two. “Uses subjunctive” and “Uses past tense” are examples. Because considering such features would increase the size of the feature space, we suspected that including these features would also benefit from algorithmic means of se-lecting n-grams that are indicative of particular lects, and even from binning these relevant n-grams into sets to be used as features.
Therefore, we focused on an approach where each feature is associated with a set of one or more n-grams. Each n-gram is a sequence of words, POS tags or a combination of words and POS tags
(“mixed” n-grams). Let S represent a set {n1, …, nk} of n-grams. The feature associated with S on
text T would be:
1
( , ) ( , )
k
i i
f S T freq n T
= =
∑
where freq n T( , )i is the relative frequency
(de-fined later) of ni in text T. Let ni represent the sequence s1…smwhere
j
s specifies either a word or a POS tag. Let T represent the text consisting of the sequence of tagged-word tokens t1…tl .
( , )i
freq n T is then defined as follows:
1
( , )i ( m, )
freq n T = freq s …s T
{
1 : 1 ( )}
1
b b m p m b p p
t t t s
l m
+ + ∀≤ ≤ + =
=
− +
…
where:
( ) ( )
i j j i j
i j j
word t s if s is a word t s
tag t s if s is a tag
=
= ↔
=
To illustrate, consider the following feature set, a bigram and a trigram (each term in the n-gram ei-ther has the form word or ^tag):
{please ^VB, please ^‘comma’ ^VB}2
The tag “VB” denotes a verb. Suppose T consists of the following tokenized and tagged text (sen-tence initial and final tokens are not shown):
please^RB bring^VB the^DET report^NN to^TO our^PRP$ next^JJ weekly^JJ meet-ing^NN .^.
The first n-gram of the set, please ^VB, would match please^RB bring^VB from the text. The fre-quency of this n-gram in T would then be 1/9, where 1 is the number of substrings in T that match
2
please ^VB and 9 is the number of bigrams in T, excluding sentence initial and final markers. The other n-gram, the trigram please ^‘comma’ ^VB,
does not have any match, so the final value of the feature is 1/9.
Defining features in this manner allows us to both explore the bag-of-words representation as well as use groups of n-grams as features, which we believed would be a better fit for this problem.
3.2 N-Gram Selection
To identify n-grams which would be useful fea-tures, frequencies of n-grams in only the training set are considered. Different types of frequency measures were explored to capture different types of information about an n-gram’s usage. These are:
• Absolute frequency: The total number of times a particular n-gram occurs in the text of a given class (social power lect). • Relative frequency: The total number of
times a particular n-gram occurs in a given class, divided by the total number of n-grams in that class. Normalization by the size of the class makes relative frequency a better metric for comparing n-gram usage across classes.
We then used the following frequency-based met-rics to select n-grams:
• We set a minimum thresholdfor the abso-lute frequency of the n-gram in a class. This helps weed out extremely infrequent words and spelling errors.
• We require that the ratio of the relative frequency of the n-gram in one class to its relative frequency in the other class is also greater than a threshold. This is a simple means of selecting n-grams indicative of lect.
In experiments based on the bag-of-words model, we only consider an absolute frequency threshold, whereas in later experiments, we also take into ac-count the relative frequency ratio threshold.
3.3 N-gram Binning
In experiments in which we bin n-grams, selected n-grams are assigned to the class in which their relative frequency is highest. For example, an n-gram whose relative frequency in UpSpeak text is twice that in DownSpeak text would be assigned to the class UpSpeak.
N-grams assigned to a class are then partitioned into sets of n-grams. Each of these sets of n-grams is associated with a feature. This partition is based on the n-gram type, the length of n-grams and the relative frequency ratio of the n-grams. While the n-grams composing a set may themselves be in-dicative of social power lects, this method of grouping them makes no guarantees as to how in-dicative the overall set is. Therefore, we experi-mented with filtering out sets which had a negligible information gain. Information gain is an information theoretic concept measuring how much the probability distributions for a feature dif-fer among the difdif-ferent classes. A small informa-tion gain suggests that a feature may not be effective at discriminating between classes.
Although this approach to partitioning is simple and worthy of improvement, it effectively reduced the dimensionality of the feature space.
3.4 Classification
Once features are selected, a classifier is trained on these features. Many features are weak on their own; they either occur rarely or occur frequently but only hint weakly at social information. There-fore, we experimented with classifiers friendly to weak features, such as Adaboost and Logistic Re-gression (MaxEnt). However, we generally achieved the best results using support vector ma-chines, a machine learning classifier which has been successfully applied to many previous text classification problems. We used Weka’s opti-mized SVMs (SMO) (Witten 2005, Platt 1998) and default parameters, except where noted.
4 Evaluation
4.1 Data
avail-able Enron corpus. After filtering for duplicates and removing empty or otherwise unusable emails, the total number of emails is 245K, containing roughly 90 million words. However, this total in-cludes emails to non-Enron employees, such as family members and employees of other corpora-tions, emails to multiple people, and emails re-ceived from Enron employees without a known corporate role. Because the author-recipient rela-tionships of these emails could not be established, they were not included in our experiments.
Building upon previous annotation done on the corpus, we were able to ascertain the corporate role (CEO, Manager, Employee, etc.) of many email authors and recipients. From this information, we determined the author-recipient relationship by applying general rules about the structure of a cor-porate hierarchy (an email from an Employee to a CEO, for instance, is UpSpeak). This annotation method does not take into account promotions over time, secretaries speaking on behalf of their super-visors, or other causes of relationship irregularities. However, this misinformation would, if anything, generally hurt our classifiers.
The emails were pre-processed to eliminate text not written by the author, such as forwarded text and email headers. As our approach requires text to be POS-tagged, we employed Stanford’s POS tag-ger (http://nlp.stanford.edu/software/tagtag-ger.shtml). In addition, text was regularized by conversion to lower case and tokenized to improve counts.
[image:6.612.79.298.555.611.2]To create training and test sets, we partitioned the authors of text from the corpus into two sets: A and B. Then, we used text authored by individuals in A as a training set and text authored by indi-viduals in B as a test set. The training set is used to determine discriminating features upon which clas-sifiers are built and applied to the test set. We
Table 1. Author-based Training and Test partitions. The number of author-recipient pairs (links) and the number of words in text labeled as UpSpeak and DownSpeak are shown.
found that partitioning by authors was necessary to avoid artificially inflated scores, because the
clas-sifiers pick up aspects of particular authors’ lan-guage (idiolect) in addition to social power lect information. It was not necessary to account for recipients because the emails did not contain text from the recipients. Table 1 summarizes the text partitions.
Because preliminary experiments suggested that smaller text samples were harder to classify, the classifiers we describe in this paper were both trained and tested on a subset of the Enron corpus where at least 500 words of text was communi-cated from a specific author to a specific recipient. This subset contained 142 links, 40% of which were used as the test set.
Weighting for Cost-Sensitive Learning: The original corpus was not balanced: the number of UpSpeak links was greater than the number of DownSpeak links. Varying the weight given to training instances is a technique for creating a clas-sifier that is cost-sensitive, since a clasclas-sifier built on an unbalanced training set can be biased to-wards avoiding errors on the overrepresented class (Witten, 2005). We wanted misclassifying Up-Speak as DownUp-Speak to have the same cost as mis-classifying DownSpeak as UpSpeak. To do this, we assigned weights to each instance in the train-ing set. UpSpeak instances were weighted less than DownSpeak instances, creating a training set that was balanced between UpSpeak and DownSpeak. Balancing the training set generally improved re-sults.
Weighting the test set in the same manner al-lowed us to evaluate the performance of the classi-fier in a situation in which the numbers of UpSpeak and DownSpeak instances were equal. A baseline classifier that always predicted the major-ity class would, on its own, achieve an accuracy of 74% on UpSpeak/DownSpeak classification of unweighted test set instances with a minimum length of 500 words. However, results on the weighted test set are properly compared to a base-line of 50%. We include both approaches to scor-ing in this paper.
4.2 UpSpeak/DownSpeak Classifiers
In this section, we describe experiments on classi-fication of interpersonal email communication into UpSpeak and DownSpeak. For these experiments, only emails exchanged between two people related by a superior/subordinate power relationship were
UpSpeak DownSpeak
Links Words Links Words
Training 431 136K 328 63K
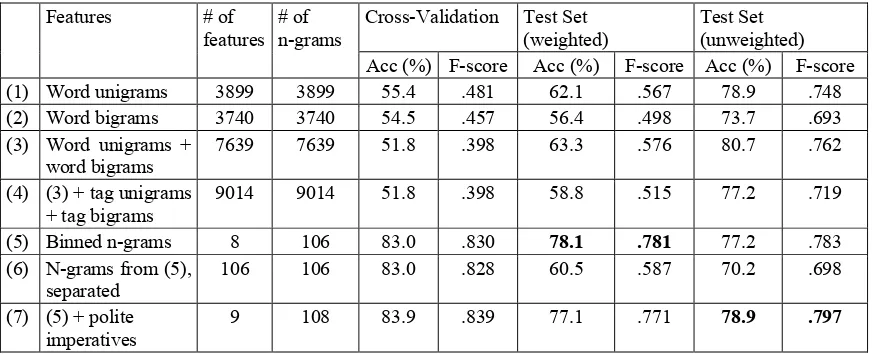
Table 2. Experiment Results. Accuracies/F-Scores with an SVM classifier for 10-fold cross validation on the weighted training set and evaluation against the weighted and unweighted test sets. Note that the baseline accu-racy against the unweighted test set is 74%, but 50% for the weighted test set and cross-validation.
Human-Engineered Features: Before examin-ing the data itself, we identified some features which we thought would be predictive of UpSpeak or DownSpeak, and which could be fairly accu-rately modeled by mixed n-grams. These features included the use of different types of imperatives.
We also thought that the type of greeting or sig-nature used in the email might be reflective of formality, and therefore of UpSpeak and Down-Speak. For example, subordinates might be more likely to use an honorific when addressing a supe-rior, or to sign an email with “Thanks.” We pre-formed some preliminary experiments using these features. While the feature set was too small to produce notable results, we identified which fea-tures actually were indicative of lect. One such feature was polite imperatives (imperatives pre-ceded by the word “please”). The polite imperative feature was represented by the n-gram set:
{please ^VB, please ^‘comma’ ^VB}.
Unigrams and Bigrams: As a different sort of baseline, we considered the results of a bag-of-words based classifier. Features used in these ex-periments consist of single words which occurred a minimum of four times in the relevant lects (Up-Speak and Down(Up-Speak) of the training set. The results of the SVM classifier, shown in line (1) of Table 2, were fairly poor. We then performed ex-periments with word bigrams, selecting as features those which occurred at least seven times in the relevant lects of the training set. This threshold for
bigram frequency minimized the difference in the number of features between the unigram and bi-gram experiments. While the bibi-grams on their own were less successful than the unigrams, as seen in line (2), adding them to the unigram features im-proved accuracy against the test set, shown in line (3).
As we had speculated that including surface-level grammar information in the form of tag n-grams would be beneficial to our problem, we per-formed experiments using all tag unigrams and all tag bigrams occurring in the training set as fea-tures. The results are shown in line (4) of Table 2. The results of these experiments were not particu-larly strong, likely owing to the increased sparsity of the feature vectors.
Binning: Next, we wished to explore longer n-grams of words or POS tags and to reduce the sparsity of the feature vectors. We therefore ex-perimented with our method of binning the indi-vidual n-grams to be used as features. We binned features by their relative frequency ratios. In addi-tion to binning, we also reduced the total number of n-grams by setting higher frequency thresholds and relative frequency ratio thresholds.
When selecting n-grams for this experiment, we considered only word n-grams and tag n-grams – not mixed n-grams, which are a combination of words and tags. These mixed n-grams, while useful for specifying human-defined features, largely in-creased the dimensionality of the feature search space and did not provide significant benefit in preliminary experiments. For the word sequences, Cross-Validation Test Set
(weighted)
Test Set (unweighted)
Features # of
features # of n-grams
Acc (%) F-score Acc (%) F-score Acc (%) F-score
(1) Word unigrams 3899 3899 55.4 .481 62.1 .567 78.9 .748
(2) Word bigrams 3740 3740 54.5 .457 56.4 .498 73.7 .693
(3) Word unigrams + word bigrams
7639 7639 51.8 .398 63.3 .576 80.7 .762
(4) (3) + tag unigrams + tag bigrams
9014 9014 51.8 .398 58.8 .515 77.2 .719
(5) Binned n-grams 8 106 83.0 .830 78.1 .781 77.2 .783
(6) N-grams from (5), separated
106 106 83.0 .828 60.5 .587 70.2 .698
(7) (5) + polite imperatives
we set an absolute frequency threshold that de-pended on class. The frequency of a word n-gram in a particular class was required to be 0.18 * nrlinks / n, where nrlinks is the number of links in each class (431 for UpSpeak and 328 for Down-Speak), and n is the number of words in the class. The relative frequency ratio was required to be at least 1.5. The tag sequences were required to meet an absolute frequency threshold of 20, but the same relative frequency ratio of 1.5.
Binning the n-grams into features was done based on both the length of the n-gram and the rel-ative frequency ratio. For example, one feature might represent the set of all word unigrams which have a relative frequency ratio between 1.5 and 1.6.
We explored possible feature sets with cross va-lidation. Before filtering for low information gain, we used six word n-gram bins per class (relative frequency ratios of 1.5, 1.6 ..., 1.9 and 2.0+), one tag n-gram bin for UpSpeak (2.0+), and three tag n-gram bins for DownSpeak (2.0+, 5.0+, 10.0+). Even with the weighted training set, DownSpeak instances were generally harder to identify and likely benefited from additional representation. Grouping features by length was a simple but arbi-trary method for reducing dimensionality, yet sometimes produced small bins of otherwise good features. Therefore, as we explored the feature space, small bins of different n-gram lengths were merged. We then employed Weka’s InfoGain fea-ture selection tool to remove those feafea-tures with a low information gain3, which removed all but eight features. The results of this experiment are shown in line (5) of Table 2. It far outperforms the bag-of-words baselines, despite significantly fewer fea-tures.
To ascertain which feature reduction method had the greatest effect on performance – binning or setting a relative frequency ratio threshold – we performed an experiment in which all the n-grams that we used in the previous experiment were their own features. Line (6) of Table 2 shows that while this approach is an improvement over the basic bag-of-words method, grouping features still im-proves results.
3
In Weka, features (‘attributes’) with a sufficiently low in-formation gain have this value rounded down to “0”; these are the features we removed.
Our goal was to have successful results using only statistically extracted features; however, we examined the effect of augmenting this feature set with the most indicative of the human-identified feature – polite imperatives. The results, in line (7), show a slight improvement in both the cross vali-dation accuracy, and the accuracy against the un-weighted test set increases to 78.9%4. However, among the weighted test sets, the highest accuracy was 78.1%, with the features in line (5).
We report the scores for cross-validation on the training set for these features; however, because the features were selected with knowledge of their per-class distribution in the training set, these cross-validation scores should not be seen as the classifier’s true accuracy.
Self-Training: Besides sparse feature vectors, another factor likely to be hurting our classifier was the limited amount of training data. We at-tempted to increase the training set size by per-forming exploratory experiments with self-training, an iterative semi-supervised learning me-thod (Zhu, 2005) with the feature set from (7). On the first iteration, we trained the classifier on the labeled training set, classified the instances of the unlabeled test set, and then added the instances of the test set along with their predicted class to the training set to be used for the next iteration. After three iterations, the accuracy of the classifier when evaluated on the weighted test set improved to
82%, suggesting that our classifiers would benefit from more data.
Impact of Cost-Sensitive Learning: Without cost-sensitive learning, the classifiers were heavily biased towards UpSpeak, tending to classify both DownSpeak and UpSpeak test instances as Up-Speak. With cost-sensitive training, overall per-formance improved and classifier perper-formance on DownSpeak instances improved dramatically. In (5) of Table 2, DownSpeak classifier accuracy even edged out the accuracy for UpSpeak. We expect that on a larger dataset behavior with un-weighted training and test data would improve.
5 Conclusions and Future Research
We presented a corpus-based statistical learning approach to modeling social power relationships and experimental results for our methods. To our
4
knowledge, this is the first corpus-based approach to learning social power lects beyond those in di-rect reporting relationships.
Our work strongly suggests that statistically ex-tracted features are an efficient and effective ap-proach to modeling social information. Our methods exploit many aspects of language use and effectively model social power information while using statistical methods at every stage to tease out the information we seek, significantly reducing language-, culture-, and lect-specific engineering needs. Our feature selection method picks up on indicators suggested by sociolinguistics, and it also allows for the identification of features that are not obviously characteristic of UpSpeak or Down-Speak. Some easily recognizable features include:
Lect Ngram Example
UpSpeak if you “Let me know if you need any-thing.”
“Please call me if you have any questions.”
Down-Speak
give me “Read this over and give me a call.”
“Please give me your comments next week.”
On the other hand, other features are less intuitive:
Lect Ngram Example
UpSpeak I’ll, we’ll “I’ll let you know the final re-sults soon”
“Everyone is very excited […] and we’re confident we’ll be successful”
DownSpeak that is, this is
“Neither does any other group but that is not my problem” “I think this is an excellent let-ter”
We hope to improve our methods for selecting and binning features with information theoretic selection metrics and clustering algorithms.
We also have begun work on 3-way, UpSpeak/ DownSpeak/PeerSpeak classification. Training a multiclass SVM on the binned n-gram features from (5) produces 51.6% cross-validation accu-racy on training data and 44.4% accuracy on the weighted test set (both numbers should be com-pared to a 33% baseline). That classifier contained no n-gram features selected from the PeerSpeak class. Preliminary experiments incorporating PeerSpeak n-grams yield slightly better numbers.
However, early results also suggest that the three-way classification problem is made more tractable with cascaded two-way classifiers; feature selec-tion was more manageable with binary problems. For example, one classifier determines whether an instance is UpSpeak; if it is not, a second classifier distinguishes between DownSpeak and PeerSpeak. Our text classification problem is similar to senti-ment analysis in that there are class dependencies; for example, DownSpeak is more closely related to PeerSpeak than to UpSpeak. We might attempt to exploit these dependencies in a manner similar to Pang and Lee (2005) to improve three-way classi-fication.
In addition, we had promising early results for classification of author-recipient links with 200 to 500 words, so we plan to explore performance im-provements for links of few words.
In early, unpublished work, we had promising results with generative model-based approach to SPM, and we plan to revisit it; language models are a natural fit for lect modeling. Finally, we hope to investigate how SPM and SNA can enhance one another, and explore other lect classification prob-lems for which the ground truth can be found.
Acknowledgments
Dr. Richard Sproat contributed time, valuable in-sights, and wise counsel on several occasions dur-ing the course of the research. Dr. Lillian Lee and her students in Natural Language Processing and Social Interaction reviewed the paper, offering valuable feedback and helpful leads.
Our colleague, Diane Bramsen, created an ex-cellent graphical interface for probing and under-standing the results. Jeff Lau guided and advised throughout the project.
We thank our anonymous reviewers for prudent advice.
This work was funded by the Army Studies Board and sponsored by Col. Timothy Hill of the United Stated Army Intelligence and Security Command (INSCOM) Futures Directorate under contract W911W4-08-D-0011.
References
Penelope Brown and Stephen C. Levinson. 1987. Po-liteness: Some universals in language usage. Cam-bridge: Cambridge University Press.
Eric Breck, Yejin Choi and Claire Cardie. 2007. Identi-fying expressions of opinion in context. In Proceedings of the Twentieth International Joint Conference on Artificial Intelligence (IJCAI-2007)
CALO Project. 2009. Enron E-Mail Dataset. http://www.cs.cmu.edu/~enron/.
Yejin Choi and Claire Cardie. 2008. Learning with compositional semantics as structural inference for subsentential sentiment analysis. Proceedings of the Conference on Empirical Methods in Natural Lan-guage Processing. Honolulu, Hawaii: ACM. 793-801.
Yejin Choi and Claire Cardie. 2009. Adapting a polarity lexicon using integer linear programming for domain-specific sentiment classification. Empirical Methods in Natural Language Processing (EMNLP).
Christopher P. Diehl, Galileo Namata, and Lise Getoor. 2007. Relationship identification for social network discovery. AAAI '07: Proceedings of the 22nd Na-tional Conference on Artificial Intelligence.
Bonnie Erickson, et al. 1978. Speech style and impres-sion formation in a court setting: The effects of 'pow-erful’ and 'powerless' speech. Journal of Experimental Social Psychology 14: 266-79.
Norman Fairclough. 1989. Language and power. Lon-don: Longman.
Mark Hall, Eibe Frank, Geoffrey Holmes, Bernhard Pfahringer, Peter Reutemann, and Ian H. Witten. 2009. The WEKA data mining software: An update. SIGKDD Exploration (1): Issue 1.
JHU Center for Imaging Science. 2005. Scan Statistics on Enron Graphs. http://cis.jhu.edu/~parky/Enron/
Soo-min Kim and Eduard Hovy. 2004. Determining the Sentiment of Opinions. Proceedings of the COLING Conference. Geneva, Switzerland.
Francois Mairesse and Marilyn Walker. 2006. Auto-matic recognition of personality in conversation. Pro-ceedings of HLT-NAACL. New York City, New York.
Galileo Mark S. Namata Jr., Lise Getoor, and Christo-pher P. Diehl. 2006. Inferring organizational titles in online communication. ICML 2006, 179-181.
Andrew McCallum, Xuerui Wang, and Andres Corrada-Emmanuel. 2007. Topic and role discovery in social networks with experiments on Enron and academic e-Mail. Journal of Artificial Intelligence Research 29.
Ryan McDonald, Kerry Hannan, Tyler Neylon, Mike Wells, and Jeff Reynar. 2007. Structured models for
fine-to-coarse sentiment analysis. Proceedings of the ACL.
David Morand. 2000. Language and power: An empiri-cal analysis of linguistic strategies used in supe-rior/subordinate communication. Journal of Organizational Behavior, 21:235-248.
Frederick Mosteller and David L. Wallace. 1964. Infer-ence and disputed authorship: The Federalist. Addi-son-Wesley, Reading, Mass.
Jon Oberlander and Scott Nowson. 2006. Whose thumb is it anyway? Classifying author personality from we-blog text. Proceedings of CoLing/ACL. Sydney, Aus-tralia.
Bo Pang, Lillian Lee, and Shivakumar Vaithyanathan. 2002. Thumbs up? Sentiment classification using ma-chine learning techniques. Proceedings of EMNLP, 79–86.
Bo Pang and Lillian Lee. 2005. Seeing stars: Exploiting class relationships for sentiment categorization with respect to rating scales. Proceedings of the ACL.
John Platt. 1998. Sequential minimal optimization: A fast algorithm for training support vector machines. In Technical Report MST-TR-98-14. Microsoft Re-search.
Delip Rao and Deepak Ravichandran. 2009. Semi-supervised polarity lexicon induction. European Chapter of the Association for Computational Lin-guistics.
Efstathios Stamatatos. 2009. A survey of modern au-thorship attribution methods. JASIST 60(3): 538-556.
Carol Strapparava and Rada Mihalcea. 2008. Learning to identify emotions in text. SAC 2008: 1556-1560
Hiroya Takamura, Takashi Inui, and Manabu Okumura. 2005. Semantic Orientations of Words using Spin Model. Annual Meeting of the Association for Com-putational Linguistics.
Ian H. Witten and Eibe Frank. 2005. Data Mining: Practical Machine Learning Tools and Techniques. Morgan Kauffman.