Application of the
“
GUCHI
”
Technique in Radiographic Testing
for Flaw Sizing of Pipe
Toshibumi Kashiwa, Shinichi Higuchi
+and Norikazu Ooka
+Nuclear Systems QA Department, Hitachi-GE, Nuclear Energy, Ltd., Hitachi 319-1221, Japan
“GUCHI”(Geometric Unravel for Crack Height Image) technique is one of the stereo-radiography methods forflaw sizing in radiographic testing. The AN (Application of Nondestructive Testing techniques for industrial fields) committee in the JWES (The Japan Welding Engineering Society) carried out the experiment on this technique. The results were reported at FENDT 2002 and APCNDT 2003 and 2006 with data on the steel plates and pipes including fatigue cracks and EDM slits. Theflaw sizing by RT-GUCHI was performed in a round robin test on 6 inches stainless steel pipe which had circumferential semi-elliptical fatigue cracks with 0.2t, 0.4t and 0.6t height at the OD surface and on plate including a fatigue crack. A trial forflaw sizing of SCC was also performed.
This paper describes the fundamental of GUCHI technique, the discussion results of the accuracy forflaw sizing which was investigated before 2006 and the results of the round robin tests on test specimens with fatigue cracks. [doi:10.2320/matertrans.I-M2011849]
(Received December 4, 2009; Accepted October 29, 2011; Published January 18, 2012)
Keywords: radiographic testing,flaw sizing, fatigue crack, crack height, digitizing system, digital image
1. Introduction
When theflaw is detected during the in-service inspection of components, sizing should be performed to evaluate the flaw. ASME code Sec. XI, IWA-3000 provides requirements forflaw characterization and evaluation. The Nondestructive Testing (NDT) is expected not only for detecting but also sizing for evaluation of theflaw.
Ultrasonic Testing (UT) is suitable technique for flaw sizing. Many applications of flaw sizing have been reported regarding UT-TOFD, Phased array systems, and the Crack-tip technique. However, sometimes, the component configura-tions may give difficulty to the scanning of search unit by UT. The inherently coarse-grained metallurgical structures may preclude meaningful examinations at austenitic and dissimilar metal welds. It is supposed that UT is not always the best way for flaw sizing in practical fields. Flaw sizing technique by RT may be effective as the substitution of the sizing technique by UT.
The AN committee carried out on the experiment on the GUCHI technique which is one of the stereo-radiography methods for flaw sizing.
2. Fundamentals of GUCHI Technique
The fundamentals of this technique based on the geo-metrical calculation by two radiographic images which are taken by different angles. Baseline markers such as a small diameter copper wire are placed on the surface of tested area and X-ray or £-ray is exposed from two different positions. The sources positions are parallel to the film or imaging device. The width and length of the crack image that appears on each of the radiographs and the distances from baseline image to the tips and/or the maximum density point of crack image are measured by means of magnification. A digitizing system is used to characterize a flaw and to obtain its dimensions. The size of the crack is estimated by several
theoretical calculations utilizing the dimensional data ob-tained from the geometrical arrangement of radiographs and measured from flaw positions on each of the radiographs.
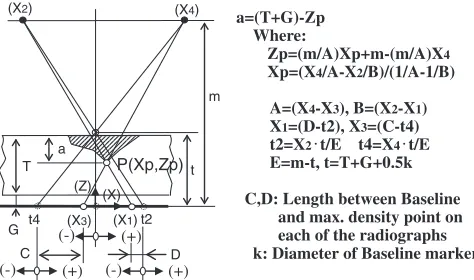
This technique can be made with two types of formations. In this technique, the X-axis is defined as the direction parallel to the crack,Y-axis is the direction transverse to the crack, andZ-axis is the direction normal to the surface of the film or imaging device.“Parallel motion withX-axis”means the sources are positioned parallel to theX-axis and“Parallel motion withY-axis”means the sources are positioned parallel to theY-axis. The exposures per one motion from a different source position must be taken at least twice so that the image of crack and the baseline marker represent simultaneously for each of the radiograph. Figure 1 shows the arrangement and the equation at the“Parallel motion withX-axis”formation. When trying to flaw sizing by “Parallel motion with
X-axis”, the length between baseline and maximum density
point at theflaw image on each of the radiographs have to be measured. If the input the data T, G, m, k and X2, X4 in Fig. 1, theflaw height will be calculated as“a”. It depends on how to measure precisely theflaw images.
The flaw image can be measured precisely due to film digitizing system. The tip points of the magnifiedflaw image and the points of both side of high density region of theflaw
a=(T+G)-Zp Where:
Zp=(m/A)Xp+m-(m/A)X4 Xp=(X4/A-X2/B)/(1/A-1/B)
A=(X4-X3), B=(X2-X1) X1=(D-t2), X3=(C-t4) t2=X2 t/E t/E E=m-t, t=T+G+0.5k C,D: Length between Baseline
and max. density point on each of the radiographs k: Diameter of Baseline marker
T
G
(X4)
t m (X2)
t4 (X1)
P(Xp,Zp)
(X3) a
(+) (-)
(X) (Z)
t2
C D
(+)
(-) (-) (+)
t4=X4
Fig. 1 Basic arrangement and equation at“Parallel motion withX-axis”.
+Present address: The Japan Welding Engineering Society, Tokyo 101-0025, Japan
Special Issue on APCNDT 2009
[image:1.595.308.545.315.455.2]image can be determined and the distance between baseline and the each point can be observed from digital data. Then the value of X5 to X12 in Fig. 2 can be obtained by the calculations as same as the equation in Fig. 1. The flaw height “a” can be calculated as the height of a trapezoid. Personal computer (PC) software was developed for real-time calculations of theflaw size. Figure 3 shows theflaw image of fatigue crack which displayed on the monitor. The flaw length and distance between baseline and the edge of high density region can be also measured. Therefore the points which are needed in GUCHI calculation as input data are obtained easily.
“Parallel motion with Y-axis”will be made as same way withX-axis and will be considered to be suitable for sizing of wide-gapflaws. In case of theflaw which is detected at curved section such as circumferential welded seams of piping or pressure vessels, it seems that the GUCHI technique will also be applicable with the polar coordinates analytic geometry.
3. Flaw Sizing Accuracy of GUCHI
Several experiments which applied GUCHI technique on steel plates and pipes have performed. Fatigue cracks and Electric Discharge Machining (EDM) slits were installed in the plates and pipes. The results compared with UT-TOFD, Phased Array and Crack Tip technique has been reported at FENDT 2002,1) APCNDT 2003 and 2006.2,3) Those were
investigation of the flaw sizing regarding the accuracy of GUCHI.
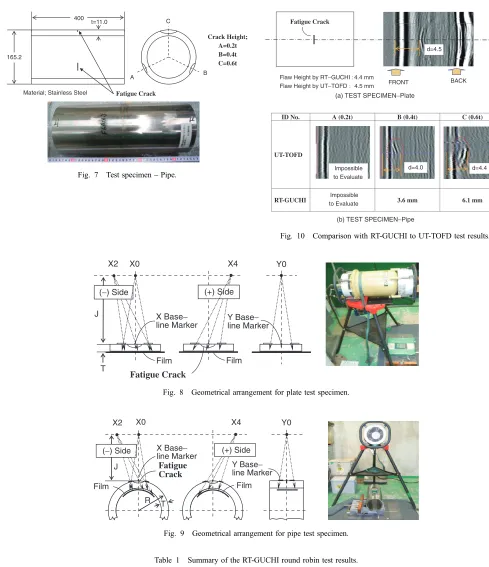
A round robin test was carried out on 6 inches and 10 inches stainless steel pipes including circumferential semi-elliptical EDM slits with 0.2t, 0.4t and 0.6t depth at inside of the pipe. Figure 4 shows the configuration and size of test pipes. The test pipes of No. 1 and No. 2 are 6 inches and 10 inches in diameter respectively. At inside of each pipe, artificial flaws of “A”, “B” and “C” are produced by the EDM.
As conventional X-ray or £-ray equipment the radiation source and 3 types of X-rayfilms (IX50, IX80, and IX100) were used and a type of imaging plate (ST-VI) was used as imaging devices.X-axis formation andY-axis formation with double-wall technique,X-axis formation andY-axis formation with single-wall technique, and several source to object distance, offset of source position were provided for the geometrical arrangement of taking radiograph. All radio-graphic films were digitized using a Film Digitizer.
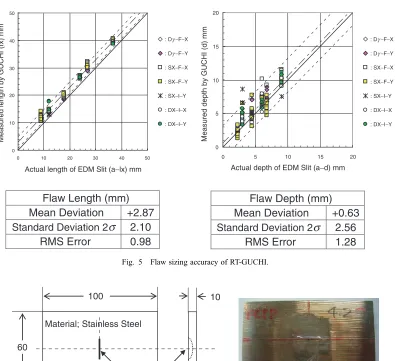
Figure 5 shows the summary of sizing results for length and depth of the EDM slits. 100 sets of input data was obtained through the round robin test. The value of horizontal axis of left diagram indicates the actual length of EDM slits, right diagram shows actual depth. And, the vertical axis indicates the length and depth measured by GUCHI. A good coincidence at actual value and measured value by GUCHI has been obtained. The digital deviations are summarized on the table. The root mean square (RMS) error of the flaw length measurement was 0.98 mm and the flaw depth measurement was 1.28 mm. The accuracy of sizing by RT-GUCHI technique shown to satisfy the requirements for Flaw Sizing on Ultrasonic Testing in ASME Code Sec XI App. VIII.4)
4. Round Robin Test for Fatigue Cracks
The AN Committee prepared a 10 mm thickness test plate and a 6 inches stainless steel test pipe which include Fatigue Cracks. A round robin test which applied GUCHI technique on those test plate and pipe was carried out. And, five different company teams of the AN Committee members participated in the round robin test.
Figure 6 shows the 10 mm thickness stainless steel plate specimen and Fig. 7 shows the 6 inches OD stainless steel pipe specimen. Those specimens included semi-elliptical fatigue clacks.
The outline of the test procedure is as followers; The geometrical arrangement of the stereo radiography is shown in Figs. 8 and 9.XandYdirection base line markers were put on the source side surface of fatigue cracks. Several case of the stereo radiography condition were tried in the round robin test that different type of conventional X-ray equipment and film types including imaging plate (IP) were used and source position X0, Y0 and several X2 dimensions, several source to film distance were given.
The test parameters for the radiography of test specimen were that 4 types of X-ray equipment, 3 types offilm, 600 to 825 mm for J,¹25,¹30,¹50,¹100, ¹150, ¹200 mm for X2, 25, 30, 50, 100, 150, 200 mm for X4.
Table 1 shows the summary of the RT-GUCHI round robin test results. The crack with 0.2t height in the 12 cases of test parameter could notfind out by RT. But GUCHI was applied to crack in 9 cases with 0.4t height for the pipe and obtained the crack images. The deviation of estimated crack length and height for the plate was 1.6 mm in average length of 17.4 mm and 0.7 mm in average height of 4.4 mm respectively. In the case of pipe, the deviation of crack-height with 0.6t was 0.7 mm in average length of 25.2 mm, and 1.16 mm in average height of 6.1 mm.
One company team carried out an additional experiment of flaw sizing by UT-TOFD technique for the round robin test specimen to compare with the sizing results. Figure 10 shows the TOFD data for the plate and pipe specimen. For the plate specimen, the flaw height “a” estimated by TOFD was 4.5 mm and “a”estimated by RT-GUCHI was 4.4 mm. For the pipe specimen, ID No.“A”(fatigue crack height is 0.2t) was impossible to evaluate theflaw height by TOFD. In the same way, that was impossible to sizing by GUCHI. At the ID No.“B”and“C”, that crack height is 0.4t or 0.6t, could be evaluated by TOFD and the result was as shown in the table in the Fig. 10. It indicates that the sizing result by RT-GUCHI was good correspondence to the UT-TOFD.
0 10 20 30 40 50
0 10 20 30 40 50
Actual length of EDM Slit (a−lx) mm
Measured
length
by GUCHI (Ix) mm
: Dγ −F−X
: Dγ −F−Y
: Dγ −F−X
: Dγ −F−Y
: SX−F−X
: SX−F−Y
: SX−I−Y
: DX−I−X
: DX−I−Y
0 5 10 15 20
0 5 10 15 20
Actual depth of EDM Slit (a−d) mm
Measured depth by GUCHI (d) mm
: SX−F−X
: SX−F−Y
: SX−I−Y
: DX−I−X
: DX−I−Y
Flaw Length (mm)
Mean Deviation
+2.87
Standard Deviation 22.10
RMS Error
0.98
Flaw Depth (mm)
Mean Deviation
+0.63
Standard Deviation 22.56
RMS Error
1.28
σ
σ
Fig. 5 Flaw sizing accuracy of RT-GUCHI.
Fatigue Crack
100Material; Stainless Steel
60
10
Fig. 6 Test specimenPlate. Unit:mm
a l
t
EDM Slit
a/t (%) a/l A 20 0.25 B 40 0.25 C 60 0.25 300
t
D
0.9 B
A
C
No. D t 1 165.2 11.0
2 267.4 15.1
Fig. 4 Configuration and size of test pipes.
BASE LINE IMAGE
5.6 6.0 −8.4
17.0
FLAW IMAGE
Fig. 3 Typicalflaw image onfilm digitizing system. INPUT: X5-12,T,G,J
F(X5-12,T,G,J)=a
OUTPUT: a (Flaw Height)
ΔD ΔD T
G J
ΔD:Density Level of Crack Image
Z1 Z2
Z3 Z4 (X4) (X2)
X5X6 X7 X8
X9 X10 X11X12
[image:3.595.299.538.71.223.2] [image:3.595.103.498.366.727.2]X2
X Base− line Marker (−) Side
X4
(+) Side
Y Base− line Marker
Fatigue Crack
T J
X0
Film
Y0
Film
Fig. 8 Geometrical arrangement for plate test specimen.
X2
X Base− line Marker (−) Side
Film
X4
(+) Side
Y Base− line Marker
Fatigue Crack
R T
J X0
Film
Y0
[image:4.595.42.531.60.627.2]Fig. 9 Geometrical arrangement for pipe test specimen.
Table 1 Summary of the RT-GUCHI round robin test results.
TP
Fatigue Crack
Nos. of Test Case and Case Nos. that
the Crackfind out
Crack Size by GUCHI (mm)
Length Height
ID No. Height Test Case
Find
-out Average Deviation Average Deviation
Plate ® 0.4t 33 33
(100%) 17.4 1.6 4.4 0.7
Pipe
A 0.2t 12 0 ® ® ® ®
B 0.4t 21 9
(43%) 17.0 0.6 3.6 0.5
C 0.6t 19 19
(100%) 25.2 0.7 6.1 3.2*
*2·=1.16 mm
400
Material; Stainless Steel t=11.0
165.2
Fatigue Crack
Crack Height; A=0.2t B=0.4t C=0.6t
C
B A
Fig. 7 Test specimenPipe.
ID No. A (0.2t) B (0.4t) C (0.6t)
UT-TOFD
RT-GUCHI 3.6 mm 6.1 mm
d=4.5
FRONT BACK
Flaw Height by RT−GUCHI 4.4 mm Flaw Height by UT−TOFD 4.5 mm
Fatigue Crack
(a) TEST SPECIMEN−Plate
d=4.0 d=4.4
Impossible to Evaluate
Impossible to Evaluate
[image:4.595.305.547.68.283.2](b) TEST SPECIMEN−Pipe
[image:4.595.135.464.476.582.2] [image:4.595.45.551.629.776.2]Array UT system is shown at bottom side. The estimated crack height “a” by GUCHI is 5.1 and 5.3 mm by Phased Array. From those results, it is considered that the sizing capability of GUCHI technique is comparable to that of UT under the condition of this experiment.
5. Conclusion
The AN committee in the JWES carried out the experiment on application of RT-GUCHI technique which is one of the stereo-radiography methods forflaw sizing. The accuracy of sizing by RT-GUCHI technique satisfied the requirements of flaw sizing in the ASME Code Sec XI App. VIII. The technique was applied and confirmed by the round robin test
for sizing of natural like fatigue cracks in the plate and the pipe. And, it has been also applied for sizing the SCC. Both of the UT-TOFD for the fatigue cracks and the UT-Phased Array for SCC have been performed to compare with the results of flaw sizing by the RT-GUCHI. It was confirmed that RT-GUCHI technique is applicable for flaw sizing for over 0.45t-height fatigue cracks or SCC in steel components as same as sizing by UT in practicalfields.
Acknowledgement
Finally, authors would like to appreciate the members of the AN committee for their useful comments and support.
REFERENCES
1) S. Higuchi, M. Okudaira, Z. Makihara and N. Ooka: 6th FENDT, Tokyo, Japan, Oct., (2002) pp. 337342.
2) S. Higuchi, Z. Makihara, Y. Nonaka and N. Ooka:Key Eng. Mater.270 273(2004) 13161323.
3) T. Kashiwa, S. Higuchi and N. Ooka: 12th APCNDT, Auckland, New Zealand, Nov., (2006) http://www.ndt.net/article/apcndt2006/papers/ 21.pdf
4) ASME Code 2004 Sec. XI, Division I, Appendix VIII, Sup. 2 Perform-ance Demonstrations for Ultrasonic Examination Systems.
Source Position:X0=0,Y=133 Source Position:X2=−200,Y=133
X-BASE LINE 25.5
6.0
5.5
33.0 3.0
Y−BASE LINE
SCC
X-BASE LINE
Y−BASE LINE
4.9
3.0
25.4
30.3 5.6
SCC
Fig. 13 Sketch on the radiographic image of SCC.
Length, Angle, Height lx
(mm) ld (mm)
2θθ (°°)
a (mm)
l1 (mm) 26.4 28.2 22 5.1 8.4
OUTPUT DATA BY RT-GUCHI
OUTPUT DATA BY UT-PHASED ARRAY
l1 a
ld
lx 2θ
BOTTOM TIP
[image:5.595.326.521.73.372.2]d=5.3
Fig. 14 Sizing results of SCC estimated by RT-GUCHI and UT-PHA. 789
X2=−200 X0=0
(X) (Z) X BASE LINE
MARKER
FILM SCC
Y=133
(Y) (Z) Y BASE LINE
MARKER WELD
SCC
Fig. 12 Geometrical arrangement for sizing of SCC. INSIDE
VIEW
SCC 11
SCC
TEST PIPE (OD=6B) Circumferential
Weld
[image:5.595.52.282.112.319.2]14.3
[image:5.595.58.281.361.495.2]