Effects of Vacuum Annealing on the Charge
Discharge Characteristics
of Eutectic Al
Si
/
Al Thin Film as Anode Material for Li-Ion Batteries
Chao-Han Wu, Truan-Sheng Lui, Fei-Yi Hung
+and Li-Hui Chen
Department of Materials Science and Engineering, National Cheng Kung University, Tainan, Taiwan 701, R. O. China
In this study, radio frequency magnetron sputtering was used to prepare eutectic AlSi/Al bi-layeredfilms as anode materials and the effect of vacuum annealing in the chargedischarge capacity characteristics at different temperatures were discussed. For the purpose of 400 nm AlSi film can possess the lowest crystallization temperature, the eutectic composition was adopted. The pre-sputtered 40 nm Al thinfilm not only reduced the resistivity of the composite anodefilm, but also diffused to prevent peeling between the AlSifilms and Cu foils after vacuum annealing. While the annealing temperatures were elevated (RT³400°C), indexes of crystalline (IOC) and resistivities of specimens were changed. The properties of materials containing ASEC-400 (at RT) and ASEC-200 (at 55°C) had outstanding chargedischarge characteristics.
The morphology transformation at the surface and cross section resulted from annealing at different temperatures and cycling testing were examined by Focus Ion Beam (FIB). Besides, the relationship between cycling performances and electrochemical characteristics of AlSi/Al film anodes were also investigated by Cyclic Voltammetry and Electrochemical AC Impedance Spectroscopy (EIS).
[doi:10.2320/matertrans.M2012086]
(Received March 6, 2012; Accepted June 13, 2012; Published August 25, 2012)
Keywords: aluminumsilicon, anode material, chargedischarge
1. Introduction
Many alloy systems are being developed to replace graphite as the anode in lithium rechargeable batteries due to their better capacity (SnCu14)· LiSn5)· CuSb6)· Mg Si7)· LiSi8)). Si-based intermetallic compounds possess marvelous capacity (Li4.4Si: 4200 mAh/g) and have been investigated continuously. In addition to Si, Al has become attractive gradually owing to its excellent capacity (Li2.25Al: 2235 mAh/g). Comparing with Si, the ratio of Li/Al is 2.25 when the maximum storage for Li of Al has been reached. It means that Al suffers less impact resulted from the inserting of Li ions than Si does. But Al still hasn’t possessed well cycleability yet and low irreversible capacity without any doping because the anode has to be inserted/extracted by Li ions at a single voltage. Doping the second element in Al can improve the above problems very well. Some Al-based system like AlC,9)AlFe10)and AlSn11)has been revealed so far.
On account of the above mentioned reasons, the anode material was prepared by sputtering Al-based binaryfilm on the Cu foil. Si was adopted as the second element because of its wonderful capacity. The main lithiation product of Si is the IMC, Li22Si5. Comparing that of Al(LiAl), Si has to undergo more violent volume variation (4.4 : 1 vs. 1 : 1) during main lithiation/delothiation process than Al does. Although Si is more unfavorable as the anode matrix mate-rial than Al is, it’s still a suitable choice for the second element in the active-active system like AlSi. The system won’t only suffer too much volume variation at a single voltage, but also let both elements contribute to overall capacity.
According to the Ref. 12), it revealed that Al filled the chinks at the Al/Cu interface after annealing. It means that enhancing interface joint and the vertical conductivity of the
anode material are reached after annealing. That’s the reason why the 40 nm pre-sputtered Al layer was adopted. Besides, this paper used lower annealing temperatures to elevate IOC of samples because the AlSi eutectic-composed materials possess lower crystallization temperature. Also, the relation-ship among IOC, resistivities, cycled morphorlogies and electrochemical properties were investigated.
2. Experimental Procedures
In this study, Al/eutectic AlSi dual layered films were sputtered on 10 µm Cu foil. The thicknesses of unary and binaryfilm were 40 and 400 nm. ASEC-AD (AlSi(400 nm)/ Al(40 nm)/Cu(10 µm)) is defined as the as-deposited sample. Some ASEC-AD films were annealed at 200 and 400°C for 1 h in vacuum and are designated ASEC-200 and ASEC-400. Each film was cut for the chargedischarge testing. The composition of the electrolyte was LiPF6+EC+DEC (EC : DEC=1 : 1 vol).
The micro-morphology and interface characteristics of the pre- and post-cycling samples were investigated by SEM and FIB (focused ion beam). The phases and IOC of the un-annealed and annealed films were analyzed by thin-film XRD. The angle of incidence was 1°. The velocity of scanning was 4°/min and the range was from 20 to 100°. A constant current rate, 0.1 C, was used for electrochemical test with 20 cycles (1st10th at room temperature, 11th20th at high temperature, 55°C). The voltage was limited to the range 0.011.5 V. Electrochemical AC Impedance Spec-troscopy (EIS) analysis was conducted at the voltage of 0.01 V as the end of 10th and 20th lithiation stage. The potential amplitude was set to be 10 mV and the scanning frequency was ranged from 100 kHz to 10 mHz. Cyclic Voltammetry measurements were performed with the scan-ning rate of 0.05 mV/s. In addition, the resistivity was measured using a four-point probe and each datum was average of 10 test results.
3. Results and Discussion
Figure 1 shows the surface and cross-section character-istics of ASEC-AD and dense deposition are observed on images. EDS analysis on the upper binary layer of ASEC-AD is shown in Table 1. In Fig. 2, grazing-incident XRD confirmed the peaks of Al and Cu foil but the peaks of Si didn’t appear. The result also took place in some former studies. Some explanations for it are that Si within thefilm is nanostructure and its grain size is too tiny to be detected.13) The others consider that the amorphous structure of Si causes the situation.14,15) Based on the Ref. 16), the indexes of crystalline (IOC) of materials were proportional to integra-tions of XRD diffraction peaks. In Fig. 2 and Table 2, it revealed that IOC of Al within samples was raised with increased annealing temperatures. The diffraction peaks of Si
appeared after 400°C vacuum annealing. It means that the partial Si in ASEC-400 matrix transformed into the crystalline state from amorphous state.
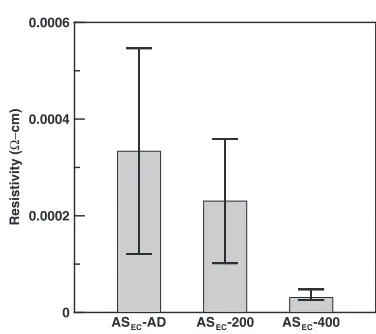
The resistivities of samples are shown in Fig. 3. IOC of thin film was inversely proportional to its resistivity.17) It revealed that the resistivity of ASEC-AD was higher than that of others. Largest standard deviation means there’s still lots of amorphous areas in as-deposited matrix. After 200°C-1 h vacuum annealing, both resistivity and standard deviation changed obviously. While 400°C-1 h vacuum annealing was carried out, not only resistivity but also standard deviation (a)
(b)
Pt
Cu foil
AlSi
Al
[image:2.595.66.272.72.467.2]Fig. 1 SEM photographs: (a) surface and (b) cross section of ASEC-AD.
Table 1 EDS analysis of AlSi layer.
Al at% Si at%
ASEC-AD 87.7 12.3
20 40 60 80
2θ
Intensity
ASEC-AD ASEC-200 ASEC-400 Al
Cu Si
[image:2.595.314.530.336.634.2]Fig. 2 GI-XRD analysis of specimens.
Table 2 Detail data of Al(111) in Fig. 2.
FWHM (°)
Average grain size (nm)
Integration area of Al(111)
ASEC-AD 0.38 21.7 108.6
ASEC-200 0.34 24.7 158.3
ASEC-400 0.40 21.6 506.6
0 0.0002 0.0004 0.0006
Resistivity (
Ω−
cm)
ASEC-AD ASEC-200 ASEC-400
[image:2.595.306.548.356.418.2] [image:2.595.331.519.451.618.2] [image:2.595.47.291.524.555.2]were reduced startlingly. Based on the above reason, it’s supposed that the area of crystalline shows the overwhelming majority in ASEC-400 matrix.
The cycling performances of specimens at different temperatures are plotted in Fig. 4. The delithiation capacity and the retention of ASEC-400 specimen were outstanding at RT but there was an evident decay in both of them at 55°C. Different from ASEC-400, ASEC-200 presented very well at higher temperature. Figure 5 shows that the three samples all had an abrupt decay with various degrees at 11th cycle in Coulombic efficiency. The ultra-low resistivity and enhanced driving force (a higher temperature is helpful to the lithium ions migration through SEI and the charge transfer) were supplied by higher temperature to make lithiation reactions go beyond the limit of ASEC-400 specimen. Appropriate IOC and resistivity may be the reasons that the ASEC-200 specimen had better chargedischarge characteristics at 55°C because they prevent sample from disintegration which overload lithiation led to.
The electrochemical behaviors of all samples were studied by Cyclic Voltammetry as shown in Fig. 6. Based on the Refs. 15, 18), the lithiation/delithiation voltage of Al is 0.2 V/0.48 V and that of Si is 0.05 V/0.3 V. ASEC-400 film and ASEC-200 film possessed more intensive redox peaks than others at different temperatures. It was implied that the two samples lithiated and delithiated more actively than others at RT and 55°C. The fact is also corresponsive in concert with their performances on capacity, retention and coulombic efficiency. In Fig. 7, it shows that both ASEC-AD
film and ASEC-200 film have more obvious redox peaks at 55°C. The main delithiation peak of ASEC-400film at 55°C decayed about 58% comparing with the specimen of RT. It indicated that it’s difficult for ASEC-400 film to delithiate at reactive voltages in this stage. The above fact could be supposed the reason why the capacity of specimen faded. Besides, the fewer potential differences between lithiation and delithiation peaks for all specimens at 55°C than those at RT. So, lower electrode polarization and higher lithium-ion diffusivity appeared in anode material at 55°C.19)
Figure 8 shows the comparison of 10th and 20th cycle’s Nyquist plots (ZAvs. ZAA) at 0.01 V. ZAand ZAAwithin the plots indicated the real and imaginary parts of the cell impedance. Nyquist plots contained an obvious semicircle in high
0 4 8 12 16 20
Cycles 0
200 400 600 800
Delithiation Capacity (mAh/g)
RT HT
ASEC-AD ASEC-200 ASEC-400
Fig. 4 Delithiation capacities as a function of cycle number.
0 4 8 12 16 20
Cycles 50
60 70 80 90 100
Coulomb Efficiency (%)
RT HT
ASEC-AD ASEC-200 ASEC-400
Fig. 5 Coulomb efficiency as a function of cycle number.
0 0.4 0.8 1.2 1.6
Potential (V) -0.0001
-5E-005 0 5E-005
Current (A)
ASEC-AD ASEC-200 ASEC-400 (a)
0 0.4 0.8 1.2 1.6
Potential (V) -0.0002
0 0.0002
Current (A)
ASEC-AD ASEC-200 ASEC-400 (b)
10th cycle at RT
20th cycle at 55°C
[image:3.595.67.275.67.274.2] [image:3.595.318.532.73.452.2] [image:3.595.66.274.318.518.2]frequency, a vague one in middle frequency and an oblique straight line in low frequency. The three parts represented the resistance of solid electrolyte interface (SEI),Rsei, the charge-transfer resistance, Rct, and Warburg impedance which reflected the solid state diffusion of Li-ions into the bulk of sample. The slope of the fitting line plotted in ZA or ZAAvs.
½¹1/2(the augular frequency) in low frequency was known
as Warburg factor ·. It’s inversely proportional to the half square of diffusion coefficient.Rseiis related to the migration of lithium-ions within SEI.20)At RT, the Rsei fitted of three samples were 165³ (ASEC-AD), 437³ (ASEC-200) and 680³(ASEC-AD). It seems that higher IOC would promote the formation of SEI and lead to obstacle to lithium-ions migration in this stage. The measurement of Rct showed the consequence: ASEC-200 > ASEC-400 > ASEC-AD. It’s suggested that crystalline Al and amorphous Si are beneficial to lithiation and delithiation. ASEC-400 film possessed the lowest · at RT and ASEC-200 film owned the least Rct at 55°C. The · values listed in Table 3, it revealed that the environment with higher temperature was helpful to lithium-ions diffusion within electrodes.
The surface morphologies of samples after charge discharge cycling test are shown in Fig. 9. The change on surface morphology owing to continuous redox reactions of ASEC-AD film is much less than those of others. Higher resistivity might disturb the migration of electrons and let lithiation-delithiation reaction was only close to surface of anodes. The ASEC-400 film transformed much more after cycling test and even appeared a bit powdered. It’s probably related to ASEC-400’s poor electrochemical performance at 55°C.
-0.4 0 0.4 0.8 1.2 1.6
Potential (V) -0.00012
-8E-005 -4E-005 0 4E-005 8E-005
Current (A)
ASEC-AD
10th cycle 20th cycle (a)
-0.4 0 0.4 0.8 1.2 1.6
Potentail (V) -0.0002
0 0.0002
Current (A)
ASEC-200
10th cycle 20th cycle (b)
-0.4 0 0.4 0.8 1.2 1.6
Potentail (V) -0.0001
-5E-005 0 5E-005
Current (A)
ASEC-400
10th cycle 20th cycle (c)
Fig. 7 Comparison of Cyclic voltammograms: (a) ASEC-AD, (b) ASEC
-200, (c) ASEC-400.
(a)
0 40 80 120
Z' (Ω) 0
40 80 120
-Z" (
Ω
)
20th at HT-0.01V ASEC-AD
ASEC-200
ASEC-400
(b)
0 400 800 1200 1600
Z' (Ω) 0
400 800 1200 1600
-Z" (
Ω
)
10th at RT-0.01V ASEC-AD
ASEC-200
ASEC-400
[image:4.595.326.526.67.447.2] [image:4.595.62.275.68.645.2]4. Conclusion
IOC of eutectic AlSi/Al dual layered film increased and their resistivities decreased obviously without ultra-high annealing temperature. The ASEC-400 film had excellent performance in cycling test at room temperature but didn’t operate well at higher temperature due to gradual destruction on the microstructure. The ASEC-200 film had higher resistivity and limited the redox reactions at RT but had huge volumetric variation at 55°C. Both enhanced driving force and appropriate resistivity had contributed to improve and stable the performance of eutectic AlSi/Al thin film anode materials.
Acknowledgements
The authors are grateful to National Cheng Kung University, the Center for Micro/Nano Science and Tech-nology (NCKU Project of Promoting Academic Excellence & Developing World Class Research Center: D101-2700) and the Chinese National Science Council for its financial support (NSC 100-2221-E-006-094; NSC 100-2622-E-006-030-CC3).
REFERENCES
1) W. Pu, X. He, J. Ren, C. Wan and C. Jiang: Electrochim. Acta50 (2005) 41404145.
2) N. Tamura, R. Ohshita, M. Fujimoto, S. Fujitani, M. Kamino and I. Yonezu:J. Power Sources107(2002) 4855.
3) K. D. Kepler, J. T. Vaughey and M. M. Thackeray:J. Power Sources 8182(1999) 383387.
4) G. X. Wang, L. Sun, D. H. Bradhurst, S. X. Dou and H. K. Liu: J. Alloy. Compd.299(2000) L12L15.
5) J. Chouvin, J. Olivier-Fourcade, J. C. Jumas, B. Simon and O. Godiveau:Chem. Phys. Lett.308(1999) 413420.
6) L. M. L. Fransson, J. T. Vaughey, R. Benedek, K. Edstrom, J. O. Thomas and M. M. Thackeray:Electrochem. Commun.3(2001) 317 323.
7) H. Sakaguchi, H. Honda, Y. Akasaka and T. Esaka:J. Power Sources 119121(2003) 5055.
8) M. Inaba, T. Uno and A. Tasaka:J. Power Sources146(2005) 473 477.
9) Z. Chen, J. Qian, X. Ai, Y. Cao and H. Yang:Electrochim. Acta54 (2009) 41184122.
10) M. J. Lindsay, G. X. Wang and H. K. Liu:J. Power Sources119121 (2003) 8487.
11) R. Z. Hu, L. Zhang, X. Liu, M. Q. Zeng and M. Zhu:Electrochem. Commun.10(2008) 11091112.
12) S. Chen, F. Ke, M. Zhou and Y. Bai:Acta Mater.55(2007) 31693175. 13) H. Guo, H. Zhao, C. Yin and W. Qiu:Mater. Sci. Eng. B131(2006)
173176.
14) H. Ahn, Y. Kim, W. Kim, Y. Sung and T. Seong:J. Power Sources163 (2006) 211214.
15) L. B. Chen, J. Y. Xie, H. C. Yu and T. H. Wang:Electrochim. Acta53 (2008) 81498153.
16) C. Y. Yang, B. C. Wang and J. D. Wu:J. Mater. Sci. Mater. Med.6 (1995) 249257.
17) C. H. Wu, F. Y. Hung, T. S. Lui and L. H. Chen:Mater. Trans.50 (2009) 381387.
18) M. J. Lindsay, G. X. Wang and H. K. Liu:J. Power Sources119121 (2003) 8487.
19) Z. Wang, G. Chen, J. Xu, Z. S. Lv and W. Q. Yang:J. Phys. Chem. Solids72(2011) 773778.
20) H. Usui, Y. Yamamoto, K. Yoshiyama, T. Itoh and H. Sakaguchi: J. Power Sources196(2011) 39113915.
ASEC-AD
ASEC-400
ASEC-200
Fig. 9 Surface observations of specimens after cycling testing.
T Rsei(³) Rct(³) ·(³Hz1/2)
ASEC-AD
RT 165 1200 250
HT 42 500 55
ASEC-200
RT 437 600 254
HT 19 8 46
ASEC-400
RT 680 830 151
[image:5.595.68.271.192.769.2]