Parallel Receiving Needle Beam Ultrasonic Testing Technique
Hajime Takada
*and Takafumi Ozeki
Instrument and Control Engineering Research Department, Steel Research Laboratory, JFE Steel Corporation, Kawasaki 210-0855, Japan
A new ultrasonic testing technique and a new test system using a transducer array have been developed. The test system works as follows: (1) Ultrasonic waves are transmitted from all the ultrasonic transducer elements in the array at the same time; and (2) By additively synthesizing time-converted ultrasound signals transformed from echo signals received by all the ultrasonic transducer elements in the array at the same time, lines of continuously focused receiving beam (receiving needle beam) are closely formed under the transducer array (parallel receiving needle beam). Also, internal flaws in a cross-section are detected at once using the parallel receiving needle beam. The results of experiments using a 50-MHz transducer array and the developed system have proven that ultra-minute internal flaws 20mmin diameter can be detected at a scan speed of 1000 mm/s. In addition, the focal zone formed is very long as compared with conventional point-focused beam forming. It is concluded that the system is suitable for simultaneous testing of a cross-section of a test object at high scanning speed.
[doi:10.2320/matertrans.M2010335]
(Received September 24, 2010; Accepted January 7, 2011; Published March 2, 2011)
Keywords: internal flaws, nonmetallic inclusion, transducer array, receiving beam, needle beam
1. Introduction
Industrial products such as metallic materials are often inspected using ultrasonic waves to ensure that there are no harmful defects in them. Typical internal flaws in steel products are nonmetallic inclusions such as aluminum oxide and calcium oxide. Many products made of steel are manufactured by applying large plastic deformation to steel materials. As nonmetallic inclusions tend to be the origin of cracks during plastic deformation, it is necessary to eliminate the inclusions to the best of our ability.1–3) In view of this
situation, we have developed various techniques for the detection of internal flaws.4–7)
In recent years, changes in industrial standards such as reduced thickness of metallic materials for lighter weight, modifications to manufacturing processes as environmental measures, and improved internal quality for longer product life, have made it necessary to evaluate ultra-minute internal defects of about 20mmin diameter throughout the length and cross section of a metallic material product. To establish technical measures to eliminate such small internal flaws, it is necessary to inspect sampled products very quickly.
The techniques employed for detecting internal defects are based on electronically scanned ultrasonic beams to achieve high-speed inspection. One of these techniques, the com-monly used linear electronic scanning,8–12)is described with
reference to Fig. 1.
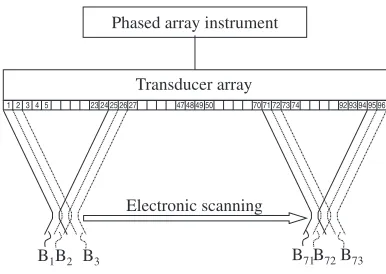
Figure 1 is a diagram showing the setup for conventional linear electronic scanning. As shown in the figure, the transducer array has 96 ultrasonic transducer elements (hereinafter simply referred to as elements) arrayed at regular intervals and assigned with element numbers 1 to 96. Some of these elements are driven as a group so as to fix the focal point in a preset position. In the example shown, the number
of elements used as a group is 24. The phased array instrument handles the transmitting and receiving of the ultrasonic beams.
Here, the transmitting and receiving of ultrasonic focused beams using the transducer array is described. First, elements 1 to 24 are driven as a group so that a transmitting and receiving ultrasonic beam B1 with a focal point (also called
focus) is formed on the center line of elements 1 to 24. Next, elements 2 to 25 are driven as a group so that a transmitting and receiving ultrasonic beam B2with a focal point is formed
on the center line of elements 2 to 25. Similarly, elements to be driven are shifted by one element. Finally, elements 73 to 96 are driven so that a transmitting and receiving ultrasonic beam B73 is formed. In this operation, a test object is
electronically scanned by ultrasonic beam at intervals equal to the element arrangement interval. The control necessary for transmitting and receiving of the above-described focused ultrasonic beams and for electronic scanning is achieved through the use of the phased array instrument connected to the transducer array. Focusing of transmitted ultrasonic beams is made possible by changing the timing of the electric pulse applied to each element to transmit ultrasonic waves in the group of elements. Focusing of receiving beams can be achieved by delaying the signals received by the group of
12 3 4 5 23 24 25 2627 47484950 7071727374 9293949596
B1B2 B3 B71B72B73
Transducer array Phased array instrument
Electronic scanning
Fig. 1 Conventional linear electronic scanning.
*Present address: Non-destructive Inspection Technology Department, Instrument System Division, JFE TECHNO-RESEARCH CORPORA-TION, Chiba 260-0835, Japan
[image:1.595.329.522.331.468.2]elements, element by element, by a specific time, and then adding them.
In order to detect the small internal flaws without any oversights, the measuring pitch in the test must be below 0.1 mm. The repetition of electronic switching in the above-described linear electronic scanning is about 40 kHz at maximum. Then, even in a typical case, it takes over 1 ms to complete one entire scan. Therefore, in order to test the object without any oversights, the scan speed of the trans-ducer array in the transverse direction to its arrangement must be below 100 mm/s.
Moreover, in order to inspect throughout the test object, it is necessary to change the focal position along the depth direction of the test object. Completing this test takes much longer than completing one entire scan mentioned above.
For the purpose of shortening the lengthy test time accompanying the change in focal position, the Dynamic Depth Focusing (DDF) technique13,14)has been used. In this
technique, a single focal law is applied at transmission, but multiple subsequent delay laws are applied on reception (multiple receiving beam focal points), forming a long and thin pulse-echo focal spot. However, there remains the unavoidable time consumption due to the linear electronic scanning process.
Recently, a new ‘‘Volume Focusing’’ method was pro-posed.15,16) The technique proposes speeding up the cross-sectional inspection of a test object. Volume Focusing consists of firing all elements of the transducer array, collecting each individual signal from the elements of the transducer array, and mathematically processing all signals combined together. With a linear array, as only one trans-mitted pulse irradiates through the cross section, it is possible by calculation to form the receiving beams that inspect this cross section. The calculation is reportedly done in real time in the electronics.
However, in forming many receiving beams with their focal points set throughout the cross section by using all the received signal data stored in the waveform memory, it is necessary to sequentially shift the focal depth. This process is time consuming. For example, a cross-sectional inspection ends in 1 ms. Even by using this technique, the scan speed of the transducer array in the transverse direction to its arrangement is 100 mm/s at most.
This paper proposes a new ultrasonic array method for testing an object efficiently in order to dramatically increase the volume being tested for a given time.
2. Flaw Detection Method
2.1 Receiving beam
Before starting the explanation of our developed new method, a concept of a receiving beam is shown here. Referring again to Fig. 1, each of ultrasonic beams Bi
(i¼1;2;. . .;73) is consists of a physical transmitting beam and a virtual receiving beam. The virtual receiving beam cannot be recognized in the testing using a single element probe. In the testing using ultrasonic phased array, however, the existence of the receiving beam can be recognized because of the focal law that is used in synthesizing the received signal and forming the receiving beam can be
made independently of forming the transmitting beam. The receiving beam, however, does not exist physically. It is only possible that the ultrasound signal is received by using the receiving beam.
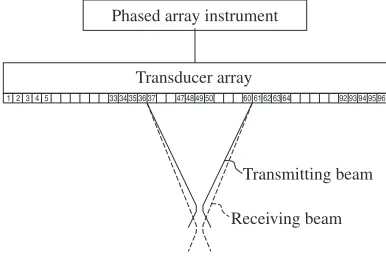
Figure 2 shows an example of forming the receiving beam whose focal length is different from that of the transmitting beam. By setting different time-delay values between the focal law applied to forming the transmitting beam and that applied to forming the receiving beam, the focal length of the receiving beam can be varied independently from that of the transmitting beam. The dynamic depth focusing (DDF) technique13,14)mentioned above utilizes the separation of the ultrasonic beam into the transmitting beam and the receiving beam. The volume focusing technique15,16)also utilizes the separation, although focused transmitting beams are not used in the technique.
2.2 Single receiving needle beam formation
In the following description, for the sake of simplicity, testing is assumed to be performed in a single medium. In a case with two kinds of media such as in immersion flaw detection of a metallic material, it goes without saying that the refraction of ultrasonic waves is considered in the calculation of distance.
Figure 3 shows the fundamentals of forming multiple receiving beam focal points as the relative technique to our developed new method. In the example, eleven receiving beam focal points (designated by arrows within the distance range of FRS to FRE from the transducer array) are to be
discretely formed in water using 24 consecutive elements along the direction perpendicular to the transducer array. Receiving beam focal points are formed in water using consecutive elements fromi12toiþ11. As the receiving beam focal points are set under the intermediate point betweeni1andi, the elements nearest to the focal points arei1andi. The diagram in the upper part of Fig. 3 shows the travel time T of ultrasound from each focal point to each element in the transducer array. As shown in the figure, the travel timeTincreases according to the distance from the element other than elementi1and elementiand element
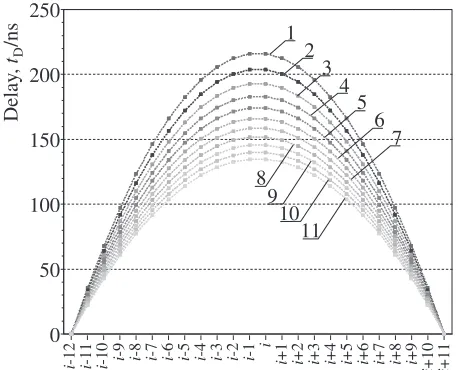
i1 or element i, whereas the increment in travel time becomes smaller as the focal point moves away from the transducer array. Figure 4 shows the calculated delay time applied to the signals received by each element for forming the 11 receiving beam focal points shown in Fig. 3. The delay
12 3 4 5 33 34 35 3637 47484950 6061626364 9293949596
Transmitting beam Transducer array
Phased array instrument
Receiving beam
[image:2.595.329.522.74.203.2]time also becomes smaller as the focal point moves away from the transducer array. Thus, forming the 11 receiving beam focal points shown in Fig. 3 is a complex process due to the need for a control for adopting 11 focal laws. It is, however, thought to be important that the delay time seems to be a monotonic function of the distance between the focal point and the transducer array. In attempting to remove the complexity mentioned above, a breakthrough was made.
Figure 5 shows a setup in which a receiving beam focal point is formed at a distance ofFRfrom the transducer array.
Let us take the relationship between the ultrasound signal received by element i12 and that received by element
i1as an example. The travel timeTi12 of the ultrasound
traveling from the focal point to elementi12is expressed as
Ti12¼
ffiffiffiffiffiffiffiffiffiffiffiffiffiffiffiffiffiffiffiffiffiffiffiffiffiffiffiffiffiffiffiffiffiffiffiffi
FR2þ ðp11:5Þ2
q
=CW; ð1Þ
where p is the element pitch and CW is the ultrasound
velocity in water. The travel time Ti1 of the ultrasound
traveling from the focal point to elementi1is expressed as
Ti1¼
ffiffiffiffiffiffiffiffiffiffiffiffiffiffiffiffiffiffiffiffiffiffiffiffiffiffiffiffiffiffiffiffiffiffi
FR2þ ðp0:5Þ2
q
=CW ð2Þ
The ratio of the travel time Ti12 to the travel time Ti1 is
written as
Ti12=Ti1¼
ffiffiffiffiffiffiffiffiffiffiffiffiffiffiffiffiffiffiffiffiffiffiffiffiffiffiffiffiffiffiffiffiffiffiffiffi
FR2þ ðp11:5Þ2
q . ffiffiffiffiffiffiffiffiffiffiffiffiffiffiffiffiffiffiffiffiffiffiffiffiffiffiffiffiffiffiffiffiffiffi
FR2þ ðp0:5Þ2
q
¼
ffiffiffiffiffiffiffiffiffiffiffiffiffiffiffiffiffiffiffiffiffiffiffiffiffiffiffiffiffiffiffiffiffiffiffiffiffi
FR2þ ðp11:5Þ2 FR2þ ðp0:5Þ2
s
: ð3Þ
As shown in Fig. 6, the ratio Ti12=Ti1 is a monotonic
decreasing function of the distance FR. In this calculation,
the ultrasound velocity in water is 1500 m/s, the element pitch pis 0.2 mm, andFRis changed from 8 to 13 mm.
Assuming that there are multiple sound sources within the range of distance fromFRStoFREfrom the transducer array
on the line FL in Fig. 5 and they emit ultrasound at the same time, the time interval of each ultrasound signal received by element i12 would be shorter than that received by element i1. It can be said that the ultrasound signal received by element i12 is compressed in terms of the receiving timing compared with that received by element
i1. Inversely, by stretching the time axis of the ultrasound signal received by elementi12based on eq. (3), the time interval of each ultrasound signal received by elementi12 can be made identical to those received by element i1. After time-axis stretching the ultrasound signal received by element i12 (time-axis stretched ultrasound signal), the ultrasound signal come from the range of distance fromFRS
toFREfrom the transducer array on the line FL (focal range)
is extracted from the time-axis stretched signal (hereafter the process referred to as time-axis converting or time-axis
Transducer array
FRS
FRE
di-1
di-12
T
ra
v
el time,
T
/
µ
s
5.0 5.5 6.0 6.5 7.0 7.5 8.0 8.5 9.0
i
-12 i-11 i-10 i-9 i-8 -7i i-6 i-5 i-3 i-2 i-1
i
i
+1 i+2 i+3 i+4 +5i i+6 i+7 i+8 i+9
i
+10 i+11
i
-4
FRS = 8 mm
FRE = 13 mm
Water
1 2 3 4 5 6 7 8 9 10 11
12 34 56 78 910 11
. . . .
Fig. 3 Schematic of the formation of 11 receiving beam focal points using a transducer array.
Delay
,
tD
/ns
0 50 100 150 200 250
i
-12 i-11 i-10 i-9 i-8 i-7 i-6 i-5 i-3 i-2 -1i i i+1 i+2 i+3 i+4 i+5 i+6 i+7 i+8 i+9
i
+10 i+11
i
-4
1 2
3 4
5 6
7
8 9
10 11
Fig. 4 Calculated delay time for the formation of 11 receiving beam focal points using a transducer array.
Transducer array
i–12 i+11
Element pitch: p
FR
Distance di-12= (FR2+(p × (i–(i–12)–0.5))2)0.5 Distance di-1= (FR2+(p × (i–(i–1)–0.5))2)0.5
FRS
FRE
di-1
di-12
i–1 i
FL
. . . .
[image:3.595.319.534.72.238.2] [image:3.595.55.284.409.594.2]conversion). The extracted signal and the ultrasound signal received from the focal range by element i1 can be phased within the focal range. The same goes for elements other thani1andi. By applying the time-axis conversion to every sampled ultrasound signal received by an element other thani1andi, all the ultrasound signals received by elementsi12toiþ11can be phased. In other words, the phases of all the ultrasound signals can always be adjusted to each other even if the distanceFRbetween the focus and the
transducer array changes. This receiving beam can be con-sidered as a needle beam localized within a narrow region centered on the dashed-dotted line. Therefore, one receiving needle beam that has continuous focus along the direction perpendicular to the transducer array can be formed.
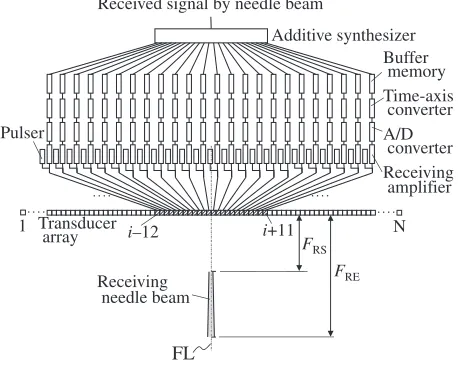
Figure 7 shows a simplified setup in which a single receiving needle beam is formed and localized within a narrow region along the dashed-dotted line FL by using consecutive 24 elements in the transducer array. The specific operation is as follows. Ultrasound is transmitted from all elements from 1 to N in the transducer array. Ultrasonic reflected signals (echoes) from the test object are received using all elements from 1 to N of the transducer array. The ultrasonic signals received by elements i12toiþ11 are amplified by the receiving amplifiers and are then converted into digital signals by the A/D converter. The time-axis converters work under instructions (time-axis conversion relationships), which are pre-set by the controller, necessary for fixing the receiving needle beam within the range of distance from FRS to FRE from the transducer array (focal
range). As the abovementioned function, the time-axis converters i12 to iþ11 convert the time axes of ultra-sound signals received by the elements other than the nearest element(s) to the receiving needle beam and send them to the buffer memories. Signals of the nearest element received from the focal range are sent as they are. The signals temporarily held in the buffer memoriesi12toiþ11are sent to the additive synthesizer for processing. In this way, an ultrasound signal received using the single receiving needle beam formed between the distancesFRSandFREis obtained.
For comparison, the method for inspecting within the range of distance fromFRStoFREfrom the transducer array
on the line FL (focal range) using consecutive 24 elements in the transducer array by use of the volume focusing technique is shown in Fig. 8. Like the developed method, ultrasound is transmitted from all elements from 1 to N in the transducer array and ultrasonic reflected signals (echoes) from the test object are received using all elements from 1 to N of the transducer array. For inspecting within the focal range, the ultrasonic signals received by elements i12 to iþ11 are amplified by the receiving amplifiers and are then converted into digital signals by the A/D converter. The digitized signals are next stored in the 2-dimentional (2D) waveform memory. The received ultrasound signal using the receiving beam with its focal points set within the focal range is made by using all the received signal data stored in the waveform memory. With every digitized signal received by the nearest element to the line FL, digitized signals received by the elements other than the nearest
FRS = 8 mm
FRE = 13 mm
In Water
p = 0.2 mm
1.05
1.04
1.03
1.02
1.01
1.00
8.0 9.0 10.0 11.0 12.0 13.0
Focal length, FR/mm
Ti-12
/
Ti-1
Fig. 6 Relationship between the ratioTi12=Ti1and focal lengthFR.
Received signal by needle beam
A/D converter Time-axis converter Buffer
memory Additive synthesizer
Pulser
Receiving amplifier
Transducer
array i–12 i+11F
RS
FRE
1 N
Receiving needle beam
FL
....
.... ....
....
Fig. 7 Setup for single needle beam formation.
One received signal
A/D converter 2D memory
Pulser
Receiving amplifier
Transducer array
i–12 i+11
FRS FRE
1 N
Scan Synthesizer
T
ime
FL
. . . .
.... ....
[image:4.595.66.269.73.258.2] [image:4.595.313.542.76.259.2] [image:4.595.314.541.193.536.2]element are picked up on the basis of the focal law by scanning the waveform memory and then digitized signal received by the nearest element and digitized signals picked up in above-mentioned process are summed up. Thus, the ultrasound signal received by using the receiving beams with their focal points set throughout the focal range is obtained. As it is, however, necessary to scan the 2D waveform memory in order to sequentially shift the focal depth, the process used in the volume focusing technique is pretty time-consuming.
In the developed technique, as described above, received ultrasound signals are processed in real time so as to be used for forming the receiving beam. Therefore, there is no need to scan the waveform memory, and the processing speed can be significantly improved.
2.3 Parallel receiving needle beam formation
Figure 9 shows a simplified setup in which parallel receiving needle beams are formed. Many receiving needle beams can be formed contiguously at the same time under the transducer array by making use of the single receiving needle beam formation mentioned above. The set of receiving needle beams can be referred to as a receiving needle beam curtain. Let N be the number of elements of the transducer array, and letnbe the number of elements used for forming the receiving beams.Nnþ1 receiving needle beams can be formed in such a case.
For the sake of simplicity, the example in Fig. 9 shows the formation of three receiving needle beams using 24 elements (n¼24). The three beams are formed under the intermediate position between elementsi13andiþ10(along the line FLi1), between elementsi12andiþ11(along the line
FLi), and between elementsi11andiþ12(along the line
FLiþ1). In the following description, FL denotes the whole set
of the line along which the receiving needle beams are formed, NBi1denotes the receiving needle beam formed by
elementsi13toiþ10, NBidenotes the receiving needle
beam formed by elements i12 to iþ11, and NBiþ1
denotes the receiving needle beam formed by elementsi11 toiþ12, respectively.
The operations of the transducer array, pulser, receiving amplifier, and A/D converter are the same as those described with reference to Fig. 7. Since an ultrasound signal received by one element of the transducer array is used for forming 24 receiving needle beams at the same time, it is necessary to hold 24 time-axis-converted signals together in a buffer memory connected to each element. Therefore, each buffer memory is divided into 24 sub-memories BMm
j (m¼
1;2;. . .;23;24;jdenotes the number given to each receiving needle beam). The number of sub-memories in the buffer memory corresponds to the number of elements that are used for forming one receiving needle beam. The time-axis converter generates 24 time-axis-converted signals from the ultrasound signals received, according to the distance between each element and the position on the line FL along which 24 receiving needle beams are formed, and sends them to the buffer memory. In order to obtain the ultrasound signals received by using the receiving needle beam NBi1,
for example, utilizing the received signals held in the buffer memory, the 24 time-axis-converted signals held in the buffer memories BM1
i13, BM2i12, BM3i11, , BM22iþ8,
BM23
iþ9, BM24iþ10 are sent to the additive synthesizer for
processing. In this way, an ultrasound signal received using the receiving needle beam NBi1 formed between distances FRS andFRE is obtained. Ultrasound signals received using
other receiving needle beams can also be obtained using the same process.
2.4 Summary of parallel receiving needle beam ultra-sonic technique
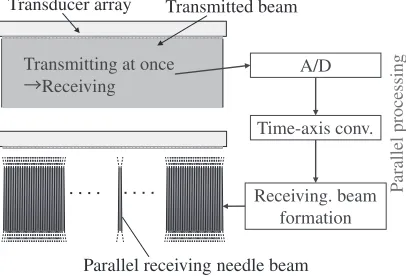
Figure 10 shows the summary of the parallel receiving needle beam ultrasonic technique, that is, a method for simultaneously inspecting a cross section of a test object using a transducer array. The receiving needle beam means a continuous line of receiving beam focal points. The tech-nique involves transmitting ultrasonic waves from all the ultrasonic transducer elements in the array, receiving reflected waves generated by the transmitted ultrasonic waves using all the ultrasonic transducer elements in the array, converting the received signals into digital waveform signals, converting the time axis of the digitalized received signal of each element, and additively synthesizing the time-axis-converted received signals of each element. The continuous line of receiving beam focal points formed inside the test object essentially means fixing the receiving beam
Received signal i Received signal i–1
Received signal i+1
A/D converter Time-axis converter
Buffer memory Additive synthesizer
Pulser
Receiving amplifier
Transducer array
i–13 i+12
FRS FRE
i–1 i i+1
i–13 i+12
Receiving needle beams Pulse repetition
10 kHz FLi-1
FLi FLi+1 NBi-1
NBi NBi+1
BMi-13 BMi-12 BMi-11 BMi+10 BMi+11 BMi+12
1
BMjBM2 j
3
BMj BM22j 23
BMj 24
BMj
Setup for
each buffer memory
. . . .
. . . .
. . . . . . . .
. . . . . . . .
. . . .
Fig. 9 Setup for parallel needle beam system.
Transmitting at once
Parallel receiving needle beam Transmitted beam
Receiving. beam formation Transducer array
A/D
Time-axis conv.
P
arallel processing
Receiving
[image:5.595.49.290.72.265.2].... ....
[image:5.595.325.528.76.214.2]focal points along the propagation direction at intervals corresponding to the sampling time interval of A/D (analog to digital) conversion. The term ‘‘at the same time’’ appearing in ‘‘By additively synthesizing. . .at the same time’’ means the time period within a cycle of transmitting and receiving ultrasonic waves.
3. Developed Measuring System
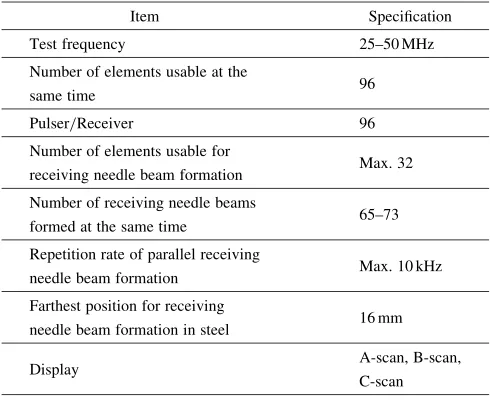
The appearance of the developed measuring system excluding the test tank is shown in Fig. 11. A functional diagram of the system is shown in Fig. 12. The setup of the parallel receiving needle beam unit is the same as the setup shown in Fig. 9. For ultra-fast parallel signal processing, the unit contains four FPGAs. The throughput of acquired test data in the unit is about 2 GB/s at maximum. Connected to the parallel receiving needle beam unit is a gating and peak detection unit, which detects the amplitude and beam path length of echoes that are received using the receiving needle beams from a test object. Table 1 shows the specifications of the system.
The system has a calibration mode and a testing mode. In the calibration mode, all ultrasound waveform data received using the receiving needle beams are sent to the computer and a B-scope is displayed on the screen. In the testing mode, the
detected position of the transducer array and the amplitude and beam path length of echoes are synchronously sent to the computer, so that a C-scope is displayed on the screen in real time.
4. Experimental Results and Discussion
Various tests were made using the developed system. A transducer array with a nominal frequency of 50 MHz and 96 elements arranged at 0.2-mm intervals was used. The transducer array was line-focused in the plane perpendicular to the arrayed direction and the focal length FLwas 20 mm.
Figure 13 shows the results of receiving beam diameter measurement in water. For reference, measurement using the conventional point-focused beam formation with the same transducer array was made at the same time. The receiving beam diameterDBwas measured by using the echoes from a
fine metal wire. As shown in Fig. 13, the wire was detected at an almost unvarying size regardless of the distancexbetween the transducer array and the wire by the developed system.
Figure 14 shows the measurement results of echo heights from side-drilled holes (SDHs) drilled at various distancesd
[image:6.595.65.270.72.227.2]from the surface in a 5-mm-thick stainless steel sheet. The focal point of the line-focused beam component was set to a depth of 2.2 mm under the surface of the test object. Fig. 11 Appearance of developed system.
Scanning
Linear transducer array
Test object Parallel receiving needle
beam formation unit Gating & peak detection unit
Computer
B-scope, C-scope
Position detector
[image:6.595.307.542.74.456.2]Water
Fig. 12 Test system using developed parallel receiving needle beam system.
Table 1 Specifications of the developed system.
Item Specification
Test frequency 25–50 MHz
Number of elements usable at the
96 same time
Pulser/Receiver 96
Number of elements usable for
Max. 32 receiving needle beam formation
Number of receiving needle beams
65–73 formed at the same time
Repetition rate of parallel receiving
Max. 10 kHz needle beam formation
Farthest position for receiving
16 mm needle beam formation in steel
Display A-scan, B-scan,
C-scan
0 0.1 0.2 0.3 0.4 0.5 0.6 0.7 0.8 0.9 1
16.8 17.6
14.0 14.9 15.9
Distance, x/mm
Recei
ving beam diameter
,
DB
/mm
Developed system Conventional spot-focused
beam formation
[image:6.595.304.549.84.287.2] [image:6.595.74.263.272.437.2]For reference, measurement using the conventional point-focused probe (50 MHz, 6 mm in diameter, 12 mm in focal length) was made at the same time. The focal point of the point-focused beam was also set to a depth of 2.2 mm under the surface. The height of echoes from the SDHs varied severely in the test using the point-focused probe. On the contrary, the change in echo height was rather small in the test using the developed system. A feature of special importance in the measurement results using the receiving needle beam is that the height of echoes in the region nearer to the focal point of the line-focused beam component is very high compared with the measurement results using the point-focused beam. As a result, the developed system demon-strates an extremely long focal zone compared with the conventional focused probe, in other words, point-focused beam formation.
Figure 15 shows a C-scan presentation of detected internal flaws. The test object (a 2-mm-thick stainless steel sheet) including internal flaws was scanned linearly at a speed of 1000 mm/s in the transverse direction to the transducer array arrangement. The measuring pitch in the scanning direction was 0.1 mm. The focal zone of the receiving needle beam was set to cover the depth where the internal flaws exist.
For reference, C-scan testing with the conventional point-focused probe (50 MHz, 6 mm in diameter, 12 mm in focal length) was made at the same time. The point-focused probe was scanned 2-dimentionally and the measuring pitch both in the stroke direction and in the index direction was 0.01 mm and the scan speed of the probe was 300 mm/s at maximum. The focus of the focused beam was set to the internal flaw.
At the scan speed of 1000 mm/s, the developed system very clearly detected ultra-minute internal flaws. Although two C-scan presentations shown in Fig. 15 seems to be different a little because of the difference in the measuring pitch and the method for display, the indications are the same internal flaws. The internal flaws exist in almost the fixed position in the thickness direction. The test of the object that has internal flaws with various positions in the thickness direction is a future task.
The time needed for testing the entire test object (500200mm in size) was about 15 s, about 1/500 of the time for the conventional C-scan testing, even if the measuring pitch in the index direction in the C-scan testing
was enlarged form 0.01 to 0.1 mm. Also, the time was 1/50 of that for conventional linear electronic scanning using the transducer array. Furthermore, the conventional point-focused beam forming technique requires more testing time, because the focal position must be changed for testing the entire volume of the test object.
Figure 16 shows a micro-optical image of a cross-sectioned internal flaw detected by the developed system. Flaws 20mmin diameter can be detected by the developed system.
It is puzzling that the SDH echo height in the measurement using the receiving needle beam dropped sharply and both results for SDH echo height measurement are similar when the distance between the SDH and the surface exceeds about 2.5 mm. The results are far from the expected effect of the receiving needle beam formation.
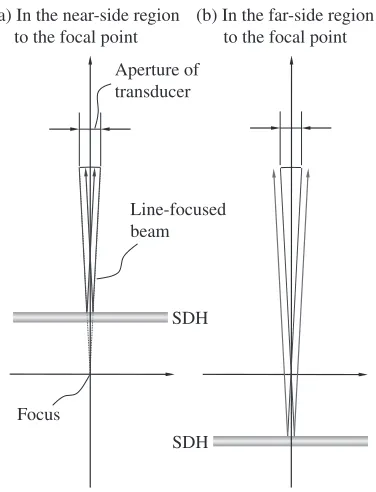
Let us consider the problem. It is possible that the unexpected results are related to the focal point of the line-focused beam component. Figure 17 illustrates the reflection
0 0.5 1 1.5 2 2.5 3 3.5 4 4.5
0
-2
-4
-6
-8
-10
-12
-14
-16
-18
SDH echo height (dB)
Distance from surface, d/mm
50-MHz Spot-focused beam
Developed system
[image:7.595.308.548.71.317.2]5
Fig. 14 Results of SDH echo height measurement.
(b) Conventional C-scan
50MHz (spot-focused)
1mm
Scan speed 1000 mm/s
1mm
(a) Test using
Developed System
Amplitude
+255
0
Amplitude
+255
0
C
RD
C
RD
Fig. 15 Comparison of C-scan presentation of the same internal flaw between (a) in the test using developed system and (b) in the conventional 50-MHz C-scan. RD: Rolling direction of the strip, C: Width direction of the strip.
20 µm TD
[image:7.595.61.274.72.237.2]C
[image:7.595.328.523.386.516.2]of ultrasound from the SDH in the plane perpendicular to the arrayed direction where the line-focused beam is formed. When the SDH is positioned in the near-side region to the focal point of the line-focused beam, all the reflected components return to the aperture of the transducer and the difference in the travel time between each component turns out to be insignificant by a brief calculation. However, when the SDH is positioned in the far-side region to the focal point, some components that do not return to the aperture of the transducer are observed. The proportion of reflected ultra-sound that does not return to the aperture of the transducer increases as the SDH moves away from the focal point. The sharp drop in SDH echo height is likely explained by the mechanism mentioned above. That is to say, it is believed that the sharp drop in SDH echo height is due to the mismatch between the shape of the SDH and the line-focused beam component.
As a result, the effectiveness of the receiving needle beam formation needs to be estimated from the SDH echo height in the near-side region to the focal point of the line-focused beam component. It is concluded that the receiving needle beam formation shows dramatic effectiveness in enhancing the uniformity of detectability along the thickness direction. In the same way as the mismatch between the shape of the SDH and the line-focused beam, a mismatch between the receiving needle beam and the internal flaw depending upon the shape of the flaw can happen in the plane along the arrayed direction, because the receiving needle beam formation is based on the beam focusing on the spot and the same goes for the conventional beam focusing technique based on the focal law. In order to solve the problem of the mismatch, the shape and the size of the internal flaw to be detected must be taken into account in the design of the focal law.
5. Conclusions
A new ultrasonic testing technique and system using a transducer array have been developed. The system works as follows:
(1) Ultrasonic waves are transmitted from all the ultra-sonic transducer elements in the array at the same time,
(2) By summing time-converted signals transformed from reflected wave signals received by all the ultrasonic trans-ducer elements in the array at the same time, lines of a continuously focused receiving beam (needle beam) are closely formed under the transducer array (parallel needle beam). Internal flaws in a cross-section are detected at once using the parallel needle beam.
The results of experiments using a 50-MHz transducer array and the developed system proved that ultra-minute internal flaws 20mmin diameter can be detected at a scan speed of 1000 mm/s. Plus, the focal zone formed is very long as compared with conventional point-focused beam forming.
It is concluded that the system is suitable for simultaneous testing of a cross-section of a test object at high scanning speed. Also, ultra-minute internal flaws can be detected by using the developed system.
We are presently considering the application of this detection system to internal quality measurement for various products.
REFERENCES
1) H. Kuguminato, H. Abe, T. Ono, A. Tosaka, Y. Izumiyama and Y. Ookawa: Kawasaki Steel Giho25(1993) pp. 27.
2) Toyo Kohan Co., Ltd.:Tin and Tin-Free Steel, (AGNE, Tokyo, 1974) pp. 1–351.
3) H. Kuguminato, Y. Izumiyama, T. Ono, T. Shiraishi and H. Abe: Kawasaki Steel Giho12(1980) pp. 331.
4) H. Takada, T. Shiraishi and F. Ichikawa: Proc. JSNDI Fall Conference 1995, (Tokyo, 1995) pp. 31–36.
5) H. Takada, T. Miyake and H. Yokota: KAWASAKI STEEL TECH-NICAL REPORT, No.43(2000) pp. 87–92.
6) H. Takada, A. Torao, T. Yamasaki, Y. Tomura, H. Unzaki, T. Sasaki, M. Aratani and T. Kobashi: Proc. 2002 IEEE Int. Ultrasonics Symposium, (Munich, 2002) 3C-3.
7) H. Takada, T. Yamasaki, Y. Tomura, H. Unzaki, T. Sasaki and M. Aratani: Tetsu-to-Hagane90(2004) 883–889.
8) P. A. Meyer and J. W. Anderson: Proc. 15th World Conf. on NDT (Rome, 2000) idn151.
9) J. Poguet, J. Marguet, F. Pichonnat and L. Chupin: J. Nondestructive Test. Ultrasonics (Germany)7(2002) 1–6.
10) J. Poguet, J. Marguet and F. Pichonnat: The e-Journal of Non-destructive Testing7(2002) No. 5–May.
11) M. Moles and S. Labbe´: INSPECTION TRENDS, 7(2004) Spring 20–24.
12) J. Habermehl and A. Lamarre: Proc. 17th World Conf. on Non-destructive Testing (Shanghai, 2008), idn116.
13) A. Lamarre and F. Mainguy: Proc. Int. Symposium on Advanced Sensors for Metals Process. 38th Annual Conference of Metallurgists of CIM, (Quebec City, 1999) pp. 217–227.
14) A. Lamarre and F. Mainguy: The e-Journal of Nondestructive Test. Ultrasonics4(1999) No. 9–September.
15) D. Braconnier and J. Murai: Proc. 17th World Conf. on Nondestructive Testing (Shanghai, 2008) idn99.
16) D. Braconnier and T. Murakami: Proc. 17th World Conf. on Non-destructive Testing (Shanghai, 2008) idn628.
(a) In the near-side region to the focal point
SDH Aperture of transducer
Line-focused beam
SDH Focus
[image:8.595.77.265.71.317.2](b) In the far-side region to the focal point