Structural Modi
fi
cation of Chalcopyrite Ore for Enhanced Copper Recovery
Sradhanjali Singh
1,4, Bansi Dar Nayak
1, Rama Chandra Mohanty
3,
Swaranjit S. Cameotra
2, Lala Beheri Sukla
1and Dong-Jin Kim
4,+ 1Institute of Minerals and Materials Technology, Bhubaneswar-13, Orissa, India 2Institute of Microbial Technology, Chandigarh 160036, India3Utkal University, VaniVihar, Bhubaneswar-4, Orissa, India
4Korea Institute of Geosciences and Mineral Resources (KIGAM), Daejeon 305-350, South Korea
Malanjkhand copper project, Madhya Pradesh, India, generates a lot of lean sulphidic ores containing chalcopyrite (³0.3%of copper) with traces of oxidized, semi-oxidized and secondary sulfides. EPMA analysis shows that the granitic rock samples have plagioclase feldspar, orthoclase feldspar and quartz as major constituents within which the ore minerals are sparsely distributed. Due to the complex structure and low solubility of the sulphide-bearing granitic rock, the dissolution of copper from the hard matrix is difficult. The present study deals with change in crystallographic and chemical nature of the mineral system present in the host rock. In an attempt to increase copper recovery, the ore was subjected to heating at 600°C under normal atmospheric conditions. This heat treatment resulted in enhanced copper recovery, up to 98%within 60 days of progressive leaching. [doi:10.2320/matertrans.M2012128]
(Received April 5, 2012; Accepted August 10, 2012; Published October 11, 2012)
Keywords: crystallographic and chemical changes, chalcopyrite, thermal activation, A. ferrooxidans, copper
1. Introduction
The Malanjkhand copper deposit is located in Balaghat district, Madya Pradesh (21° 55A22° 5A N and 80° 40A80° 55A E), Central India. It is Asia’s second largest open cast mine. Malanjkhand copper project is designed and imple-mented for excavation of 122 million tonnes of material over its estimated life span of 30 years. During excavation, a large amount of waste (0.55 MT/annum) is generated which contain primarily chalcopyrite with traces of oxidized, semi-oxidized and secondary sulfides. In addition to this about 2 MT of low grade (<0.3% Cu) waste has been accumulated near the mine site.1)
The presence of sulphide minerals in overburden generated during mining, if not managed carefully, may cause environ-mental pollution due to leaching of heavy metals by natural weathering processes (physicochemical or microbial). In most of the low-grade deposits, chalcopyrite and other sulphides are finely disseminated. Extraction of copper from low-grade ores through pyrometallurgical treatment is expensive due to high-energy consumption and low recov-ery.2)The available low-grade ores in India, with an average
copper content of ³0.3% Cu, which is well below the cut off grade of 0.45% Cu for concentrators, would contribute considerably to the country’s copper output, if appropriate technology could be developed for their commercial exploitation.3)Bio-hydrometallurgy is an alternative process
for better recovery from low-grade ores.47) Several acid-ophilic chemolithotrophic, mesophiles and thermopiles are responsible for the bioleaching process.
The sulphide minerals of copper are insoluble in water and weak acid solutions, but are rendered soluble under oxidizing conditions in the presence of Acidithiobacillus ferrooxidans
and Acidithiobacillus thiooxidans; the former catalyses the process of oxidation of the minerals, whereas the latter catalyses the oxidation of sulphur. The overall chemical
reactions leading to the dissolution of chalcopyrite is represented as follows:
CuFeS2þ2Fe2ðSO4Þ3þ2H2Oþ3O2
!CuSO4þ5FeSO4þ2H2SO4 ð1Þ A literature survey showed that between 40 and 96% of copper could be extracted from a chalcopyrite concentrate under different experimental conditions.811)Much less work
has been done with low-grade chalcopyrite ore. Similarly, hydrometallurgical and pyro-hydrometallurgical routes have also been attempted with sulphide concentrate using different reagents such as sulphate, chloride, and nitric acid.12,13)The
material used in the present study is a low grade ore, from which the recovery of metals is difficult. Due to the complex nature of the ore, and the low metal solubility, studies have been made of treating the raw ore at a high temperature to change the morphological characteristics of the host rock. Thermal activation is a method of heating and cooling to impact crystallographic and chemical changes in the mineral system present in the host rock. The present study deals with extraction of copper from thermally activated copper ore using Acidithiobacillus ferrooxidans in two different columns using optimized conditions obtained from shake
flask leaching.
2. Experimental Section
2.1 Ore
The low-grade copper ore contains 0.3% Cu, 0.03% Ni, 0.05%each of Co and Zn, 3.9%Fe, 2.83%S and 0.6%TiO2
with 91.2%acid insoluble given in Table 1. The XRD study of the ore identified the presence of Chalcopyrite, Feldspar and Quartz, but the EPMA study confirmed the presence of Covellite in addition to Chalcopyrite, Feldspar and Quartz as shown in Fig. 1.
2.2 Thermal activation of copper ore
with minor amounts of copper minerals such as chalcopyrite (CuFeS2), bornite (CuFeS4) and chalcocite (Cu2S), and mined
for extraction of copper, has been heated to a temperature of around 600°C for 30 min in a muffle furnace and cooled under atmospheric condition. There are several routes cited in the literature by different authors to break the strong lattice structure to recover copper.1417)The quartz mineral, which is
present in¡-form, due to heating at 573°C changes abruptly into ¢-quartz with sharp discontinuities in the physical properties including a sudden volume expansion of 0.82 to 1.30%. The host rock is very massive and hard and the porosity is less than 2%. Due to this expansion the porosity in the rock increases to about 8 to 10%leading to formation of many pores, channels and micro cracks. This makes the host rock more amenable to fracture leading to liberation of the copper minerals from the complex matrix. An increase in leach-ability may be attributed to the increased porosity, increased surface area and a change in reactivity of the ore due to extensive heating. Optical photomicrograph of raw
and thermal activated ore showing development of large cracks pores and channels are presented in Fig. 2.
2.3 Isolation and identification of Acidithiobacillus ferrooxidansfrom bioheap leach liquor
Samples were collected from Bioheap leach liquor tank for isolation of Acidithiobacillus ferrooxidans. 10 ml of the sample was added aseptically to 250 ml Erlenmeyer flasks containing 90 ml sterile basal salt medium g/l, [(NH4)SO4
-3.0; KH2PO4-0.5; KCl-0.1; MgSO4·7H2O-0.5], pH 2.0
(«)0.01% yeast extract.18) To enrich the iron oxidizers, the basal salt medium was supplemented with 22 g/l FeSO4·
7H2O and incubated at 35°C.
2.3.1 Nucleic acid extraction and PCR amplification
Cells were harvested at an early stationary growth phase by centrifugation for 5 min at 15,000©g and washed first with 10 mol/m3sulfuric acid to remove any soluble iron and
ferric precipitates and then the pellets were resuspended in 100 µL TE (10 mol/m3Tris, 1 mol/m3 EDTA) at pH-8. The
washed cell pellets were lysed in a solution of 50 mol/m3
sodium hydroxide and 0.025%(w/v) sodium dodecyl sulfate by heating to 95°C for 300 s. The 16S rRNA genes were amplified by polymerase chain reaction (PCR) using conserved primers (27F and 1492R) and cloned. Prior to amplification, gDNA of the community was isolated using RBC gDNA isolation kit. DNA yield was checked by electrophoresis in 0.8% agarose gel (40 min at 100 V and 135 mA) with 0.01%ethidium bromide.
2.3.2 Amplification and sequencing of 16S rRNA genes
[image:2.595.97.499.67.355.2]16S rRNA gene was amplified using conserved primers (27F and 1492R) and cloned. The reaction mixture prepared as follow: PCR was carried out at afinal volume of 50 µL, Table 1 Chemical analysis of malanjkhand low-grade copper ore.
Constituent Percentage
Copper 0.3
Nickel 0.03
Cobalt 0.05
Zinc 0.05
Fe 3.9
S 2.83
TiO2 0.6
Acid insoluble 91.2
[image:2.595.47.291.421.534.2]containing 5 µL of Taq buffer (10X), 3 µL MgCl2, 5 µL of
dNTPs (2 mM), 5 µL each forward Primer (20 µM) and reverse primer (20 µM), 2 µL of the purified genomic DNA, 0.5 µL of Taq DNA Polymerase and 27.5 µL of DNA free (µM) water to the reaction mixture. The reactions were programmed as follows: denaturation for 30 s at 95°C; annealing for 30 s at 55°C (57°C for archaea), with the temperature dropping by 1°C each 2 cycles for 20 cycles, followed by an additional 15 cycles of annealing at 45°C (47°C for archaea); elongation at 72°C for 90 s; and a final 10 min incubation period at 72°C to complete the primer extension. Reactions were carried out in an Eppendorf Thermocycler. PCR products were checked by 1% agarose gel electrophoresis stained with 0.01% ethidium bromide.
2.3.3 Restriction fragment length polymorphism analy-sis (RFLP)
Products of the 16S rRNA PCR amplification was directly digested for 3 h at 37°C with 1.5 U of restriction endonu-clease. HindIII was resolved in 0.8% agarose gel in Tris acetateEDTA buffer (TAE). The restriction fragments were subsequently analyzed by polyacrylamide gel electrophoresis and ethidium bromide staining. The amplified 16S rRNA gene was then cloned in TA cloning vector (in vitrogen TA cloning kit) and the ligated product was transformed in E. coli DH10B. The white colonies were selected from LB ampicillin and X-Gal+IPTG containing plates. Plasmids were isolated from randomly selected clones and sent for sequencing.
2.3.4 Phylogenetic affiliation of isolates
The sequence data were compared with 16S rRNA sequences deposited in public databases by using the BLAST search program. The 16S rRNA gene sequences of various bacteria including those closely related to the unknown sequences, as indicated by the BLAST search. Ten clones were sequenced to know the diversity. The sequence of all the 10 clones was found to be similar. The sequence when used for BLAST in NCBI database matched to these sequences.
2.3.5 Genotypic analyses
Electrophoretic analysis of the PCR products showed that the size of the fragments was amplified and no other amplification bands were observed. DNA matches the expected size of 985 bp. The 16S rRNA gene sequence was observed to possess 99% sequence similarity with that of A. ferrooxidans (accession number X75266) (Lane-2). Further experiment was carried out using this strain.
2.4 Bioleaching studies
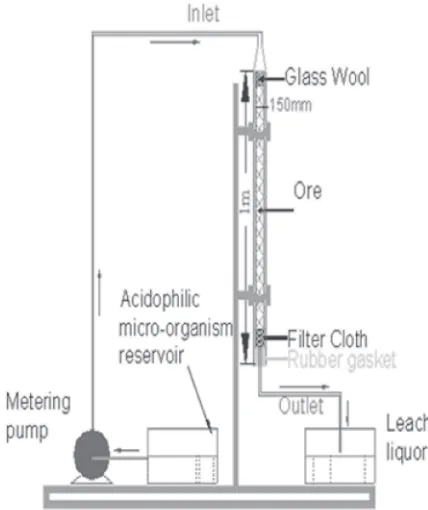
Figure 3 shows the schematic diagram for column bioleaching experiments. These were performed in thick plexiglass columns 1 m tall and 150 mm in diameter. 1.5 kg of each portion of raw and thermal activated ore, 12 mm in size, was loaded into the columns equipped with individual 5L bacterial solution reservoirs sprinkled at the top with aflow rate of 1 L/h through a metering pump. A high density support rubber cork wasfitted at the bottom of the column. The columns were operated in lock-day fashion; that is the Fig. 2 (A) Optical photomicrograph of raw ore containing Chalcopyrite (C) and Pyrite (P) within silicate matrix (F) X 100; (B) Optical
[image:3.595.133.462.65.398.2]effluent, or Intermediate Leach Solution (ILS), was reapplied to the top surface of the ore in the column. Experiments were performed in two phases; the first phase of bioleaching of low-grade ore is followed by the second phase after the removal of the product layer (jarosite). Removal of the product layer was done by applying a. The solution was passed through the column twice and recollected in a separate reservoir. The concentration of copper in the leach liquor was analyzed by a Perkin Elmer Model 3100 Atomic Absorption Spectrophotometer (AAS). pH, Eh, iron and bacterial concentration were monitored regularly.
2.5 Microscopical analysis (TEM and SEM-EDX studies)
Microscopic characterization is an essential part of the work for identifying the changes that occur in the host rock after thermal activation. Petrography studies were carried out using a Leitz Reflected light microscope, with polished sections of the samples containing both raw and leached residues. Since bioleaching processes involve bacteria whose size is ¯2 µ, and these organisms can selectively remove metals from the ores, their formation and characterization was also observed under TEM and SEM equipped with EDX.
3. Results and Discussion
3.1 Crystallographic modification of chalcopyrite ore
Figure 2(A, B and C) shows an optical photomicrograph of raw and thermally activated ore. The quartz mineral present in ¡-form, when heated at 573°C, changes abruptly into ¢-quartz with sharp discontinuities in the physical properties including a sudden volume expansion of 0.82 to 1.30%. The host rock is very massive and hard, having porosity less than 2%. Due to this expansion the porosity in the rock increases up to 8 to 10%, leading to formation of
minute pores, channels and micro cracks. This makes the host rock more amenable to fracture leading to liberation of copper from the complex matrix. An increase in leach-ability may be attributed to the increased porosity, increased surface area and change in reactivity of the ore due to extensive heating.
It was observed that during 1st phase, 73.4 and 8.4% of copper was extracted within 32 days from thermal activated and raw ore respectively [Fig. 4(A)]. Initially, the pH increases over the first 14 days due to the consumption of acid according to eq. (2).
4Fe2þþO
2þ4Hþ !
Iron oxidizing bacteria
4Fe3þþ2H 2O ð2Þ
S0þ3=2O
2þH2O!
Sulphur oxidizing bacteria
2HþþSO42 ð3Þ
Later, the sulphur species (S2O32¹ or S0) released from
sulphide mineral dissolution into solution is oxidized by the sulphur oxidizing microorganisms, which is an acid produc-ing process, compensatproduc-ing part of acid consumption as shown in eq. (3). As a result, the pH decreases slowly; the low pH favored the cyclic oxido-reduction reactions of Fe2+ § Fe3+ and resulted in high rates of Cu solubilisation and jarosite formation as shown in (eq. (4)).
Xþþ3Fe3þþ2SO
42þ6H2O
!XFe3ðSO4Þ2ðOHÞ6þ6Hþ ð4Þ where, X+=K+, Na+, H3O+, NH4++
Change in the iron concentration with respect to pH, as a function of time for both raw and thermally activated ore are shown in Fig. 5(I) (A and B). It was observed that the copper dissolution increases with increase in ferric iron concen-tration in the bioleaching pulp which acts as a primary oxidant for sulphide mineral. The concentrations of ferrous and ferric iron are important parameters in bioleaching and are useful as a measure of the biological activity. When the concentrations are optimal then the bacterial strains are able to oxidize ferrous ion to the ferric state more efficiently. As it can be seen from the graphs, there is a sharp increase in the iron concentrations in case of treated ore after 40 days. Ferric iron is important as it plays a key role in the indirect leaching of chalcopyrite.
The redox potential in the solution is a measure of the ratio between ferric and ferrous iron; the ratio should normally be as high as possible to obtain an optimal chemical oxidation rate. In addition, the redox potential is an important process signal and lower readings indicate that the bacterial activity is decreasing. Therefore, it is necessary to have a close look at the redox potential of the solution. Figure 5(II) (C and D) shows change in redox potential and bacterial concentration versus number of days. An increase in the oxidation reduction potential but as the leaching proceeds a gradual decrease in redox value from+552 to+500 mV, at between 20 to 30 days, was observed. But after 35th day the redox potential increases until after 60 days it is+676 mV. Similar patterns were observed in case of raw ore. A gradual decrease in redox potential up to 40 days of leaching was observed, followed by a rise in the value to+580 mV.
[image:4.595.60.274.70.325.2]there was a rise in cell concentration from 3.76 to 4.45© 106cells/ml in the former whereas in the latter it was found to be 3.76 to 4.44©106cells/ml. But after 20 days there was a decrease in the bacterial growth from the 25th to the 35th day. After that, i.e., from the 40th day, a rise in cell concentration was achieved in both the cases as shown in Fig. 5(II) (C and D). The first phase corresponds to the lag phase and bio-oxidation of ferrous iron, initially present in the medium. The growth of the bacterial strains is related to
the oxidation process. Hence, a growth limitation occurred as the supply of an essential nutrient (ferrous ion) in the medium decreased, thereby resulting in decrease of bacterial concen-tration. After 32 days it was found that the extraction rate of copper ceases due to the formation of an intermediate sulfide passivation layer, confirmed through XRD analysis. It is believed that the passivation layer is less reactive than the original chalcopyrite and may inhibit theflow of electrons and oxidants to and from the chalcopyrite.
0 10 20 30 40 50 60 70 80
0 2 4 6 8 10 12 14 16 18 20 22 24 26 28 30 32 34 1st phase
2nd phase
Reco
v
ery of Cu (%)
Number of Days
0 10 20 30 40 50 60 70 80
0 2 4 6 8 10 12 14 16 18 20 22 24 26 28 30 32 34
1st phase 2nd phase
Reco
v
ery of Cu (%)
(A) (B)
Fig. 4 The Plot showing extraction of copper (%), versus Number of Days A-from raw ore; B-thermal activated ore.
0 0.8 1.6 2.4 1.30 1.50 1.70 1.90 2.10 2.30 2.50
0 5 10 15 20 25 30 35 40 45 50 55 60
F
e[T], g/l
pH
Residence Time (Days)
[Fe], g/l pH 0 0.5 1 1.5 2 2.5 0.00 0.50 1.00 1.50 2.00 2.50 3.00
0 5 10 15 20 25 30 35 40 45 50 55 60
F
e[T], g/l
pH
Residence Time (Days)
[Fe], g/l pH A B 420 470 520 570 620 670 1.30 1.80 2.30 2.80 3.30 3.80 4.30 4.80
0 10 20 30 40 50 60
Redox P
o
tential, mV vs.
Ag/AgCl
Bacterial Count (X10
6cells/ml) No.of Days Bacterial Count (X10^6cells/ml) Redox Potential,(mV) versus Ag/AgCl 400 450 500 550 600 650 700 750 2.00 2.50 3.00 3.50 4.00 4.50 5.00 5.50
0 10 20 30 40 50 60
Redox P
o
tential, mVvs.
Ag/AgCl
Bacterial Count (X10
6cells/ml) No.of Days Bacterial Count (X10^6cells/ml) Redox Potential,(mV) versus Ag/AgCl C D (I) (II)
[image:5.595.122.482.68.237.2] [image:5.595.87.508.273.628.2]To overcome this, a mixture of NH4CO3and Na2CO3was
added in a ratio of 1 : 1. This whole solution was then passed through the column to remove the product layer. By a carbonation reaction, using NH4CO3 and Na2CO3, the
jarosite structure is further decomposed and solubilized, thereby facilitating the bacterial reaction and enhancing the recovery rates. By adapting the above parameters the dissolution rate was further increased up to 24% with thermally activated ore and 9.6%in raw ore [Fig. 4(B)]. This may be due to the fact that, the precipitate forms a coherent layer adhering strongly to the chalcopyrite surface and cannot be removed completely by bio-reduction. The experimental aims was to remove or minimize the extent of the product layer that forms on the mineral surface and acts as a physical barrier to prevent microbial access, thereby slowing the diffusion of ferric ions to the sulphide surface.
3.2 FESEM analysis
Formation of passivaion layer starts fromfirst week of the experimentation. Gradually, it proceeds to become thick as time progress, thereby hindering the bacterial reaction with the ore. It is known that A. ferrooxidans oxidizes Fe2+ to Fe3+ which in later accompanied by deposition of jarosite. Deposition of jarosites is a common step in bacterial leaching of any mineral sulfides. In this case, within 3 days [Figure is not shown here] of bacterial leaching, a yellowish deposition appeared in the reaction solution, but the deposition changed to yellow brown after day 6.
3.3 3.3. TEM and SEM-EDX analysis
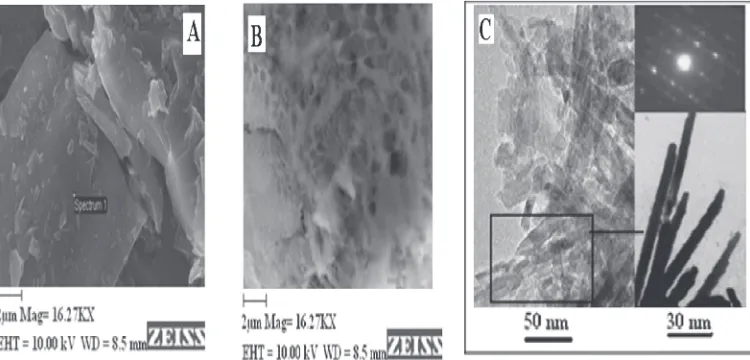
SEM images show that the chalcopyrite surface prior to leaching was smooth, as presented in Fig. 6(A), but after 24 to 48 h it becomes rough leading to the formation of several holes (2 µm) on the surface [Fig. 6(B)]. These holes became larger with increasing leaching time. The chalcopyrite surface becomes densely covered with several layers of extra cellular polymeric substances (EPS) after 32 days of progressive leaching. It was observed that, biofilm formation starts after 2 weeks of bacterial inoculation on the chalcopyrite surface. Interestingly, large amounts of this material were released
from the colonized chalcopyrite surface into the solution. Whether EPS material present on the surface is generated solely by sessile cells or originates from planktonic phase is not clearly understood. AFM images clearly show EPS secretion and entrapment of bacteria cells within the EPS matrix. The synthesis of EPS by cells of A. ferrooxidans is strongly influenced by the growth substrate or attachment substratum of the cells. Cells growth with soluble Fe2+ generally generates less EPS than cells grown with solid chalcopyrite. Biofilm formation depends upon various factors of the environment it lived in, e.g., nourishment, temperature, osmotic pressure, pH, Fe ion concentration and redox potential.19) However, Grooteers et al., 2007 reported that
biofilms may have inhibiting effect on metallic surface for corrosion.20) Their inhibiting effect was generally thought to be caused by oxygen depletion or the formation of passivating layers. Moreover, the biofilm lay between the mineral surface and the deposition that covered the surface of sulfides, even integrating with the upper deposition, so the biofilm may restrain the oxidation of chalcopyrite.
In addition attempts were made to characterize the crystals present in large amounts. EDX analysis of the vacant area on the crystals was done and it was observed that the elements such as Fe, S and K occur in major amounts (27.8, 16.7 and 0.8%) in the rhombi-structured crystal [Figs. 7(A) and (B)] which was also confirmed through XRD [Figs. 7(C) and (D)]. Therefore, it can be concluded that the crystals are jarosites formed under the effect of A. ferrooxidans in the bio-oxidation process of chalcopyrite. According to Pogliani and Donati, a direct relationship exists between jarosite precipitation and the number of attached cells. The generation of jarosite is mainly affected by pH and temper-ature.21) TEM analysis of the bacterial leached samples show metallic copper present inside the porous silicate matrix having rod shape structures approx 2 µm [Fig. 6(C)]. The results suggest that, due to the development of a product layer, the surface was not extensively attacked by bacteria, possibly because the bacteria found it very difficult to grow under the stress. Hence there was no further recovery observed but as the passivation layer is removed from the Fig. 6 SEM images (A) showing smooth chalcopyrite surface before bioleaching, (B) showing several holes (2 µm) developed on the
[image:6.595.111.486.71.251.2]minerals surface, this facilitates the bacterial reaction by exposing new sites for better attachment and enhancing the recovery rates.
4. Conclusion
Thermal activation leads to change from ¡-form to ¢ -quartz with sharp discontinuities in the physical properties including a sudden volume expansion of 0.82 to 1.30%. Due to this expansion the porosity in the rock increases up to 8 to 10% leading to formation of several minute pores, channels and micro cracks. This makes the host rock more fragile more often to the penetration of the solution into the ore matrix leading to liberation of copper from the complex matrix. It was observed that during 1st phase of bioleaching experiment, 73.4 and 8.4%of copper was extracted within 32 days with thermal activated and raw ore. But after removing the product layer with a mixture of NH4CO3 and Na2CO3,
leaching yield increases to 24% with thermal activated ore and 9.6%in raw ore. It was due to the carbonation reaction of NH4CO3 and Na2CO3 which further decomposes the
jarosite structure and leads to solubilization in the solution, thereby facilitating the bacterial reaction and enhancing the recovery rates.
Acknowledgements
One of the author wish to express her thanks to Global R&D Centers Program of the National Research Foundation of Korea (NRF) funded by the Ministry of Education, Science and Technology (MEST) for providing a Postdoc Fellowship.
REFERENCES
1) D. B. Sikka and C. E. Nehru: J. Geol. Soc.59(2002) 339362. 2) K. A. Third, R. Cord-Ruwisch and H. R. Watling:Hydrometallurgy57
(2000) 225.
3) L. B. Sukla, K. C. Nathsarma, J. R. Mahanta, S. Singh, S. Behera, K. S. Rao, T. Subbaiah and B. K. Mishra:Korean J. Chem. Eng.26(2009) 16681674.
4) H. Yin, L. Cao, G. Qiu, D. Wang, L. Kellogg, J. Zhou, Z. Dai and X. Liu:J. Microbiol. Methods70(2007) 165178.
5) M. Qiu, S. Xiong and W. Zhang: J. Univ. Sci. Technol. Beijing, Miner. Metall. Mater.13(2006) 710.
6) C. C. Sui, S. H. R. Brienne, S. Ramachandra Rao, Z. Xu and J. A. Finch:Miner. Eng.8(1995) 15231539.
7) N. Pradhan, K. Nathasharma, K. S. Rao, L. B. Sukla and B. K. Mishra:
Miner. Eng.21(2008) 355365.
8) J. G. Kingma and M. Silver: Appl. Environ. Microbiol.39(1980) 635 641.
9) L. Xia, C. Yin, S. Dai, G. Qui, X. Chern and J. Liu:J. Ind. Microbiol. Biotechnol.37(2010) 289295.
10) L. Cancho, M. L. Blázquez, A. Ballester, F. González and J. A. Muñoz:
Hydrometallurgy87(2007) 100111.
11) S. Mousavi, M. Yaghmaei, S. Vossoughi, M. A. Jafari and S. A. Hoseini:Hydrometallurgy80(2005) 139144.
12) G. M. Schwab and J. Philinis:J. Am. Chem. Soc.69(1947) 25882596.
13) M. Chakravorttya and S. Srikanth:Thermochim. Acta362(2000) 2535.
14) J. D. Prater, M. G. Bodas, B. D. Pandey and R. K. Jana: Proc. Symposium on Advances in Electrometallurgy, Karaikudi, India, (1983) 1.5.11.5.10. 15) G. M. Swinkel and R. M. G. S. Berezowsky: CIM Bul.71(1978) 105121. 16) R. F. Dalton, R. Price, E. Hermana and B. Hoffman: Min. Eng. 40
(1988) 2428.
17) L. Meunier and H. Vanderpoorten:ATB Metall.1(1957) 3135.
18) M. P. Silverman and D. G. Lundgren:J. Bacterial.77(1959) 642647.
19) F. Meng, H. Zhang, F. Yang, Y. Li, J. Xioa and X. Zhang:J. Membr. Sci.272(2006) 161168.
20) M. Grooters, K. Harneit, M. Wolbrink, W. Sand, R. Stadler and W. Furbeth:Adv. Mater. Res.2021(2007) 375378.
21) C. Pogliani and E. Donati:Process Biochem.35(2000) 9971004.
[image:7.595.124.474.71.345.2]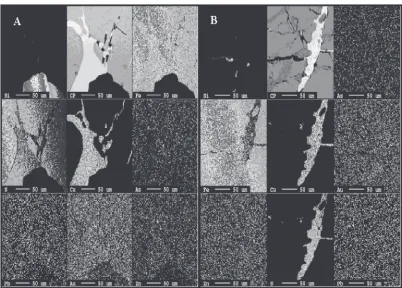

![Fig. 5(I) The Plot showing change in pH of the solution, Fe[T], g/l versus Number of Days, A-Thermal activated; B-Raw ore](https://thumb-us.123doks.com/thumbv2/123dok_us/326997.531204/5.595.87.508.273.628/plot-showing-change-solution-versus-number-thermal-activated.webp)