Resistivity Evolution with Temperature of 7050 Aluminium Alloy
in Different Casting Methods
Chunyan Ban
*1, Fei Fan
*2, Yang Wang
*2, Qixian Ba and Jianzhong Cui
The Key Lab of Electromagnetic Processing of Materials, Ministry of Education, Northeastern University, Shenyang, 110004, P.R. China
The resistivity-temperature curve of 7050 aluminum alloy prepared in different casting methods (DC and LFEC) has been measured with D.C. four-probe method. By analyzing the curve, it was found that a change occurred to the slope at 250C when the samples were heated, and the resistivity of LFEC sample changed with temperature more quickly than that of DC. Both the solidus and liquidus temperatures of LFEC samples were higher than those of DC samples during the process from room temperature to 900C. However, the resistivity of DC samples increased remarkably while the temperature was kept at 900C, and even before it was decreased to 600C. With the microstructure observation, the characteristics and phenomenon of the resistivity evolution with temperature were studied. [doi:10.2320/matertrans.MRA2007287]
(Received November 21, 2007; Accepted June 23, 2008; Published September 10, 2008)
Keywords: aluminum alloy, low frequency electromagnetic casting, resistivity, Lorentz force
1. Introduction
Super-high strength Al alloy (Al-Zn-Mg-Cu alloy) is widely used in aeronautical and automotive applications, due to its high strength, low density and good fracture tough-ness.1)There are more demands for combining property of high strength and high tough Al alloy in modern industry, thus exploiting and developing super-high strength Al alloy is crucial. Constant efforts are being made to improve the mechanical and corrosion properties of these alloys for a particular application.2)
Low frequency electromagnetic casting (LFEC) is a new casting technique. It was developed from the CREM (Cast-ing, Refin(Cast-ing, Electromagnetic) process by Cui Jianzhong etc. In this process, AC induction coil are arranged around the crystallizer of conventional casting, inletting low frequency current (less than 50 Hz), then Al alloy ingots are prepared by using semi-continuous LFEC. Comparing with direct chilling casting (DC), LFEC could not only obtain fine and uniform microstructure and good surface quality which gained by CREM, but also remarkably increase the alloy element content inside grain, enhance the ability of resisting cracking, decrease macrosegregation, and improve the quality of ingots.3)
Resistivity is a sensitive parameter to the structural changes of alloy. By analyzing the influencing factors of resistivity detailedly, we can know the internal structure evolution of alloy.4,5) Resistivity is applied to the study of liquid metal, because the resistivity has an abrupt variety at liquidus or solidus temperature. Furthermore when the temperature is higher than the liquidus temperature, the structure changes of liquid metal can be reflected sensitively by resistivity variance.6,7) Therefore, according to the study of resistivity-temperature (-T) curve, we may obtain a lot of important information of structure evolutions with tem-perature in the liquid and solid metal.
The present investigation was aimed at studying -T
curves of 7050 Al alloy ingots which were prepared in different casting methods (DC and LFEC) in the range from room temperature to 500C and 900C, respectively. With the microstructure observation, the reason of the difference of -T curves between the two category ingots was studied.
2. Experimental
7050 Al alloy was made up according to the following component(quality percentage): Zn6.5%, Cu2.5%, Mg2.5%. The samples were cut from the ingot which was cast in the same charging material, but the casting technique is different. The upper part was cast by LFEC while the lower part was cast by DC method. Casting temperature was 725–730C, casting speed was 55 mm/min, and ingots were cooled at a cooling rate of 90 L/min by water. The coil electrical current was maintained at 160 A with frequency of 20 Hz. The diameter of ingots was 120 mm. A 140 mm long part was cut off from the center section of ingot, the part of edge was removed, from which the square materials with1010mm cross section were prepared, and the cylinder samples (690mm) were machined.
One group of the samples were heated from room temperature to 500C at a heating rate of 2C/min, held at this temperature for 10 minutes, then cooled to room temperature at the same rate. The resistance of the sample was measured at the temperature interval for every 5C during the heating and cooling processes. Another group of the samples were heated from room temperature to 900C at a heating rate of 5C/min, held at this temperature for 10 minutes, then cooled to room temperature at the same rate. In the same way, the resistance of the sample was measured at the temperature interval for every 5C. With D. C. four-probe method, the resistances of samples were measured by SB-2230 direct current number resistance meter.
Samples with 20 mm in length were cut at the middle part, abraded with abrasive paper, first polished by machine, *1Corresponding author, E-mail: [email protected]
*2Graduate Student, Northeastern University
then polished with shammy carefully, at last etched with mixed acid. The microstructures were observed by an optical microscope, Leica DMR. The solute distribution from the center to edge region of the ingot was detected by chemical analysis. The instrment used for chemical analysis is Inductively Coupled Plasma Optical Emission Spectrometer (ICP-OES), Optima 4300DV.
3. Result
Figure 1(a) and 1(b) show cast macrostructure of 7050 Al alloy in different casting methods. It indicates that the macrostructure of LFEC sample is finer than that of DC, and there are massive columnar crystals in DC sample, while the grains of LFEC sample are globular. Figure 1(c) and 1(d) show their microstructure respectively. The grain boundaries of LFEC sample are thinner than those of DC,The different thickness of grain boundaries is made by different casting methods.
The -T curves of samples heated from room temper-ature to 500C are given in Fig. 2. Figure 2(a) is-T curve of the heating process. The curve is approximately made up of two linear regions. The slope changed at about 250C. Figure 2(b) shows the -T curve of cooling process which almost decrease linearly with single slope coefficient.
Both in the heating curve and cooling curve, the -T
curves of LFEC samples are higher than those of DC, and change more rapidly along with the temperature. Comparing the resistivity of room temperature in Fig. 2(a) and 2(b), it was discovered that the resistivitiy of samples which experienced heating and cooling processes are less than those of the original.
Microstructure of the measured samples is showed in Fig. 3. The coarse grain boundaries turned into pin stripe and became discontinuous, and there are large numbers of needlelike precipitates inside the grains.
The original cast samples were heated from room temper-ature to 400C at a rate of 2C/min, held at this temperature for 30 minutes, then water quenching. The microstructure is illustrated in Fig. 4(a) and 4(b). Compared with Fig. 1(c) and 1(d), the grain boundaries became thin, because the solute components on the grain boundary dissolved into -Al matrix. Contrasted Fig. 3 and 4, the grain boundaries of the former are thinner, because more solute on the grain boundary dissolved into -Al matrix with the temperature ascending to 500C, however the latter has no precipitates from the intracrystalline, thus the precipitates formed while the temperature fell to lower temperature.
Figure 5 illustrates the heating and cooling curves from room temperature to 900C. In the course of heating to 900C, the resisitivity of LFEC samples is higher than that
2mm (b)
(c) (d)
2mm (a)
Fig. 1 Casting macrostructure and microstructure of 7050 aluminum alloy (a)(c)DC (b)(d)LFEC.
0 4 6 8 10
(a)
Resistivity
,
ρ
/
Ω
Temperature,T/° LFEC DC
4 6 8 10
(b) LFEC
DC
µ
cm
Resistivity
,
ρ
/
Ωµ
cm
C Temperature,T/°C
100 200 300 400 500 0 100 200 300 400 500
[image:2.595.146.449.71.268.2] [image:2.595.136.462.312.436.2]of DC. The -T curve is linear from room temperature to 250C, the -T curve is still linear above 250C, but the slope is somewhat large. Above around 570C, the -T curve goes up rapidly, and the curve goes smooth at about 650C. The former is the solidus temperature of Al alloy, the latter is the liquidus temperature. The solidus and liquidus temperatures of DC and LFEC are listed in Table 1. The solidus and liquidus temperatures of LFEC are higher than those of DC. There should be an error about the solidus and liquidus temperatures obtained by this method, in this paper, we only want to compared the solidus and liquidus temperatures of LFEC and DC samples relatively. The-T
curve goes up rapidly again at about 880C, this change is likely be concerned with the solution of the solute clusters, so the resistivity abrupt.7)Figure 5(b) is the cooling curve, the resistivity is upward from 900C to 600C, and the
resistivity of DC samples is upward more obviously. The resistivity decreased monotonically, when the temperature dropped to 600C. Unlike the heating curve, the -T curve of DC samples is higher than that of LFEC from 900C to room temperature.
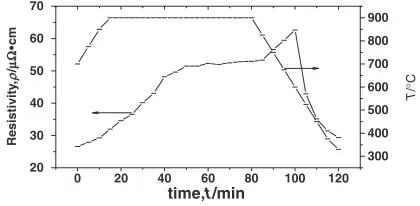
To know the evolution of resistivity in the course of thermal preservation and cooling, the DC sample was heated to 900C, held at this temperature for an hour, then cooled to room temperature. The change of and T with time t are shown in Fig. 6. The resistivity increased all along while the
(a) (b)
Fig. 3 Microstructure of 7050 aluminum alloy after measuring resistivity from room temperature to 500C. (a) DC (b) LFEC.
(a) (b)
Fig. 4 Microstructure of 7050 aluminum alloy quench at 400C. (a) DC (b) LFEC.
0 200 400 600 800 1000 0 200 400 600 800 1000
5 10 15 20 25 30
(a)
Resistivity
,
ρ
/
Ω
Temperature,T/ LFEC
DC
10 20 30 40 50
(b) LFEC
DC
Resistivity
,
ρ
/
Ω
µ
cm
µ
cm
C
° Temperature,T/ C°
[image:3.595.130.466.72.182.2]Fig. 5 -Tcurves of 7050 Al alloy from room temperature to 900C. (a) heating curve (b) cooling curve.
Table 1 Solidus and liquidus temperature of DC and LFEC samples.
casting method solidus temperature/C liquidus temperature/C
DC 565 650
LFEC 575 660
0 20 40 60 80 100 120
20 30 40 50 60 70
time, t /min
Resistivity
,ρ
/
Ω
300 400 500 600 700 800 900
T
µ
cm
/C
°
[image:3.595.146.452.227.325.2] [image:3.595.137.461.375.476.2] [image:3.595.321.531.526.629.2] [image:3.595.45.291.537.577.2]temperature increased and held at 900C, and even before it decreased to 600C. The resistivity began to decrease when the temperature droped below 600C.
4. Discussions
As we know, under the effects of the alternating current, the inductor generates a variable magnetic field in the melt, which in turn gives rise to an induced current. Thus, the melt is subject to electromagnetic body forces caused by the interaction of the eddy currentsJ and the magnetic fieldB. Lorentz force can be solved by Maxwell’s electromagnetic equations as follows:
f¼JB¼1=ðB rÞB1=ð2ÞrB2 ð1Þ
whereis magnetic permeability. Considering Al is a weak magnetic substance, ¼0¼4107H/m. The first
term on the right side of eq. (1) is a rotational component which results in a forced convection and a flow in the melt, it brings intracrystalline solute of alloy to increase solidified under AC magnetic field.3,8)The second term on the right side of eq. (1) is an irrotationality force
f ¼ 1=ð20ÞrB2 ð2Þ
because there is a relation betweenBandH, eq. (2) is written as follows:
f ¼ 0=2ð1þÞrH2 ð3Þ
whereis magnetic susceptibility. Because the non-uniform distribution of magnetic line along longtitudinal direction and the skin effect of metal, there are the longitudinal componentr==H2and the transverse componentr?H2about
rH2. Correspondingly the irrotationality force is broken up
the longitudinal component f==and the transverse component f?. Considering the magnetic line distribution in coil along the axis of the ingot roughly, the direction of axis iszaxis, a column coordinate system ðr; ;zÞ is built. The transverse component is
f?¼ 0=2ð1þÞ
@
@rH
2 ð4Þ
Its direction is the radial of ingot. The difference between Lorentz force acting on the-Al matrixf?band the impurity phase f?p is written as9)
f ¼ f?pf?b¼0=2ðbpÞ
@
@rH
2 ð5Þ
wherebandpare magnetic susceptibility of-Al matrix and the impurity phase, respectively. It can be deduced that
ifp> b, the solute would be subject to a magnetic force
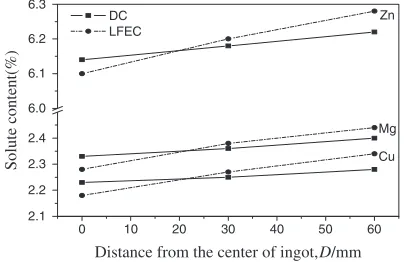
which points to axis, so the solute would move towards the center of the ingot. If p< b, the solute would move towards the edge of ingot. There are mainly Zn, Cu and Mg in 7050 Al alloy, their magnetic susceptibility is less than that of Al, so they would move towards the edge of ingot. We took samples from the center to edge of DC and LFEC ingots, the chemical analysis is shown in Fig. 7. In both methods, there are more solutes in the edge than in the center. The LFEC ingots have less Zn, Cu and Mg in the center while more Zn, Cu and Mg in the edge than the DC
ingots. The chief reason of the difference of resistivity between the LFEC and DC samples is not due to the difference of component, but due to the difference of solute content inside the grains.
It is necessary to indicate that the solute component which was determined by chemical analysis is the total solute content of intracrystalline and grain boundaries. The solute of intracrystalline includes the solute which dissolves in the solid solution and which is out of the solid solution. When the temperature is invariable, the consistency of the solute which dissolves in the solid solution determines the resistance value of the solid solution, so it determines the resistance value of the alloy which has low solute content. In Fig. 2 and Fig. 5, the electrical resistivity of LFEC sample is almost as same as that of DC sample at room temperature, which indicates their saturation solid solubility are approximative at room temperature.
The electromagnetic stirring can refine grain, so it leads to the difference of grain size in the Fig. 1(a) and 1(b). Moreover the electromagnetic stirring can increase the intracrystalline solute content. As shown in Fig. 1(c) and 1(d), the grain boundary of LFEC sample is much thinner than that of DC sample because the intracrystalline solute content of LFEC sample is increased, thus the precipitates on the grain boundary is decreased.
The resistance of alloy which has low solute content depends on the resistance of solid solution.10)The resistivity of solid solutionis
¼iþmðTÞ ð6Þ
where i is relate to the content of solute, mðTÞ is the resistance of dissolvant, depending on the crystal lattice scattering, it is relate to the temperature T. When the temperature is higher than room temperature, there is a linear relation betweenT andm
mðTÞ ¼CT ð7Þ
where C is a constant. The impurity scattering would generate when the solute dissolved into solid solution, it is another source of resistance of metal. When the solute consistency ni is smaller, there is an approximate relation betweeniandni
i¼Kni ð8Þ
whereK is the proportion constant.
0 10 20 30 40 50 60
2.1 2.2 2.3 2.4 6.0 6.1 6.2 6.3
Cu Mg Zn
Solute content(
%)
Distance from the center of ingot,D/mm
DC LFEC
[image:4.595.326.528.75.206.2]Because of the electromagnetism stirring, the intracrystal-line solute content of LFEC sample is increased, and the solute content of-Al solid solution is increased, too.8)So the -T curve of LFEC sample is higher than that of DC sample when the samples were heated from room temperature to 500C and 900C, respectively. The solute consistency of -Al solid solution is almost invariable when the temperature is lower. With the temperature ascending, the vibration of crystal lattice enhanced, the resistivity is increased linearly. When the temperature is above 250C, perhaps the solubility of the solute in -Al is increased, here not only the crystal lattice scattering but also the impurity scattering increase along with the temperature increase, so there is a turning point at 250C in the-Tcurve. It is noticeable that the solute on intracrystalline is easier to dissolve into-Al than that on grain boundary. The intracrystalline solute content of LFEC sample is higher, so the increases rapidly with the temperature increase.
The measuring process from room temperature to 500C is actually a process that heating and cooling the samples slowly. The solubility which the solute dissolves into-Al is increased at a high temperature, which leads to the resistance increase. The solute would precipitate from -Al with the temperature falling. Because the cooling rate of measuring process is much lower than that of the casting, there is more chances for the solute to precipitate from-Al, so the intracrystalline solute content of samples after measuring is lower than that of the original ingots, the resistivity decreases after measuring. It is approved that the eq. (6) to eq. (8) are still fit for liquid metal.11)At about 830C, the resistivity of liquid alloy increased obviously, it is estimated that, at this temperature the solute clusters began to dissolve, more solute dissolved into liquid Al. Because the solute content of DC sample is higher than those of LFEC sample, the total solute content is higher in the liquid Al, which results in the of DC sample exceeds that of LFEC sample above 880C, and the resistivity is upward when the temperature held at 900C, and even before cooled to 600C. Although the solute precipitated continuously from -Al from 900C to room temperature, but the solubility of DC sample is higher than that of LFEC sample all along, so the -T curve of DC sample is higher than that of LFEC sample from 900C to room temperature.
5. Conclusions
(1) 7050 Al alloy ingots were prepared in two different methods (DC and LFEC), there were two linear regions in the-T curve, and the resistivity of LFEC samples changed rapidly.
(2) The -T curves abrupted at the solidus and liquidus temperature when the samples were heated from the room temperature to 900C, and at about 880C the curves abrupted again. The heating curve of LFEC sample was higher than that of DC sample; while the cooling curve of DC sample was higher than that of LFEC sample.
(3) The reason of the above result is that LFEC makes the Zn, Cu and Mg move towards the edge of ingot and makes solid solubility of the sample increase.
Acknowledgements
This research was supported by the National Natural Science Foundation of China (No. 50674030, 50404007).
REFERENCES
1) K. S. Alrubaie, M. A. Delgrande, D. N. Travessa and K. R. Cardoso: Mater. Sci. Eng. A464(2007) 141–150.
2) M. Dixit, R. S. Mishra and K. K. Sankaran: Mater. Sci. Eng. A464
(2007) 1–2.
3) B. J. Zhang, J. Z. Cui and G. M. Lu: Journal of Mater. Sci. Technol.18
(2002) 1–3.
4) H. X. Chen:The physics capability and measurement method of metal, (The metallurgy industry publishing company, Beijing, 1987). 5) M. R. Corfield, I. R. Harris and A. J. Williams: Journal of Magnetism
and Magnetic Materials316(2007) 59–66.
6) X. F. Li, F. Q. Zu, H. F. Ding, J. Yu, L. J. Liu and Y. Xi: Phy. Letters
A354(2006) 325–329.
7) Q. Wang, J. Jia, P. J. Li and P. L. Wu: Casting3(1998) 7–9. 8) C. Y. Ban, Q. X. Ba, J. Z. Cui and G. Y. Zeng: Journal of Northeastern
University (Natural Science)23(2002) 799–782.
9) Y. Han, C. Y. Ban, H. T. Zhang, H. Nagaumi, Q. X. Ba and J. Z. Cui: Mater. Trans.47(2006) 2092–2098.
10) J. X. Fang and D. Lu:Physics of solid state, (ShangHai, Science and Technology Press in ShangHai, 1980) pp. 304–307.