High-Entropy Alloys with Hexagonal Close-Packed Structure in
Ir
26Mo
20Rh
22.5Ru
20W
11.5and Ir
25.5Mo
20Rh
20Ru
25W
9.5Alloys Designed by Sandwich
Strategy for the Valence Electron Concentration of Constituent Elements in the
Periodic Chart
Akira Takeuchi
1,+, Takeshi Wada
2and Hidemi Kato
21Graduate School of Engineering, Tohoku University, Sendai 980-8579, Japan 2Institute for Materials Research, Tohoku University, Sendai 980-8577, Japan
High-entropy alloys (HEAs) with a single hexagonal close-packed (hcp) structure were found in Ir26Mo20Rh22.5Ru20W11.5 and Ir25.5Mo20Rh20Ru25W9.5 alloys annealed at 2373 K for 1 h. These HEAs were designed based on a sandwich strategy for valence electron concentration (VEC) of the constituent elements and by referring to their crystallographic structures in the periodic chart. The initial component and composition of these alloys were determined by considering exact and near equiatomic sub binary phase diagrams, followed by optimizing the composition by Thermo-Calc with the TCHEA3 database for HEAs as well as the SSOL5 database for solid solutions. The X-ray diffraction analysis, scanning electron microscopy observation, and energy-dispersive X-ray spectroscopy analysis revealed that the Ir26Mo20Rh22.5Ru20W11.5and Ir25.5Mo20Rh20Ru25W9.5alloys annealed at 2373 K for 1 h were formed in an hcp single phase. The formation of the hcp structure was principally evaluated by the VEC values of 7.855 and 7.865 for Ir26Mo20Rh22.5Ru20W11.5and Ir25.5Mo20Rh20Ru25W9.5 alloys, respectively, such that these values were close to VEC=8 for pure elements Ru and Os with an hcp structure. It is considered that Ru is a strong hcp-forming element under this strategy because the other pure constituent elements have different crystallographic structures. The formation of Ir26Mo20Rh22.5Ru20W11.5and Ir25.5Mo20Rh20Ru25W9.5HEAs with an hcp structure is unique because these alloys, which consist of only transition metals, can be produced without applying high pressure, similar to a CrMnFeCoNi HEA with an hcp structure. [doi:10.2320/matertrans.M2019037]
(Received February 6, 2019; Accepted April 22, 2019; Published June 7, 2019)
Keywords: high-entropy alloys, hcp, transition metals, valence electron concentration
1. Introduction
In this paper, we have described two alloys®
Ir26Mo20Rh22.5Ru20W11.5 and Ir25.5Mo20Rh20Ru25W9.5®that are different from conventional high-entropy alloys (HEAs)1,2) because of the simultaneous achievement of the following four features during alloy formation:
(1) A hexagonal close-packed (hcp) structure (2) Only transition metals as constituent elements
(3) Ease of manufacture by conventional procedures, in that at ambient atmospheric pressure, without applying high pressure, and by a method of arc melting/ high-frequency melting without involving a chemical reaction.
Moreover, feature (2) can be supplemented by another feature: (4) all components include 4d and 5d transition metals. Historically, conventional HEAs have been devel-oped as the exact or near-equiatomic crystalline alloys consisting of five or more elements combined into a single body or face-centered cubic (bcc or fcc) or their mixed structure.1,2)Thus, as described in feature (1), the presence of an hcp structure is the distinguishing factor for HEAs. In fact, only a few HEAs with the hcp structure have been reported till date by Takeuchi et al.,3) Feuerbacher et al.,4) Youssef et al.,5)and Tracyet al.6)In particular, the YGdTbDyLu and GdTbDyTmLu alloys3) and HoDyYGdTb alloy4) com-prising heavy lanthanide elements can be produced to exhibit an hcp structure. In addition, Youssef et al.5) reported that the Al20Li20Mg10Sc20Ti30 alloy prepared by a mechanical alloying process exhibits a single hcp structure from an initial
fcc structure on annealing. These previously reported HEAs with an hcp structure cannot be categorized for possessing feature (2) of having only transition metals as their constituents.
More recently,6)the synthesis of a CrMnFeCoNi HEA with an hcp structure under high pressure has been reported. The CrMnFeCoNi HEA with an hcp structure is unique, but it requires high pressure for its formation, i.e., it does not possess feature (3). Furthermore, a similar exception for feature (3) was reported by Yusenko et al.7) for the IrOs ReRhRu alloy comprising transition metals with near equiatomicity when it was produced as a HEA with a single phase by chemical reaction. The CrMnFeCoNi HEA with an hcp structure is composed of 3d transition metals only,
and hence differs from the feature (4) as the
Ir26Mo20Rh22.5Ru20W11.5 and Ir25.5Mo20Rh20Ru25W9.5 alloys consist of 4d or 5d transition metals. Thus, the revelation of HEAs with the simultaneous achievement of features (1) to (4) provided the motivation for the present study.
The purpose of this study was to determine hcp-structure-bearing HEAs comprising 4d and/or 5d transition metals that can be produced at atmospheric pressure by referring to binary phase diagrams and physical and thermodynamic quantities.
2. Methods
The HEAs with the hcp structure were mainly designed with the assistance of crystallographic structures of each constituent element, periodic chart, and sub binary phase diagrams. Moreover, the alloys were evaluated for the following thermodynamic and physical parameters:
config-+Corresponding author, E-mail: akira.takeuchi.a8@tohoku.ac.jp
uration entropy normalized with gas constant (Sconfig./R), delta (¤) parameter,8)mixing enthalpy (¦H
mix), and valence electron concentration (VEC).9)
2.1 Alloy design
The phase stability is first described by Miedema10) and Friedel11,12) models, followed by a process before selecting a sandwich strategy. A practical strategy for selecting an Ir30Mo22.5Rh25Cr12.5W10 alloy as the first candidate is then described. Finally, the process of determining Ir26Mo20Rh22.5Ru20W11.5 and Ir25.5Mo20Rh20Ru25W9.5 alloys as the final candidates is described along with the alloy design using thermodynamic calculations.
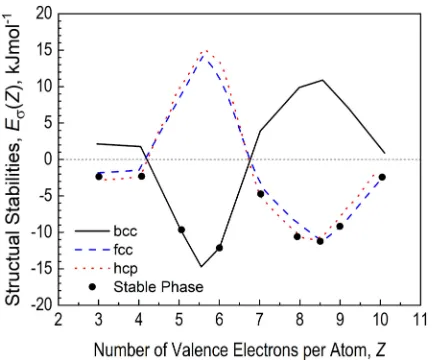
The alloy design started by focusing on the stability of the hcp phase. This study began with the selection of the HEA candidates with the hcp structure by identifying the pure elements from transition metals with the hcp structure at room temperature and by referring to the crystallographic structures of elements illustrated in the periodic chart.13,14)As a result, Sc, Ti, Co, Tc, Ru, Re, and Os were initially selected as the constituent elements for alloying. Next, sub binary phase diagrams15)of the above-selected constituent elements were examined carefully to determine thefirst candidates. In particular, special attention was paid to the presence of the hcp phase in the constituent binary phase diagrams near equiatomic composition. This attention for exact equiato-micity was previously examined as the Pettifor map for binary compounds with 1:1 stoichiometry.16)Similarly, exact and near equiatomicity in the present study was regarded for a sandwich strategy in terms of the VEC of the constituent elements in the periodic chart and based on sub binary phase diagrams. The concept of this strategy from Miedema’s model10,17) as shown in Fig. 1, was based on the structural stabilities, E·(Z), of paramagnetic transition metals in the three main crystallographic structures®hcp, fcc, and bcc® plotted versusZ, the average number of valence electrons per
atom. As shown in Fig. 1, stable phases for integer values of Zare hcp (Z=3 and 4), bcc (Z=5 and 6), hcp (Z=7 and 8), and fcc (Z=9 and 10). YGdTbDyLu and GdTbDyTmLu HEAs with hcp structure3) have been found by referring to Z=3, and the present study aimed to find another type of HEA with an hcp structure in accordance with hcp (Z=7 and 8). The hcp (Z=7 and 8) is located in Fig. 1 in the region between bcc (Z=5 and 6) and fcc (Z=9 and 10), indicating that exact- or near-equiatomic alloys could be formed into alloys with the hcp structure by appropriately mixing the elements with bcc and fcc structure. This implication is a fundamental concept of the sandwich strategy and is partially supported by the Friedel model,11,12) which states that the stability of the hcp structure is achieved when the number of d-electrons (nd) is in the range18,19)of 2.6<nd<3.5 and 6.5<nd<7.4 where nd is its definition of wide sense including the number of outer s electrons and is equivalent to VEC.
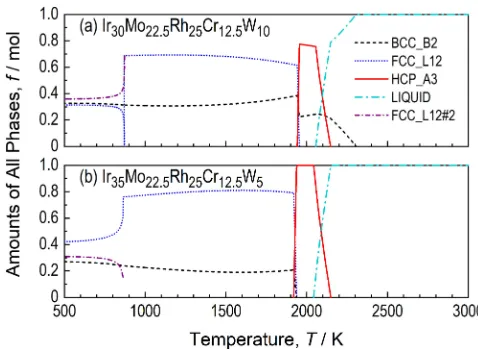
In practice, the application of the sandwich strategy was adopted as follows. First, the authors referred to binary phase diagrams15)and found a solid solution with an hcp structure in Ir60Mo40, Ir60W40, Cr50Rh50, Mo50Rh50, etc. Neither Cr, Mo, and W with VEC (or Z)=6 nor Ir and Rh with VEC=9 from the periodic chart possess the hcp structure as pure elements. However, from Fig. 1, we can deduce that a possible reason for the Ir60Mo40, Ir60W40, Cr50Rh50, and Mo50Rh50alloys to form the hcp structure is that the average value of Z was calculated to be 7.8 for the Ir60Mo40 and Ir60W40alloys and 7.5 for the Cr50Rh50and Mo50Rh50alloys. Consequently, all four binary alloys are located in a region in Fig. 1 where the hcp structure is stable, as shown in dotted curves. Assembling the above four binary alloys with exact and near equiatomicity simply into a quaternary alloy led to an Ir30Mo22.5Rh25Cr12.5W10alloy as thefirst candidate. None of the constituent elements of the Ir30Mo22.5Rh25Cr12.5W10 possesses the hcp structure as pure elements. Then, thermodynamic calculations were performed with Thermo-Calc 2017a with the SSOL5 database for solid solutions. The SSOL5 database was initially used instead of TCHEA2 in the database for HEA, because it was not possible to deal with Ir and Rh using the TCHEA2 database in April 2018. After that, the succeeding database to TCHEA2, TCHEA3 (Ver. 3.0), which was released in May 2018, was used as it could handle Ir and Rh. The first candidate was optimized by monitoring the appearance of a single hcp phase by varying the content of the alloys using the property diagram, as shown in Fig. 2, with axes of temperature and amount of all phases in mol. As a result, an optimized alloy com-position was obtained in Ir35Mo22.5Rh25Cr12.5W5. Figure 2(a) depicts the first candidate (Ir30Mo22.5Rh25Cr12.5W10), whereas Fig. 2(b) demonstrates its optimized alloy (Ir35Mo22.5Rh25Cr12.5W5); both the alloys demonstrated that an hcp phase can exist atT³2000 K, but they were different as the former alloy is a mixture of hcp and bcc, whereas the latter is a single hcp phase. Thus, there is a possibility that the Ir35Mo22.5Rh25Cr12.5W5 alloy can be formed into a single hcp phase at a high-temperature of approximately
2000 K. However, the calculation showed that the
Ir35Mo22.5Rh25Cr12.5W5 alloy was stable only within a limited temperature range of 100 K: 20451945 K. Further-Fig. 1 Structural stabilities,E·(Z), of paramagnetic transition metals in the
[image:2.595.62.278.530.710.2]more, it also became evident that the Ir35Mo22.5Rh25Cr12.5W5 alloy was experimentally difficult to melt homogeneously because of the differences in vapor pressure and melting temperatures between Cr and W. Hence, we considered a third candidate by replacing Cr with Ru.
The sandwich strategy still works somehow in exact- or near-equiatomic IrMoRhRuW alloys regardless of the replacement of Ru with Cr, because Ru with a VEC (orZ) of 8 is put in Mo and W with VEC=6 and Rh and Ir with VEC=9. Besides, Ru has an hcp structure element, but other constituent elements in the IrMoRhRuW alloys possess other crystallographic structures, such as Mo and W have bcc and Ir and Rh have fcc structures. The difference in the combinations of VEC in the Ir30Mo22.5Rh25Cr12.5W10 alloy and IrMoRhRuW alloys, was that VEC=6 (Cr, Mo, and W) and VEC=9 (Ir and Rh) in the former alloy as two-layered VECs, whereas the latter alloy was three-layered
VECs with VEC=6 (Mo and W), VEC=8 (Ru), and
VEC=9 (Rh and Ir). Following the thermodynamic
calculations, which are described in the next section, an Ir30Mo20Rh20Ru25W5 alloy was successfully selected as the third candidate. Furthermore, TCHEA3, which successfully deals with Ir and Rh, was released and hence the further and precise optimization was conducted using Thermo-Calc 2018b with the TCHEA3 database. As a result, an Ir25.5Mo20Rh20Ru25W9.5 alloy was selected as a final
candidate and an additional final candidate,
Ir26Mo20Rh22.5Ru20W11.5 alloy, was selected from a proto-typical Ir20Mo20Rh20Ru20W20alloy with exact equiatomicity.
2.2 Evaluation of quantities
The values of¦Hmixwere calculated based on eq. (1), in which its right-hand side has an assumption that ¦Hmixwas calculated as a quadratic formula with a maximum or minimum at the equiatomic composition in an AB alloy system. In reality, the equiatomic composition can be described as AB, A50B50, or A0.5B0.5, respectively, for the compound-, atomic-percentage-, or atomic-fraction-type. The factor four on the right-hand side of eq. (1) accounts for the value of ¦Hmix at the binary equiatomic alloy, A0.5B0.5, withci=cj=0.5,
Hmix¼4
XN
j6¼i
XN
i¼1
Hijcicj: ð1Þ
For calculating¦Hmix, actual values of¦Hijwere acquired from a previous work.20) However, ¤ was calculated using eqs. (2) and (3),8)
¤¼
ffiffiffiffiffiffiffiffiffiffiffiffiffiffiffiffiffiffiffiffiffiffiffiffiffiffiffiffiffiffiffi
XN
i¼1
ci 1rri
2
v u u
t 100; ð2Þ
r¼XN
i¼1
ciri: ð3Þ
Here,riis the atomic radius of the i-th constituent element and r is the average atomic radius of the alloy defined by eq. (3). The ris of the 73 elements were acquired from the literature21)and also from a previous work.20)
In addition, the values of VEC9)were calculated to clarify the characteristics of the Ir26Mo20Rh22.5Ru20W11.5 and Ir25.5Mo20Rh20Ru25W9.5 alloys. The VEC was calculated by averaging the value assigned to each constituent element, (VEC)iwithci, as shown in eq. (4). The (VEC)iassigned for each constituent element corresponds to the valence (Z) or group in the periodic chart.9)
VEC¼XN
i¼1
ciðVECÞi ð4Þ
The calculated values ofSconfig./R,¤,¦Hmix, and VEC for the Ir26Mo20Rh22.5Ru20W11.5 and Ir25.5Mo20Rh20Ru25W9.5 alloys are summarized in Table 1.
2.3 Experiments
Alloy ingots of ³5 g with nominal compositions of the Ir26Mo20Rh22.5Ru20W11.5 and Ir25.5Mo20Rh20Ru25W9.5(at%) alloys were prepared by arc-melting from raw metals with industrial purity. The raw metals were commercially obtained and had a purity of 99.9 mass%with Ir, Rh, and Ru elements in powder form. Accordingly, these powders were con-solidated separately in advance by arc melting to acquire a bulk form. The 5-g samples were solidified into button-Fig. 2 Property diagram of (a) Ir30Mo22.5Rh25Cr12.5W10 and (b)
[image:3.595.47.286.68.243.2]Ir35Mo22.5Rh25Cr12.5W5 alloys calculated with Thermo-Calc 2017a and SSOL5 database for solid solutions: IrMoRhCrW alloys were not prepared in the present study, but their thermal stability is shown for comparison.
[image:3.595.98.498.712.776.2]shaped ingots of³10 mmºand³5-mm height, such that their button shape was similar to the hemispheroid shape achieved by conventional arc melting. Samples were annealed at a high temperature to confirm the equilibrium phases. The as-prepared ingot was put into a magnesium oxide crucible and annealed in a high-temperature furnace with a graphite heater. The chamber of the furnace was once vacuumed (³10¹2Pa) and then filled with high-purity Ar gas at ambient pressure. After the homogenization annealing, the samples were furnace-cooled. These alloys were cut into two pieces perpendicular to the base, and their structures were examined by X-ray diffraction (XRD) to the cross-sectional area. The morphology of the sample was observed with a scanning electron microscope (SEM), and the chemical composition was analyzed by energy-dispersive X-ray spectroscopy (EDX) equipped with SEM.
3. Results
First, the thermal stability of the phases of the Ir26Mo20Rh22.5Ru20W11.5 and Ir25.5Mo20Rh20Ru25W9.5 alloys as the final candidates was computed as a function
of temperature. As shown in Fig. 3, the
Ir26Mo20Rh22.5Ru20W11.5 and Ir25.5Mo20Rh20Ru25W9.5 alloys exhibit a stable hcp phase for a wide range from T³2500 to 13001400 K. This strongly supports the appearance of the hcp phase in the Ir26Mo20Rh22.5Ru20W11.5 and Ir25.5Mo20Rh20Ru25W9.5 alloy ingots when they solidified even at a low cooling rate. Furthermore, it was expected that these alloys would homogenize when annealed at a high temperature of ³2000 K. In addition, it was anticipated that the actual atomic diffusion would not be sufficient to produce the bcc and fcc phases at temperatures ranging from 1300 1400 to 600 K during solidification. The calculated result shown in Fig. 3 supports the experimental data that the Ir26Mo20Rh22.5Ru20W11.5 and Ir25.5Mo20Rh20Ru25W9.5 alloys
are the stable HEAs with the hcp structure. The
Ir26Mo20Rh22.5Ru20W11.5 and Ir25.5Mo20Rh20Ru25W9.5 alloys formed in the hcp phase precipitate into fcc and bcc phases simultaneously as a eutectoid reaction occurs at T³1400 K in (a) Ir26Mo20Rh22.5Ru20W11.5 and T³1250 K in (b)
Ir25.5Mo20Rh20Ru25W9.5 alloys. The occurrence of these eutectoid reactions would tend to increase the thermal stability of the hcp phase because the precipitation of multiple phases needs a higher driving force as compared with the precipitation of a single phase, and the growth of the precipitated phases competes in growing crystalline grains. The eutectoid reaction in Fig. 3 can be regarded as the confusion principle in terms of the equilibrated phases. Figure 3 indicates that Ru can be a strong hcp-forming element, as described in the previous section.
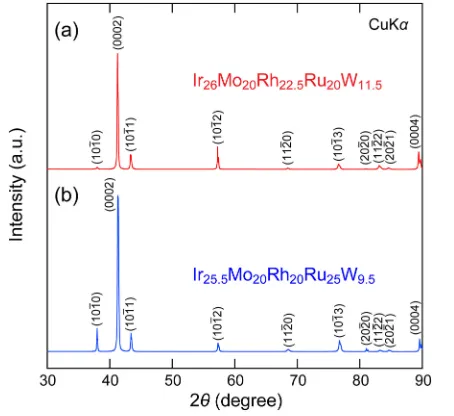
Figure 4 shows XRD patterns of the
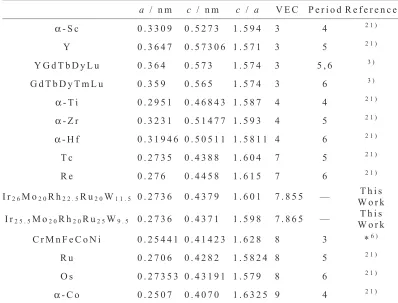
Ir26Mo20Rh22.5Ru20W11.5 and Ir25.5Mo20Rh20Ru25W9.5 alloys annealed at 2373 K for 1 h. The annealing temperature of 2373 K was selected according to the thermal stability of the hcp structure of the alloys, as shown in Fig. 3. The XRD profiles demonstrate that the alloys exhibited distinct sharp peaks corresponding to the presence of crystalline grains. These XRD patterns were identified as the reflections of the hcp structure. The XRD spectra shown in Fig. 4 demonstrate the difference in the relative intensity against each primary reflection from (0002), but they can be indexed in the same manner as an hcp structure. The difference in the relative intensity of each reflection peak is caused by the difference between the crystallographic orientations of the crystalline planes and the sample face. The lattice constants were evaluated asa=0.2736 nm,c=0.4379 nm, andc/a= 1.601 for the Ir26Mo20Rh22.5Ru20W11.5 alloy and as a= 0.2736 nm, c=0.4371 nm, and c/a=1.598 for the Ir25.5Mo20Rh20Ru25W9.5 alloy. These values ofa,c, and c/a are close to those for Ru (a=0.2706 nm, c=0.4282 nm, and c/a=1.5824), as summarized in Table 2. As a whole, Table 2 suggests that the metals and alloys with a VEC of 3 or 4 from the early-transition metals tend to have c/a< 1.6, whereas late-transition metals with a VEC of 7 or more have c/a>1.6, except for Ru and Os (VEC=8) having c/a<1.6. This tendency supports the speculation that the Ir26Mo20Rh22.5Ru20W11.5 and Ir25.5Mo20Rh20Ru25W9.5 alloys can be regarded as the alloys with an hcp structure that possess c/a³1.6, which is a characteristic of the Fig. 3 Property diagram of (a) Ir26Mo20Rh22.5Ru20W11.5 and (b)
Ir25.5Mo20Rh20Ru25W9.5 alloys calculated with Thermo-Calc 2018b and TCHEA3 database.
[image:4.595.48.287.68.242.2] [image:4.595.317.544.70.278.2]late-transition metals with VEC²7. As a preliminary experiment, the XRD analysis was also performed for the arc-melted Ir26Mo20Rh22.5Ru20W11.5 and Ir25.5Mo20Rh20Ru25W9.5 alloys in as-prepared samples; their results are not shown in Fig. 4. Each as-prepared sample exhibited the hcp structure to similar to that of the corresponding annealed sample, wherein the as-prepared samples indicated slightly broad reflection peaks located toward higher angles by 2ª=0.3 in the case of (0002) peaks in Fig. 4.
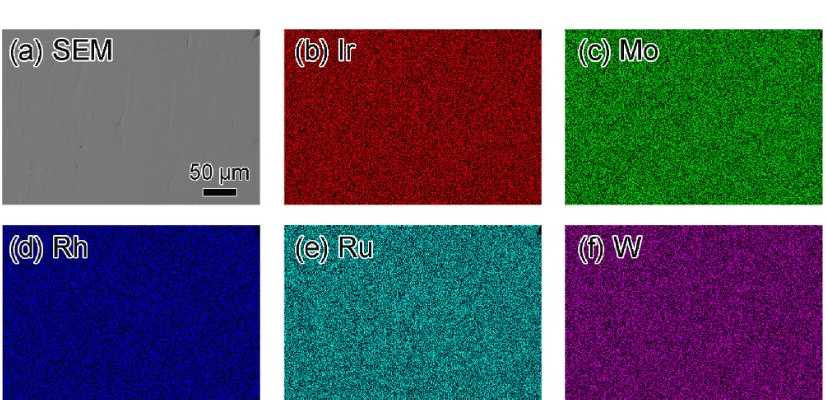
Further investigations were performed by observing with SEM and analyzing the compositions with EDX. Figure 5(a) shows the SEM image and Figs. 5(b)(f ) demonstrate element mapping images of the Ir26Mo20Rh22.5Ru20W11.5 alloy prepared by arc melting. The SEM image demonstrates a well-developed grain-like or dendritic structure with an approximate size of³10 µm. This structure was presumably
created from the collision of a primary crystalline phase during solidification, leaving a small amount of area with dark contrast in Fig. 5(a). The element mapping in Figs. 5(b)(f ) shows that the area is relatively rich in Mo, Rh, and Ru, poor in Ir, and faintly poor in W. The same investigations were also performed for the Ir26Mo20Rh22.5Ru20W11.5 alloy annealed at 2373 K for 1 h, as shown in Fig. 6. The SEM image shown in Fig. 6(a) demonstrates that the alloy is completely homogeneous at a sub-millimeter scale. In contrast to Figs. 5(b)(f ), the constituent elements are homogeneously distributed in Figs. 6(b)(f ) without segregation, precipitating the secon-dary phase. The same morphology was observed in the Ir25.5Mo20Rh20Ru25W9.5 alloy for as-prepared and annealed samples, as shown in Figs. 7 and 8, respectively. The experimental results shown in Figs. 4, 6, and 8 indicate that the Ir26Mo20Rh22.5Ru20W11.5 and Ir25.5Mo20Rh20Ru25W9.5 alloys annealed at 2373 K for 1 h were formed in a single HEA with an hcp structure. Additionally, Fig. 5 reveals that the hcp structure created at high temperature from a melt kept its structure during cooling after arc melting because of the wide temperature range of the stabilized hcp structure, as demonstrated in Fig. 3. In a similar manner, Fig. 7 indicates the high stabilization of the hcp structure in comparison with Fig. 8.
[image:5.595.98.496.100.403.2]The formation of the Ir26Mo20Rh22.5Ru20W11.5 and Ir25.5Mo20Rh20Ru25W9.5 HEAs with an hcp structure was examined for their thermodynamic and physical values. The ¦Hmix, ¤, andSconfig./R of the Ir26Mo20Rh22.5Ru20W11.5 and Ir25.5Mo20Rh20Ru25W9.5 alloys summarized in Table 1 Table 2 Lattice constants of the hcp phase (a,c) and their ratio (c/a) of the Ir26Mo20Rh22.5Ru20W11.5and Ir25.5Mo20Rh20Ru25W9.5alloys:
data of other HEAs3)and referential transition metals21)with hcp structure are also shown for comparison.
[image:5.595.62.279.433.534.2]were plotted out of the zone S for disordered HEAs, and SA for ordered HEAs, in terms of chemically ordering in a ¤¦Hmix diagram,8) as shown in Fig. 9. Here, zone S is a trapezoid area surrounded by edges expressed by the following formulae:22)
ð0:7Þ<¤<4:6 ð5Þ
and
2:685¤2:54<Hmix=kJ mol1
<1:28¤þ5:44: ð6Þ
The location of the plots that are out of zone S is a characteristic of the Ir26Mo20Rh22.5Ru20W11.5 and Ir25.5Mo20Rh20Ru25W9.5 HEAs with an hcp structure. This suggests that zone S, and zone SA, in the ¤¦Hmix diagram are merely a necessary condition for the formation of HEAs and that the new HEAs can be found by focusing on zones exterior to zones S and SA in the future. However, the Ir26Mo20Rh22.5Ru20W11.5 and Ir25.5Mo20Rh20Ru25W9.5 alloys exhibitSconfig./R²1.5, which satisfies a criterion of HEAs.
The VEC values of the Ir26Mo20Rh22.5Ru20W11.5 and Ir25.5Mo20Rh20Ru25W9.5alloys were calculated to be approx-imately 7.868, which agrees with the formation of the hcp phase. In particular, the formation of the hcp structure was fully and partially explained by the value of VEC and the number of d-electrons (nd) of the Friedel model, respectively. A VEC of 7.868 agrees with that for Ru and Os with an hcp structure in the group 8 of the periodic chart, whereas a VEC of ³8 mostly accounts for the stable hcp structure between Fig. 6 (a) SEM image and (bf ) element-mapping images of Ir26Mo20Rh22.5Ru20W11.5alloy annealed at 2373 K for 1 h.
Fig. 7 (a) SEM image and (bf ) element-mapping images of Ir25.5Mo20Rh20Ru25W9.5alloy prepared by arc melting.
[image:6.595.70.526.70.278.2] [image:6.595.62.279.316.415.2] [image:6.595.92.505.570.770.2]the following ranges:18,19)6.5<n
d<7.4 and 2.6<nd<3.5. In previous reports, it was reported that the GdTbDyTmLu and YGdTbDyLu HEAs with the hcp structure have VEC= 3. However, another earlier report9)does not include VEC for hcp, and it just indicates that the VEC values of the bcc, bcc+fcc, and fcc are determined as follows: VEC<6.87 (bcc), 6.87¯VEC<8.0 (bcc+fcc), and VEC²8 (fcc).
4. Discussion
This study is academically significant in terms of alloy design, sample preparation method, and the development of new HEA with the hcp structure. Subsequently, the effects of the present study on the development of the academic science of HEAs with fcc, bcc, and hcp solid solutions will be discussed below.
First, a feature of the present alloy design is highlighted by a unique alloy design based on a sandwiched strategy of VEC, which is accompanied by the optimization of the alloy systems and alloy compositions based on the computational prediction through the CALPHAD method and Gibbs free energy. There are some similar thermodynamic predictions for the formation of HEAs with hcp as well as refractory bcc structure and others made by other researchers, such as Gao et al.2325)However, almost all of these predictions have been made for alloys with exact equiatomicity, alloys with almost equiatomicity but for only one atomic pair with ratios other than 1:1, alloys with four or less constituent elements, and predictions without experimental proof even after the report. Thus, the present alloy design is completely different from these predictions by other researchers. The hcp structure of the HEAs was intentionally optimized, but this suggests that one can obtain HEAs with fcc or bcc structures when fcc or bcc is optimized. Accordingly, when focusing on a HEA
with the fcc structure, the present study will lead to the quantitative analysis by thermodynamic approach based on Gibbs free energy to the stable phases of actual HEAs in terms of TRIP26) (Transformation-Induced Plasticity) that includes lamellar hcp phase in the fcc matrix containing high density stacking faults, twins introduced during deformation, and low stacking fault energy.
As for the sample preparation, the present method, arc melting, is superior to the other methods as it is a conventional method and subsequently anneals at high temperature to homogenize only in the processing. In the other researches, the HEAs with hcp structure were prepared by applying high pressure6) for alloys comprising 3d transition metals, mechanical alloying for light-weighted alloys,5) and chemical reaction7) for alloys consisting of transition metals. The present method exhibits an advantage over the other methods as one can produce enough amount of samples for performing researches at a laboratory scale. As far as high temperature annealing is concerned, selecting high temperature is effective to maximize configurational entropy term, and to obtain a solid solution, but still, a temperature higher than 2000 K is disadvantageous in the processing. However, the present HEA does not always require such high-temperature for forming a single hcp phase due to the presence of a wide temperature range greater than 1000 K at which a single hcp phase can be present stably. This was demonstrated by the formation of the HEAs with hcp structure as almost a single phase in as-prepared samples. Thus, one can assure that the present study took the best method to prepare HEAs. As a result, the method of high-temperature annealing selected in the present study is affected by a characteristic of HEA, high-melting temperature alloys,
which is represented by refractory HEAs with bcc
structure.27)
[image:7.595.136.459.70.315.2]As for the findings of the HEAs with hcp structure, controlling ferromagnetism is significantly important. For instance, high pressure is required to obtain the hcp phase for alloys comprising 3d transition metals. It is specified in the report6) that elements with ferromagnetism prevent the formation of alloys in an hcp phase under ambient pressure for alloys comprising 3d transition metals. Hence, for the present study, we selected 4d and 5d transition metals with paramagnetism in accordance with the alloy design illustrated in Fig. 1. Under the circumstances, the present paper provides that the structure of the solid solutions can be controlled to one’s heart content in accordance with the sandwich strategy for VEC for transition metals in 4d and 5d series with paramagnetism, which should be the inherent nature of the transition metals. Thus, the present paper will bring considerable progress in the fundamental researches for clarifying the formation mechanism of solid solutions in HEAs. It is noteworthy that the success in fabricating a HEA with the hcp structure by chemical reaction, as proposed by Yusenko,7) also indicates the importance of selecting paramagnetic 4d and 5d transition metals. It is expected that HEAs with hcp structure containing ferromagnetic elements can be formed if the 3d ferromagnetic component of the transition metals can be controlled such that they do not exceed the critical concentration of site percolation.28)
As a whole, the present results possess high significance in fundamental research. Furthermore, the present research will contribute in establishing the academic science of HEAs with solid solutions from fcc, bcc, and hcp structures. Moreover, the present study is highly evaluated as pioneer research leading to disclose the unprecedented alloys that originate from the unclearness of the central composition region in multi-component alloys.
5. Conclusions
The alloy design of HEAs, done by referring to exact and near equiatomicity, sub binary phase diagrams, and sandwich strategy in terms of the VEC of the constituent elements and their crystallographic structures in the periodic chart, led to the finding the Ir26Mo20Rh22.5Ru20W11.5 and Ir25.5Mo20Rh20Ru25W9.5 HEAs with an hcp structure. The formation of the HEAs with an hcp structure is enhanced by adding Ru as a strong hcp-forming element under the above alloy design. The formation of the hcp structure was explained by VEC ³8 and was partially supported by the Friedel model in terms of the number of d-electrons (nd) as 6.5<nd<7.4 wherend corresponds to VEC. These HEAs with hcp structure differ from a CrMnFeCoNi HEA as the former alloys are composed of 4d and 5d transition metals only and can be produced by a conventional solidification method without imposing high pressure. Semi-empirical alloy design based on experimental and computational phase diagrams is worth utilizing for the further development of new HEAs.
Acknowledgments
This research was primarily supported by Grant-in-Aids for Scientific Research from the Japan Society for the Promotion of Science (JSPS) through Grant Program of Scientific Research (B) (grant number 17H03375). In part, the research was also supported by Grant-in-Aids for Scientific Research on Innovative Areas on High Entropy Alloys through the grant number JP18H05452.
REFERENCES
1) J.W. Yeh, S.K. Chen, S.J. Lin, J.Y. Gan, T.S. Chin, T.T. Shun, C.H. Tsau and S.Y. Chang:Adv. Eng. Mater.6(2004) 299303.
2) J.-W. Yeh:Ann. Chim.31(2006) 633648.
3) A. Takeuchi, K. Amiya, T. Wada, K. Yubuta and W. Zhang:JOM66 (2014) 19841992.
4) M. Feuerbacher, M. Heidelmann and C. Thomas:Mater. Res. Lett.3 (2015) 16.
5) K.M. Youssef, A.J. Zaddach, C.N. Niu, D.L. Irving and C.C. Koch: Mater. Res. Lett.3(2015) 9599.
6) C.L. Tracy, S. Park, D.R. Rittman, S.J. Zinkle, H. Bei, M. Lang, R.C. Ewing and W.L. Mao:Nat. Commun.8(2017) 15634.
7) K.V. Yusenko, S. Riva, P.A. Carvalho, M.V. Yusenko, S. Arnaboldi, A.S. Sulthikh, M. Hanfland and S.A. Gromilov:Scr. Mater.138(2017) 2227.
8) Y. Zhang, Y.J. Zhou, J.P. Lin, G.L. Chen and P.K. Liaw:Adv. Eng. Mater.10(2008) 534538.
9) S. Guo, C. Ng, J. Lu and C.T. Liu:J. Appl. Phys.109(2011) 103505. 10) F.R. de Boer, R. Boom, W.C.M. Mattens, A.R. Miedema and A.K. Nissen:Cohesion in Metals: Transition Metal Alloys, (North Holland Physics Publishing, a division of Elsevier Science Publishers B.V., The Netherlands, 1988) p. 758.
11) F. International School of Physics, Enrico and W. Marshall:Theory of Magnetism in Transition Metals, (Academic Press, Cambridge, 1967) p. 454.
12) J.M. Ziman: The Physics of Metals, (Cambridge University Press, Cambridge, 2010) p. 433.
13) S. Nagasaki and M. Hirabayashi: Binary Alloy Phase Diagrams, (AGNE Gijutsu Center, Inc., Tokyo, 2004) (in Japanese).
14) A. Takeuchi:J. Japan Inst. Metals79(2015) 157168 (in Japanese). 15) H. Okamoto: Desk Handbook Phase Diagrams for Binary Alloys,
(ASM International, Almere, 2010) p. 855.
16) A. Takeuchi, K. Amiya, T. Wada and K. Yubuta: Intermetallics 66 (2015) 5666.
17) A.R. Miedema and A.K. Niessen:Calphad7(1983) 2736. 18) T. Oguchi: Chapter 5, Intermetallic Compounds in Prediction of
Physical Properties of Materials (Marzen Advanced Technology, Materials Engineering Series), (Marzen, Co. Ltd., Tokyo, 1989) pp. 135170 (in Japanese).
19) T. Oguchi: Band Theory of Transition Metals (Uchida Rokakuho, Tokyo, 2012) p. 123 (in Japanese).
20) A. Takeuchi and A. Inoue:Mater. Trans.46(2005) 28172829. 21) Y. Waseda:Metal Databook, (Maruzen Co. Ltd., Tokyo, 2004) p. 8
(in Japanese).
22) Y. Zhang and Y. Zhou:Mater. Sci. Forum561565(2007) 13371339. 23) M.C. Gao, B. Zhang, S.M. Guo, J.W. Qiao and J.A. Hawk:Metall.
Mater. Trans. A47(2016) 33223332.
24) M.C. Gao, C.S. Carney, A.N. Dogan, P.D. Jablonksi, J.A. Hawk and D.E. Alman:JOM67(2015) 26532669.
25) R. Feng, M.C. Gao, C. Lee, M. Mathes, T.T. Zuo, S.Y. Chen, J.A. Hawk, Y. Zhang and P.K. Liaw:Entropy-Switz18(2016) 333. 26) Z.M. Li, C.C. Tasan, K.G. Pradeep and D. Raabe:Acta Mater.131
(2017) 323335.
27) O.N. Senkov, G.B. Wilks, D.B. Miracle, C.P. Chuang and P.K. Liaw: Intermetallics18(2010) 17581765.