Contribution of Hydrogen Embrittlement to SCC Process
in Excess Si Type Al-Mg-Si Alloys
*1Shuhei Osaki
1, Hideki Kondo
*2and Katsuyuki Kinoshita
11
Department of Mechanical Engineering, Faculty of Engineering, Yamaguchi University, Ube 755-8611, Japan
For underaged Al-Mg-Si alloys with excess Si, No. 5(Al-0.7 mass%Mg-1.1 mass%Si) and No. C5 with 0.2 mass%Cr addition, SSRT tests have been carried out to reveal the contribution of hydrogen embrittlement (HE) to SCC processes at strain rate6:9107s1under three
environments;‹dry nitrogen gas,›wet air with 90% relative humidity andfian acid sodium chloride (ISO) solution. Under env.›, alloy No. 5
with coarse grains shows a decrease in elongation comparing with that under the inert env.‹, while alloy No. C5 with finer gains exhibits rather
an increase. The small areas of intergranular(IG)- and transgranular(TG)-facets both with a feature of wavy slips are observed in contact with the free-surface of the specimens, respectively, which are regarded as an evidence of hydrogen-enhanced localized plasticity. Under env.fi, alloy
No. 5 shows a high susceptibility to SCC, while alloy No. C5 exhibits a low one improved through Cr addition. On SCC fracture surface of alloy No. 5, three modes of IG one with crystallographic pits, IG another with fine ledges and TG one with an appearance of quasi-cleavage are presented, which indicates that the mechanism of plastic deformation localization induced by anodic dissolution plays a dominant role in the SCC. Even though HE is involved in the SCC process, the effect is estimated to remain small.
(Received December 7, 2005; Accepted February 2, 2006; Published April 15, 2006)
Keywords: aluminum-magnesium-silicon alloys, stress corrosion cracking, hydogen embrittlement, anodic dissolution, localized plasticity
1. Introduction
Al-Mg-Si base alloys having properties of a good balance among strength, formability, and corrosion resistance have been widely used as structural materials for automobile-bodies requiring weight saving. Recently the application to a liner of high-pressure hydrogen container for hydrogen-fuel cars has been regarded as promising.1) The present base alloys usually exhibits a high resistance to stress corrosion cracking (SCC),2)while those having an excess Si or with
addition of Cu in order to improve strength and formability are not completely safe, together with fears of intergranular corrosion.3–5)A probable embrittlement in hydrogen
environ-ments has been also reported.6)Then it becomes an important
issue to evaluate the properties with respect to SCC and hydrogen embrittlement (HE) for the sake of securing the reliability.
SCC mechanisms have been conventionally debated through classifying into two categories of anodic dissolution (AD) and hydrogen effects, but experimental results and new models presented7–10)in recent years indicate that the above discussion is not sufficient; they demand that SCC process should be understood as the interactions under applied stress between AD and plastic deformation (dislocation mobili-ty)8,9) or among AD, plastic deformation and hydrogen
effects.10)
Regarding HE also, in spite of quite many systems of materials and environments studied and a variety of mechanisms proposed, incomplete understanding is still obtained. On account of the experimental evidence that hydrogen brought about a loss of ductility to materials and on the other hand could cause an improved plasticity or a decrease in flow stress,11)Birnbaumet al.12,13)have used a
descriptive term of hydrogen-related fracture (HRF) instead of HE. They classifies HRF to three viable mechanisms; (1) embrittlement resulting from hydrogen-related phase changes, (2) hydrogen-enhanced localized plasticity and (3) hydrogen-induced decohesion. For aluminum alloys, the second mechanism (2) seems most possible. That fracture process is a highly localized plastic failure resulted from stress-hydrogen-dislocation interactions, which is supported by some experimental evidence.14,15) Then rightly, HRF is
more suitable for general terms rather than HE, but the present paper is still described in terms of the latter according to custom.
With respect to selection and application of Al-Mg-Si base alloys, it is important to understand how hydrogen concerns with SCC process and what relation exists between SCC and HE. However most of the conventional studies have been carried out only from the viewpoint of presuming SCC and HE to be a separate phenomenon, so that the relationship between the two is not well demonstrated.
In the present study, in order to evaluate properties of embrittlement and/or SCC in Al-Mg-Si alloys with excess Si and to reveal the contribution of HE to the SCC process, slow strain rate tensile (SSRT) tests were carried out under environments prepared with the aim of separating AD and hydrogen effects.
2. Experimental
2.1 Materials and heat treatments
Al-Mg-Si alloys with excess Si, No. 5 and No. C5, supplied as common samples4) in a group of studying
‘‘materials science near grain boundaries’’ supported by JILM, were received as cold-rolled plate 1 mm in thickness. Alloy No. C5 has additions of Fe and Cr of each 0.2 mass% for grain refinement. The chemical composition is listed in Table 1. The alloys were solution treated at 813 K for 3.6 ks, water quenched and subsequently aged in the underaging condition at 443 K for 3.6 ks in an oil bath. The time to the
*1This Paper was Originally Published in Japanease in J. Japan Inst. Light
Metals56(2006) 121–127.
*2Graduate Student, Yamaguchi University. Present address: Tosoh Ltd.,
Shyunan 746-8501, Japan
peak-aging condition at 443 K was near 28.8 ks for each of the alloys. Average grain size on the rolled plane was 150-200 and 65mmfor alloy No. 5 and No. C5, respectively.
2.2 SSRT tests
2.2.1 Evaluating susceptibility to embrittlement or SCC
SSRT tests were carried out using a compact tensile specimen shown in Fig. 1, with a gauge length of 12 mm and a width of 5 mm, machined out in the transverse direction of plates. The specimen surface was prepared by polishing with emery papers up to #1000, cleaning in 10%NaOH solution at 303 K, followed by dipping in 10%HNO3, rinsing with distilled water and drying. Overall surface except the gauge area of specimen was coated by lacquer and adhesive resign to avoid bimetallic corrosion between the specimen and pull-rods made of stainless steel. SSRT tests were performed at a strain rate of6:9107s1(tensile rate:5104mm/min) under the following three environments;
‹ DNG: dry nitrogen gas as a standard inert environment at2981K
› RH90%: wet air with relative humidity of 90% at
3031K
fi ISO sol: 30 gNaCl/l+10 mlHCl/l acid solution at
2981K, based on ISO 11846-B2 ‘‘Methods of intergranular corrosion testing for solution heat-treat-able aluminum alloys’’16)
As for env.‹orfi, a cylindrical glass cell (volume content: about 500 ml) was used and fixed on the pull-rod to which a specimen was already attached. In case env.‹ high purity DNG was introduced into the cell through a desiccating cylinder, while in case env.fiaerated ISO solution of about 350 ml was poured. For env.›, wet air was supplied from a unit type ventilator into a test chamber fitted among support pillars of the SSRT testing machine, and the atmosphere in the chamber was controlled in a fixed condition of RH90%-303 K during test.
Susceptibility to embrittlement or SCC was evaluated from the following equation indicating a reduction ratio of elongation in environments causing embrittlement to that in a standard inert environment.
I¼0
0
; ð1Þ
where 0 and are elongation in env.‹ and env.› or fi, respectively.
2.2.2 Replacing environment tests
For the purpose of estimating the contribution of HE to SCC process, replacing environment tests were carried out. On the way of the usual SSRT test under strain rate 6:9 107s1, env.fiwas replaced as follows, at the point in time when it reached the maximum load in load-elongation response.
(i) env.fi! env.‹ (ii) env.fi! env.›
Namely, up to the maximum load point under the first env.fi, SCC cracks should have grown to a given depth from the specimen surface. Then we intend to present by means of fractographic observations how the subsequent crack exten-sion can be distinguished between under the secondary env.‹ and›.
By replacing environments, in the former case (i) both anodic dissolution and hydrogen entry must be intercepted, while in the latter case (ii) hydrogen should remain to be supplied.17) About the procedure for the replacement, just
after ISO solution in the glass cell was drained, the specimen was rinsed by distilled water, dried up with a cool-blow dryer and then exposed to env.‹ or ›. During about 5 minutes required for the replacement the SSRT test was continued without interruption. Fracture surface of ruptured specimens was observed using both a low-vacuum type scanning electron microscope (LV-SEM) and a high-resolution field emission type SEM.
3. Results
3.1 Properties of embrittlement and SCC
[image:2.595.46.288.85.125.2]Stress()–strain(") diagrams of SSRT tests in alloy No. 5 and alloy No. C5 are shown in Fig. 2 and Fig. 3, respectively. Every-"relations is a representative example obtained from 2 or 3 times SSRT tests under each environment. The tensile properties and the indexI of susceptibility to embrittlement are listed in Table 2. The tensile strength and elongation () of alloy No. 5 under the inert env.‹are 278 MPa and 23%, Table 1 Chemical compositions of the alloys (mass%).
Alloy Si Fe Cu Mn Mg Zn Cr
No. 5 1.07 0.03 <0:01 <0:01 0.7 <0:01 — No. C5 1.09 0.21 <0:01 <0:01 0.74 <0:01 0.21
Fig. 1 Tensile specimen for the SSRT test.
0
0.1
0.2
0.3
0
100
200
300
400
Env. DNG RH90% ISO
Strain,
ε
σ
Stress,
/MPa
[image:2.595.48.285.85.262.2] [image:2.595.317.539.604.766.2]while these of alloy No. C5 with finer grains are 319 MPa and 27%, respectively, superior in strength and ductility. In the case of alloy No. 5 (Fig. 2),under env.›RH90% was found
to decrease slightly than that under env.‹, leading to I¼
0:09. On the other hand, under env.fiISO sol. decreased remarkably to 1.2%, presenting a very high susceptibility of
I¼0:95. This embrittlement is obviously due to a marked SCC extension as mentioned later. In the case of alloy No. C5 (Fig. 3), rather a slight increase in under env.› in comparison with under env.‹ was observed, leading to a negativeI¼ 0:1. At the same time, the value of reduction of area increased from 49% to 57%, providing a surer evidence of enhanced ductility. As for under env.fi, alloy No. C5 relative to alloy No. 5 showed a smaller reduction in andI¼0:27.
In brief, when tested in 90%RH air of env.›, the coarse grained alloy No. 5 brings about the embrittlement as a decrease in elongation comparing with that under the inert env.‹, whereas the finer grained alloy No. C5 exhibits a unique behavior of enhanced ductility, although in any case the values ofI stand at small 0.09 and0:1for alloy No. 5 and alloy No. C5, respectively. Under ISO solution of env.fi, SCC occurs so inevitably that alloy No. 5 shows a high susceptibility, while alloy No. C5 presents a substantial increase in SCC resistance. Such SCC susceptibilities dependent on Cr addition for the underaged alloys are similar in tendency to these for the peak-aged alloys, as reported on the previous paper.4,5) Then it is clear that the
grain refinement plays a useful role to improve SCC resistance.
3.2 Fractography of fracture surfaces
Figure 4 provides typical SEM images showing fracture surface of the SSRT specimens under env.‹. The fracture surface of alloy No. 5 consisted of two types of areas, the transgranular ductile fracture with dimples (TGDF;
repre-0
0.1
0.2
0.3
0
100
200
300
400
Env. DNG RH90% ISO
Strain,
εσ
Stress,
/MPa
[image:3.595.59.282.72.241.2]Fig. 3 Stress()–strain(") curves on the SSRT test for alloy No. C5.
Table 2 Tensile properties and index I of susceptibility to embrittlement on the SSRT test.
Alloy Env. B(MPa) (%) ’(%) I
‹ 278 23 47 —
No. 5 › 278 21 39 0.09
fi 158 1.2 0 0.95
‹ 319 27 49 —
No. C5 › 319 30 57 0:1
fi 311 20 42 0.27
B: Tenesile strength,: Elongation: Reduction of area
(c)
100 m
(a)
(b)
(d)
µ
10 m
µ
5 m
µ
[image:3.595.46.290.306.396.2] [image:3.595.114.484.488.770.2]sented with a symbolM2in the following Table 3) and the intergranular fracture with sharp edges of intergranular facet, as illustrated in Fig. 4(a), where an uneven reduction in specimen thickness was found. Fine dimples was observed also on the intergranular facets, as presented in the magnified image Fig. 4(b). This feature has been characterized as the intergranular ductile fracture (IGDF; represented with a symbol M1), resulted from a preferential fracture along intergranular precipitate-free zones (PFZ) had been formed during aging. In the case of alloy No. C5, the fracture surface was overall composed of TGDF, where a relatively uniform reduction in specimen thickness was shown in Fig. 4(c). The area (marked with ) close to the free surface of specimen, having an appearance of smooth fracture surface, is found to form shear-lips developed by a shearing-off process, as shown in the magnified image Fig. 4(d).
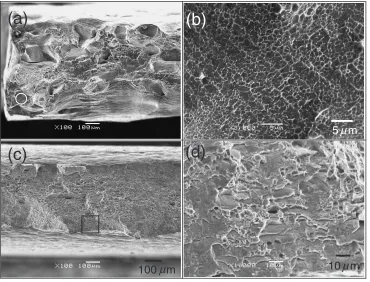
Figure 5 shows the fractographic features of the SSRT specimens under env.›RH90%. The alloy No. 5 exhibits a more brittle feature having a less reduction in specimen thickness, as clearly shown in Fig. 5(a) in comparison with Fig. 4(a). Fig. 5(b) presents the magnified image of the area marked with including the free-surface edge of specimen.
Bounding on an area of the same IGDF with Fig. 4(b), a unique intergranular fracture area with a smooth feature (represented with a symbol H1) was observed. This inter-granular fracture surface was noticed to extend in the range of width from below a single grain to double grains and then to change into the IGDF area. According to more detailed observations, fine striations arranged parallel to the free-surface edge was found out, regarded as a trace of slip deformation. The generation of this fracture surface is therefore estimated to have induced the decrease in or . Also in the case of alloy No. C5, it appeared that the fractograhic feature was similar with that under env.‹ as shown in Fig. 5(c), but such areas having wavy slip steps as shown in Fig. 5(d) at the higher magnification were found to take place at multi-sites in contact with the free-surface edge and then to transform toward inside to the shear-lip zone similar with one of Fig. 4(d). It appears that the formation of these areas gives rise to the increase in.
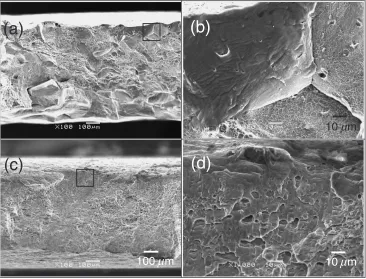
Figure 6 presents a SEM image of fracture surface of alloy No. 5 under env.fi ISO solution. From the detailed obser-vations, the fracture surface was classified to the following 5 types of feature. The symbol for classification according to the following Table 3 is represented in parentheses.
(a) intergranular fracture surface with crystallographic pits (S1(a))
(b) intergranular fracture surface with fine ledges (S1(b)) (c) quasi-cleavage like transgranular fracture surface (S2) (d) IGDF fracture surface (M1)
(e) TGDF fracture surface (M2)
[image:4.595.46.290.85.177.2]Under the present env.fi, a serious extension of SCC took place, exhibiting the former three features (a), (b) and (c) symbolized with S1(a),S1(b)andS2, respectively. (d) and (e) are the same as the purely mechanical those under env.‹ Table 3 Classification of fracture-surface modes.
Env. Type 1. Intergranular 2. Transgranular
‹DNG Mechanical M1fine dimples M2dimples
›RH90% Hydrogen-related H1wavy slip H2wavy slip
fiISO sol. SCC S1(a) S2
Crystallographic pit Quasi-cleavage S1(b)
Ledge pit
(a)
10 m
µ
(d)
100 m
µ
(c)
10 m
µ
(b)
[image:4.595.115.481.489.768.2]DNG, represented with M1 and M2, respectively. These were found to locate at only small areas in the specimen of Fig. 6. The fracture surface S1(a), which is accompanied with crystallographic pits indicating preferential dissolution of (100) planes, extended from several sites of the free-surface edge toward inside of the specimen. Figure 7(a), provided as the magnified image of part a in Fig. 6, shows the transitional area from S1(a) to S1(b). The intergranular fracture surface as part b of Fig. 6, having a smooth feature in appearance, isS1(b)which forms a principal area occupying
most of all the SCC fracture surface. The magnified image of part b is provided as Fig. 7(b). The further magnified FE-SEM image is Fig. 7(c), exhibiting fine and regular arrange-ment of ledges together with traces of pitting dissolution. Then near the mid-part in Fig. 6 (the areas surrounded with a white line at a little lower part from the center), the fracture surfaceS2is found out. The magnified image of part d within the area is given as Fig. 7(d). This is evidently transgranular and quasi-cleavage like in appearance. Judging from that the areaS2is located between the areas ofS1(b)on both sides, or next to the area M2 of a mechnical final rupture, it has probably developed in the stress condition with severe plastic constraints at the final stage of SCC process.
3.3 Replacing environment tests
For alloy No. 5, the replacing environment tests (i) and (ii) were carried out, where on the way of the SSRT test under env.fi ISO solution is replaced with env.‹ or env.›, respectively. Figure 8 presents an example of the –" diagrams in comparison with that under each environment (as previously shown in Fig. 2). The replacement was served on the maximum-load point indicated with the arrow, when the elapsed time from the start of tests (i) and (ii) was 15.8 h and 12 h, respectively. In the case of (i), a slight reduction in stress during the replacement was found, subsequently followed by the recovery of, where the specimen showed approximately"¼8% in fracture strain. In the case of (ii), once a relatively large reduction in was found after replacing, recovered and then decreased to a very low value, indicating a feature of ductile fracture. According to SEM observations of the ruptured specimen of test (i),
a
b
d
e
e
Fig. 6 SEM micrographs showing fracture surface of alloy No. 5 under the environmentfi(ISO solution).
(b)
c
(a)
(c) (d)
1 m
µ
10 m
µ
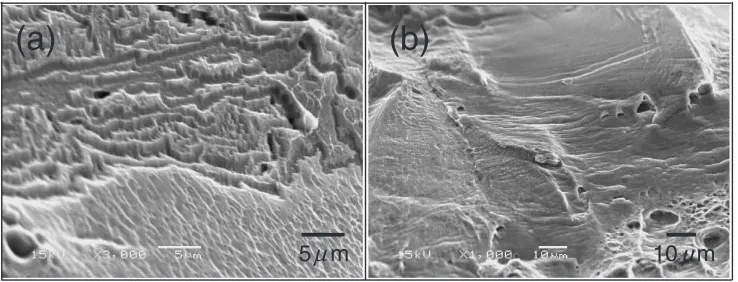
[image:5.595.49.289.73.266.2] [image:5.595.115.485.462.766.2]intergranular SCC cracks extended to about 100mmin depth from the free-surface edge, where the fracture surface inside from this SCC area was found to change to the mechanical ductile fractureM1orM2. Figure 9(a) presents an example of SEM image indicating the shift fromS1(b)toM1. In the case of (ii), on the other hand, the fracture surfaceH1same in form as Fig. 5(b) was often observed to stand in between
S1(b)andM1or M2. Fig. 9(b) shows an example of SEM image presenting the border area fromH1toM1orM2. Here the free-surface edge of specimen is in the position parallel to the upper side of the present figure, and above this view SCC fracture surfaceS1(b)is spreading.
4. Discussion
For the Al-Mg-Si base alloy with an excess Si the SSRT tests were carried out under the three environments. As a result, each of the characteristic forms in fracture surface was found out. These fracture surfaces can be arranged by classifying into 1. intergranular(IG) mode and 2. trans-granular(TG) mode, as listed in Table 3. Under env.‹DNG, the purely mechanicalM1andM2which both represent the characteristic of ductile fracture took place. Both of these coexisted in the coarse-grained alloy No. 5, while the latter was dominant in the finer-grained alloy No. C5. Under env.› RH90%, H1 and H2, which both show the trace of wavy
slips, were observed in alloy No. 5 and No. C5, respectively, where the elongation compared with that under env.‹ decreased in the former, while increased in the latter. Since each of these fracture surfaces was found in contact with the free surface of the specimens, it is regarded as a sign of hydrogen related fracture (HRF).12) Although it is well
known that the SCC of a high-strength 7075 aluminum alloy can relate with or primarily result from HE, the mechanism of HE itself has not been completely understood. Birnbaumet al.12,13) have expressed that hydrogen-enhanced localized
plasticity (HELP) is available in many proposed mecha-nisms. The HELP mechanism is based on the evidence of localized plastic deformation induced by hydrogen effects, having been generally observed in a large number of systems, both pure metals and alloys, ferrous and non-ferrous alloys, and in bcc and fcc crystal structures. As pointed out by them, because of the highly localized nature of ductile fracture, either increase or decrease in ductility (elongation or reduction of area) and either hardening or softening in flow stress can be observed when measured for a macroscopic specimen. By anin situenvironmental-cell TEM deformation technique, they concluded that hydrogen enhanced disloca-tion mobility and reduced the flow stress for aluminum materials, 7000 series alloy14)and high-purity aluminum.15)
Moreover from FEM analysis for the hydrogen effects in pure Ni and Ni-C alloys13) they presented that the formation of hydrogen atmospheres around dislocations due to the interaction among dislocation, hydrogen and stress and the resultant stress shielding effect should lead to an increased velocity. The behavior of plastic deformation and the generation of fracture surfaceH1orH2under env.›suggest the validity of HELP mechanism. Namely, the fracture surfaceH1on the coarse-grained alloy No. 5 is regarded as a result of the localized plasticity by slip deformation con-centrated at intergranular PFZs and then the local initiation of IG micro-crack impedes a uniform deformation of the specimen, leading to the decrease in macroscopic elongation. On the other hand, the fracture surfaceH2seems to be a trace of enhanced transgranular slips at the near-surface region, and this promoted surface plasticity will retard the growth of shear-lip, resulting in the increase in both elongation and reduction of area.
As for under env.fi, the generation of fracture surface in the coarse-grained alloy No. 5 exhibiting the high SCC
0.1
0.2
0.3
100
200
300
400
0
Strain,
εStress,
/ MPa
σ
Alloy No.5
( )
( ) (( ):Env.):Env.
Fig. 8 Stress()–strain(") curves on the SSRT test with replacing environ-ment for alloy No. 5.
(a)
5 m
µ
(b)
10 m
µ
Fig. 9 SEM micrographs showing fracture surface of alloy No. 5 on the SSRT test with replacing environment. (a) Env.fi!‹, and
[image:6.595.58.282.73.237.2] [image:6.595.114.483.616.757.2]susceptibility is here discussed. The SCC extended from the specimen surface into inside with changing the fracture surface modes, S1(a)!S1(b)!S2, following finally the mechanical rupture with the feature of M1 or M2. The fracture surface S1(a), attended with (100) type crystallo-graphic pits as a sign of preferential dissolution, is regarded as the early-stage one, which has the characteristic of ‘‘IG corrosion assisted –type’’ SCC before shifting to the main SCC fracture surface S1(b). S1(b) represented both the crystallographic feature of regular arrangement of ledges and the trace of pitting dissolution in the higher magnified image (Fig. 7(c)). From the more detailed observation, the ledges were found to be composed of the regular arrays of terrace-like planar facets and the fine zigzag parts linking the terrace facet to another, where the former seems to consist of {111} slip planes, and the latter the preferentially attacked {100} planes, respectively. These fractographic observations sup-port the previous discussion4,5) that the SCC of the present
alloy in ISO solution is ‘‘strain-generated active path corrosion type’’, attributed to the localized interaction between anodic dissolution and plastic deformation along grain boundary zones. Regarding a substance of the inter-action, some models explaining the localized plastic defor-mation promoted by anodic dissolution have been proposed primarily from the viewpoint of TG-SCC in fcc alloys. Among those, EIDEL(Environment-induced deformation localization) mechanism introduced by Meletiset al.9)seems available to the present SCC. Namely, based originally on the AVG (Anodic vacancy generation) model by Uhliget al.,18) the mechanism is principally grounded on the enhanced dislocation mobility, accompanied by the following repeated processes at the surface layer; anodic dissolution-vacancy generation-dislocation nucleation-formation of planar dislo-cation arrangement-{111} micro-cracking-anodic dissolu-tion. The present alloy provides the PFZs along grain boundaries for the surface layer favorable for dislocation-pile up, leading to the IG-SCC with the fracture surface
S1(b). At the final stage of SCC fracture, however, since the higher stress field at tip of the extended crack makes possible for dislocation to be injected further into grain interiors, TG-SCC can extend at a higher velocity than that of IG-TG-SCC, then resulting in the shift of fracture mode toS2. Even though the fracture surface S2 is brittle and quasi-cleavage like in appearance as shown in Fig. 7(d), it is very similar to the TG-SCC fracture surface reported19)in Al-Zn-Mg alloys. In spite of a still remained disagreement concerning the crystallog-raphy of TG-SCC in aluminum alloys, it is highly probable that the fracture facets are on {110} planes.19)The point of
view agrees with one expected from EIDEL model, because micro-segments of crack are on {111} planes and also more than one slip plane are facilitated, causing cracking on a {110} overall orientation.
As above discussion the present SCC can be interpreted as the result of interaction between anodic dissolution and localized plastic deformation. There still remains however the possibility that hydrogen plays a role in the SCC process. The point of view was then studied during the replacing environment tests. We there intended the interception of both electrochemical dissolution reaction and hydrogen supply by removing the SCC environment in the case of test (i), while
only the former interception in the case of test (ii). For test (i), the fracture surface mode was found to shift directly from
S1(b)to the mechanical one,M1orM2. Provided hydrogen entry and accumulation ahead of crack root have been formed, HE fracture surface is expected to intervene, but no evidence was observed. Only for test (ii), a small intervention of the fracture surface H1 was found. It is consequently supported that the mechanism of plastic deformation local-ization induced by anodic dissolution plays a dominant role in the SCC of the present system alloys and even though the HELP mechanism operates its concern remains small. Although hydrogen effects may be more responsible for the formation of the TG fracture surfaceS2, anodic dissolution is still estimated to govern predominantly the SCC.
5. Conclusions
For underaged Al-Mg-Si alloys with excess Si, No. 5(Al-0.7 mass%Mg-1.1 mass%Si) and No. C5 with 0.2 mass%Cr addition, SSRT tests have been carried out at strain rate
6:9107s1under three environments;‹dry nitrogen gas,
›wet air with 90% relative humidity andfian acid sodium chloride (ISO) solution. Based on the test results and fractographic observations, the possibility for hydrogen embrittlement (HE) to play a role in the SCC process is discussed. The obtained results are as follows.
(1) Under the inert env.‹, the intergranular(IG)- and/or transgranular(TG)-fracture surfaces symbolized with
M1 and M2, respectively, which both represent the characteristic of ductile fracture, are observed. (2) Under env.›RH90%, alloy No. 5 with coarse grains
shows a decrease in elongation comparing with that under Env.‹, while alloy No. C5 with finer grains exhibits rather an increase, where the small areas of
IG-H1 and TG-H2 facture surfaces are found in contact with the free-surface of the specimens, respectively. These are regarded as an evidence of hydrogen-enhanced localized plasticity.
(3) Under env.fi, alloy No. 5 shows a high susceptibility to SCC, while alloy No. C5 exhibits a low one that improved through Cr addition. On SCC fracture surface of alloy No. 5, three modes of IG-S1(a)with crystallo-graphic pits, IG-S1(b)with fine ledges and TG-S2with an appearance of quasi-cleavage are presented, which indicate that the mechanism of plastic deformation localization induced by anodic dissolution plays a dominant role in the SCC.
(4) Even though HE is involved in the SCC process, the effect is estimated to remain small.
Acknowledgements
REFERENCES
1) NEDO Report ‘‘Fuel cellDevelopment of hydrogen tcchnologies —Development of basic technologies primarily on the utilization of hydrogen—’’, (2004) pp. 33–45.
2) E. H. Hollingworth and H. Y. Hunsicker:Metals Handbook13(ASM) pp. 583–609.
3) R. Braun: Werkstoffe und Korrosion45(1994) 255–263.
4) S. Osaki, K. Kinoshita and D. Naganuma: J. Jpn. Inst. Light Met.53 (2003) 157–162.
5) S. Osaki, H. Kondo and K. Kinoshita: J. Jpn. Inst. Light Met.55(2005) 350–356.
6) S. Kuramoto, M. Hsieh and M. Kanno: J. Jpn. Inst. Light Met.52 (2002) 250–255.
7) D. A. Jones: Metall. Trans.16A(1985) 1133–1141.
8) M. J. Kaufman and J. L. Fink: Acta Metall.36(1988) 2213–2228.
9) K. Lian and E. I. Meletis: Corrosion52(1996) 347–355.
10) T. Magnin, A. Chambreuil and B. Bayle: Acta Mater.44(1996) 1457– 1470.
11) K. Oguri and H. Kimura: Scripta Metall.14(1980) 1017–1022. 12) H. K. Birnbaum: Proc. 1st Int. conf. on Environment-Induced Cracking
of Metals (1988) pp. 21–29.
13) H. K. Birnbaum and P. Sofronis: Mate. Sci. Eng.A176(1994) 191–202. 14) G. M. Bond, I. M. Robertson and H. K. Birnbaum: Acta Metall.35
(1987) 2289–2296.
15) G. M. Bond, I. M. Robertson and H. K. Birnbaum: Acta Metall.36 (1988) 2193–2197.
16) International standard ISO 11846:1995(E).
17) G. A. Young Jr. and J. R. Scully: Metall. and Mater. Trans.33A(2002) 101–115.