Improvement in the Frequency Response of Loudspeakers
by Using Diamond-Like Carbon Film Coatings
Chii-Ruey Lin
1, Shin-Hwa Liu
2, Wang-Jeng Liou
1;*and Chien-Kuo Chang
11Graduate Institute of Mechanical and Electrical Engineering, National Taipei University of Technology,
Taipei 10608, Taiwan, R. O. China
2Graduate Institute of Vehicle Engineering, National Taipei University of Technology,
Taipei 10608, Taiwan, R. O. China
It is well known that a diamond-like carbon (DLC) film has a high mechanical hardness and Young’s modulus. One of the beneficial properties of a DLC film is its ability to change the sound velocity in loudspeakers through its application as a hard coating. In the present study, DLC films were coated onto polyetherimide (PEI) diaphragm substrates at low temperature with radio-frequency (RF) magnetron sputtering. Amorphous DLC films deposited at an RF power of 150 W and with a deposition time of 3 h have a highID=IGratio and a low surface roughness.
TheID=IGratio and surface roughness were 2.27 and l.21 nm (Ra), respectively. From frequency response analysis of the DLC film on the
diaphragm, we found that the frequency response increased by0:21:2dB on average. This confirmed the excellent adhesion of DLC films onto PEI (or polymer) substrates for future potential applications in acoustic wave devices. [doi:10.2320/matertrans.M2011080]
(Received March 10, 2011; Accepted July 11, 2011; Published September 25, 2011)
Keywords: diamond-like carbon (DLC) thin-film coatings, acoustic, frequency response, diaphragm
1. Introduction
The mini dynamic loudspeaker was successfully devel-oped by Mr. Eugen Beyer, a German scientist, during the 1930s. We now find its ubiquitous application to mobile devices, such as mobile phones, MP3 and MP4 players, and laptops. The more we become accustomed to these techno-logical conveniences, the more we rely upon mini speakers of better quality. The total quality of the loud-speaker depends on the performance indexes of its 4 main constituent subsystems: the vibration system, magnetic system, the coupling system between the aforementioned two systems, and support systems. We must see it from a holistic viewpoint instead of a compartmentalized viewpoint. Apart from the vibration system, the other 3 systems have been well developed. The quality of the diaphragm of the vibration system will be based on 3 essential requirements, outlined below.1,2)
(1) The modulus of the diaphragm material will be as high as possible to provide a wider range of frequency responses and lower distortion.
(2) The density of the diaphragm material will be as low as possible in order to increase the fidelity.
(3) The intrinsic damping capacity of the diaphragm material will be such that loudspeaker partition vibra-tion is attenuated.
The audible frequency of human hearing ranges from 20 Hz to 20 kHz.3)Since the demarcations of low, medium, and high frequency ranges are not clearly defined, this study assigns a definition of low frequency (LF) as 100710Hz, mid-frequency (MF) as 7505:6kHz, and high frequency (HF) as 640kHz. Each frequency band is further divided into three discrete narrow bands, LF: 100180Hz, 190355Hz, 375710Hz; MF: 750Hz1:4kHz, 1:5
2:8kHz,35:6kHz; and HF: 611:2kHz,11:822:4kHz,
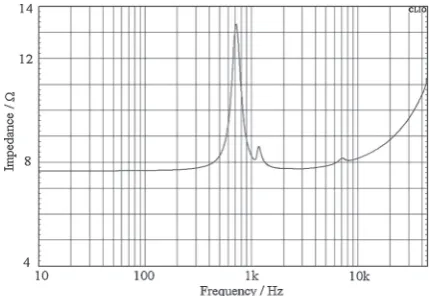
23:640kHz. Resonance frequency fo of a loudspeaker is representative of the loudspeaker at the initial point of the frequency response. According to this theory, we could find out the resonance frequencyfoby eq. (1). This research used a CLIO audio test system to conduct sampling and measure-ment by tracing through the characteristic impedance curve, as shown in Fig. 1.
fo¼ 1
2
ffiffiffiffiffiffiffiffiffiffiffiffiffiffiffiffiffi
1
moCo
s
ð1Þ
where
fo: Resonance frequency (Hz)
Co: Compliance
mo: Total mass of vibration system
mo¼mdþmcþmad
md: Mass of diaphragm
mc: Mass of coil
mad: Mass of additional air, equal to8ad3=3
a: Density of air
d: Effective diameter of diaphragm
Fig. 1 The Impedance curve andfofrom the examination.
*Corresponding author, E-mail: [email protected]
[image:1.595.318.533.349.497.2]Since 1887, beryllium has been used innovatively by Yamaha for loudspeaker diaphragms in treble units. In 1968, they accomplished automatic completion of cone and form-ing equipment used in low-frequency diaphragms material from plant fiber to animal fibers, man-made fibers, and reinforced fiber polymer. The qualities of the frequency response and the maximum frequency have therefore increased significantly. In the late 1970s, many kinds of polymers and ceramic materials were developed, such as carbon fiber (1973), beryllium composites (1976), aluminum, titanium, boron alloy, magnesium alloy, pure beryllium (1978), carbon-graphite (1979), ceramic graphite (1987), graphite composite materials, and all-crystalline diamond material (1989). In 1986, Japan Sumitomo Electric Company primary produced a DLC/Ti composite cone.
A loudspeaker diaphragm needs to have high rigidity, low density, high sound propagation velocity, and high heat conduction, as shown in Table 1.4,5) The mass of the diaphragm plays an important role in determining the frequency response directly; that is, a lighter loudspeaker diaphragm manifests better frequency response. A high-quality tweeter diaphragm must be made of highly rigid, thin, and light material. In recent years, DLC films have been used in loudspeaker diaphragms, which would improve the frequency response drastically. DLC films retain most diamond properties, such as chemical inertness, high me-chanical hardness, high Young’s modulus, and high sound conduction velocity.6) The properties of DLC films are conducive for their use in loudspeaker diaphragms owing to the fact that their properties can vary from those of diamond (sp3 bonding) to those of graphite (sp2 bonding). The
diamond (sp3 bonding) properties can be used to increase
the sound velocity (E=) in the loudspeakers.7,8)
Microelectronics and measuring systems (MEMSs),9)and electro-optical systems, piezoelectric systems10–12)have been previously employed in acoustic wave device studies. Furthermore, materials combined with various kinds of metal-substrates, such as aluminum13) and titanium,14) have been developed and investigated to enhance frequency response performance. Moreover, improvement has been made through studies15) that used finite element methods (Abaqus) to simulate the diaphragm coating with DLC in different areas and to study the frequency response that is influenced by different coating areas on the diaphragm,16)and
through studies that investigated issues related to the sputtering process, such as substrate holder rotation, in order to achieve uniform deposition.
DLC films can be deposited by various physical vapor deposition (PVD) methods in combination with radio frequency (RF) plasma and chemical vapor deposition (CVD) methods. RF magnetron sputtering was used in this study because of its advantages such as deposition of large areas with uniformity and processing at room temperature.17) In this study, we deposited DLC coatings on polyetherimide (PEI) diaphragm substrates with varying parameters for instance deposition area. The corresponding microstructural properties of DLC films were identified by Raman spec-troscopy, atomic force microscopy (AFM), and scanning electron microscopy (SEM).
2. Experimental Methods and Procedures
The aim of this research was to deposit DLC onto PEI diaphragm films to improve the performance of mini loud-speaker frequency response. Because the glass transforma-tion temperature of PEI materials (216C) is relatively lower
than the CVD working temperature (600C–800C), we
could not use the CVD process with such materials. We as an alternative used RF magnetron sputtering to deposit DLC thin films to avoid deformation or deterioration of the diaphragm.
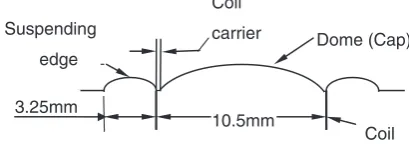
RF magnetron sputtering was employed to deposit a DLC thin film onto a PEI substrate with a diameter of 17.0 mm and a thickness of 25mm. Owing to the use of the vibration technique, the suspending edge (Fig. 2) areas should not be coated. Appropriate flexibility of suspending edge should be maintained. For verification, documentation on this experi-ment is included in following section. With the aim of obtain the relevant coating parameters, data on composition and thickness was acquired using a Si wafer, through Raman spectroscopy, AFM, and SEM. Experimental parameters are listed in Table 2.
[image:2.595.322.527.77.149.2]Next, the PEI substrate was replaced with the Si-wafer, and its surface was cleaned with methanol in ultrasonic equip-ment for 3 min so as to remove contaminants from the surface to guarantee adhesion. The substrates were placed at a distance of about 9 cm to 12 cm from the target. The PEI substrates were rotated at a speed of 15 rpm. And two shields
Table 1 Physical properties of different vibration diaphragm materials.
Material Young’s modulus
E(1011Pa)
Density
(g/cm3)
Sound velocity
C(km/s)
Paper 0.002 0.5 2.0
PEI 0.03 1.27 0.13
Stainless
steel 2.0 7.9 5.1
Al. 0.74 2.7 5.2
Ti. 1.1 4.5 5.2
W.C. 7.2 15.6 6.8
Al2O3 4.3 3.9 10.4
Be. 2.8 1.8 12.3
DLC 3.3 1.8 18.3
Diamond 11.5 3.5 18.5
Suspending edge Dome (Cap) Coil 10.5mm 3.25mm Coil carrier
[image:2.595.47.293.85.240.2]Fig. 2 Sectional view of a loudspeaker.
Table 2 Parameters of R.F. sputter deposition. Coating pattern
(PEI)
RF Power (W)
Ar. flow rate (sccm)
Pressure (Pa)
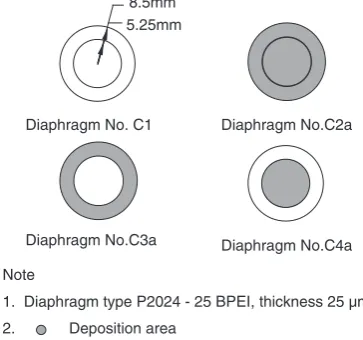
[image:2.595.304.549.203.240.2]model were designed for three different coated areas, as shown in Fig. 3.
After assembly, the mini loudspeakers were tested at a distance of 10 cm from microphone in a semi-anechoic chamber having the SoundCheck and CLIO audio test system, B&K microphone, and other equipment, for sound measurement and validation.
3. Results and Discussion
(1) After several previous failed studies, including tests that used shielded fixtures, readjusted the sputtering param-eters, and fixed the sputtering chamber diaphragm, the present study succeeded in depositing a 120-nm DLC film on PEI diaphragms by sputtering. Some finish diaphragm assemblies are shown in Fig. 4. The color and uniformity of coatings can be observed clearly. (2) The frequency responses before and after sputtering are
shown in Fig. 5. Regardless of whether sputtering was carried out, the frequency bands remained above 75 dB. In particular, at more than 30 kHz, the reduction trend of frequency response of the diaphragms after sputter-ing is lower than that of uncoated one.
(3) Figure 6 shows the cross-sectional SEM images of the amorphous DLC film deposited for 3 h. The film thickness was found to be 120 nm. Further, the detailed bonding structure of the carbon samples was observed
clearly by Raman scattering. Raman spectroscopy is a non-destructive method to characterize the structure of graphite, diamond, and DLCs. The single Raman peak located at 1580 cm1in this study is attributed to highly crystalline graphite in an as-deposited DLC film structure. The peak located at 1350 cm1 is attributed to micro-crystalline graphite with disordered sp3sites. TheID=IGratio of the DLC film was calculated by two Gaussian-fitted peaks in the Raman spectra. AnID=IG ratio of 2.27 was obtained at a deposition time of 3 h, as shown in Fig. 7. For comparison of the surface top-ography under varying parameters of the DLC films, the surface roughness values of DLC films were obtained by AFM analysis. The surface topography was analyzed by AFM in a scanning area of 10mm10mm of the DLC film under an RF power of 150 W and deposition time of 3 h, as shown in Fig. 8. The surface of the DLC film was very flat, with an average roughness (Ra) of 1.21 nm. The Young’s modulus and density of the film were around3:31011Pa and 1.82 g/cm3, which the Young’s modulus of DLC film was obtained by adopting nano indenter, and the density of as-grown DLC thin film was estimated as corresponded to their hardness,18)respectively.
8.5mm 5.25mm
Diaphragm No. C1 Diaphragm No.C2a
Diaphragm No.C3a Diaphragm No.C4a
Note
1. Diaphragm type P2024 - 25 BPEI, thickness 25 µm
2. Deposition area
Fig. 3 4 types DLC coating pattern of diaphragm in this study: (C1) without coating, (C2a) whole area coating, (C3a) suspending edge coating, (C4a) dome coating.
Fig. 4 Photos of coated with DLC thin films show (a) Diaphragm, and (b) Loudspeaker assembly.
Fig. 5 Frequency response before and after DLC coating. (C1, without coating, C2aC4a coated).
[image:3.595.314.542.73.216.2] [image:3.595.75.257.76.246.2] [image:3.595.307.548.272.442.2] [image:3.595.49.291.310.413.2](4) For this study, the loudspeaker resonance frequency fo was 714.4 Hz. The result of measured fowas shown in Fig. 9. Table 3 presents data obtained after the sputter-ing process and testsputter-ing. All of the resonance frequen-cies were found to have increased significantly, which is supported by the principle in eq. (1).
(5) Assume that the mass (mo) of the diaphragm is unchanged; then, according to eq. (2), if the Young’s modulus of the material at the suspending edge is doubled (E2=E1¼2), then the resonance frequency of
the diaphragm increases by 1.4 times (E¼1:4).19) Assumemo ¼const.
E ¼ fo2
fo1
¼
ffiffiffiffiffiffi
C1
C2 s
¼
ffiffiffiffiffiffi
E2
E1 s
ð2Þ
where
mo: Effective mass of vibration system
fo1,fo2: Resonance frequency of raw and coated vibration systems, respectively.
C1,C2: Compliance of raw and coated diaphragm,
respectively.
E1,E2: Young’s modulus of raw and coated
dia-phragms, respectively.
(6) The DLC film thickness of 120 nm, in comparison to the PEI diaphragm thickness of 25mm, is about 1/200 of the thickness of the raw materials, and according to eq. (3), density increments (2.07/1000) of the film are considered to be negligible. However, according to the transformed-section method,20)eq. (4), and eq. (5), the Young’s modulus of the DLC film is evaluated to be 1.496 times that of the raw materials. According to eq. (2), resonance frequency should be 1.223 times the original frequency. Instead, the C2a resonance fre-quency increased only 1.09-fold, C3a increased 1.05-fold, and C4a increased 1.01-fold during experiments. This is because the transformed-section method as-sumes that the diaphragm section is a flat plate, but the section is actually an arc. Moreover, for the compu-tations in this study, we assumed that the whole area was coated, i.e., the C2a coating pattern was followed.
Fig. 7 Raman spectra of the DLC films deposited with deposition time of 3 h. (with Gaussian fitting of D and G peaks).
Fig. 8 AFM surface topography images for the DLC films deposited at RF power of 150 W and with deposition time of 3 h with a scanning area (10mm10mm), and the average roughness (Ra) value is 1.21 nm.
[image:4.595.53.282.71.261.2]Fig. 9 Impedance compares curves.
Table 3 Impedance comparison table.
Coating pattern Impedance ()
Frequency (Hz)
Fre. RatioE
(C a/C1)
C1 13.32 714.4 1
[image:4.595.310.545.74.229.2] [image:4.595.304.550.281.354.2] [image:4.595.76.264.307.662.2]However, C3a and C4a coatings were only partial. The Young’s modulus for a partial coating will be inevitably lower than that for a whole-area coating. Therefore, the change in fo reduced along with the reduction in coating area. It is reasonable that fo will increase with a small increase in the Young’s modulus. Essentially, they are well matched. C4a sputter only a ‘‘dome’’-shaped part. Theoretically, it should not affect the initial fo.
c¼
1t1þ2t2
t1þt2
ð3Þ
n¼E2 E1
ð4Þ
Ec¼
E1I1þE1I2
I0 ð5Þ
Where
c: Compound density
t1,t2: Thickness of raw and coated materials,
respectively
I1,I2: Moment of inertia of raw and coated
materi-als, respectively
E1,E2: Young’s modulus of raw and coated materials,
respectively
Ec: Compound Young’s modulus
I0: Moment of inertia of real shape at its neutral
axis.
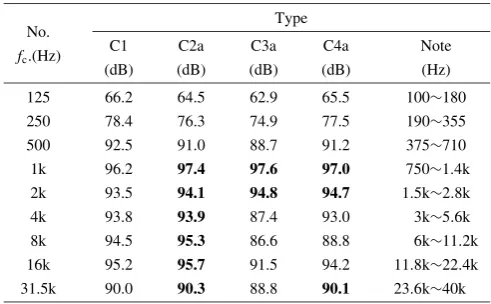
[image:5.595.312.543.73.195.2](7) The purpose of our research was to improve the performance of mini loudspeakers, whose low frequen-cy response is well known to be poor. The lower limit of frequency in the study was 100 Hz. To evaluate performance across every range of frequency, the study divided the frequencies into nine bands, in high frequency, intermediate frequency, and low frequency ranges, as shown in Table 4. The band of the center frequency, fc, was defined the same as the Acoustics. The value of each band frequency response (sound pressure level) adopts its arithmetic mean so as to avoid the interference of noise and ensure objectivity, as in Fig. 10.
A. This type of loudspeaker cannot have acoustic fidelity at a frequency lower than 714.4 Hz
(fo). Below 714.4 Hz, the frequency response decreased by 0:73:8dB on average (indi-cated by the curve shift to the right). This is because fo increases with an increase in the Young’s modulus relative to diaphragm sputtering.
B. Except in the case of the C3a and C4a resonance frequencies at 4 kHz. The effect of sputtering was greater at frequencies between 750 Hz and 5.6 kHz, where the increases were from 0.1 to 1.4 dB.
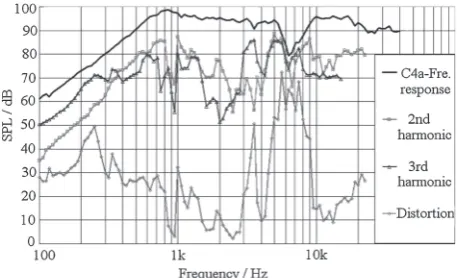
[image:5.595.45.291.93.245.2]C. Except for the increase in frequency response in the case of C2a from 0.3 to 0.8 dB, the high-frequency range was generally ineffective in improving frequency response. First, for C3a, a DLC film with a high Young’s modulus was deposited on the suspending edge, which was likely to increase the stiffness (K) of the vibration system, as shown in Fig. 11. The result was not good as we had expected. Second, for C4a at 3.5 kHz and between 5 kHz and 9 kHz, the 2nd and 3rd harmonics caused a large distortion because of the partition vibration, as shown in Fig. 12. Above 31.5 kHz, the frequency response of uncoated diaphragm was decrease faster than that of coated diaphragms.
Table 4 Frequency response comparison table in individual central frequency of type Ca.
Type No.
C1 C2a C3a C4a Note
fc.(Hz)
(dB) (dB) (dB) (dB) (Hz) 125 66.2 64.5 62.9 65.5 100180
250 78.4 76.3 74.9 77.5 190355
500 92.5 91.0 88.7 91.2 375710
1k 96.2 97.4 97.6 97.0 7501:4k 2k 93.5 94.1 94.8 94.7 1:5k2:8k 4k 93.8 93.9 87.4 93.0 3k5:6k 8k 94.5 95.3 86.6 88.8 6k11:2k 16k 95.2 95.7 91.5 94.2 11:8k22:4k 31.5k 90.0 90.3 88.8 90.1 23:6k40k Note: Bold letters are meaning larger than original.
[image:5.595.314.543.252.414.2]Fig. 10 Frequency response comparison in individual central frequency of type Ca.
4. Conclusions
In this study, DLC films were successfully deposited on polymer substrates at a low temperature (around 100C) by
RF magnetron sputtering. The physical behavior of DLC/PEI structures could be improved to bring their average frequency response values up to 0:21:2dB, their ID=IG ratio up to 2.27, and their roughness to less than 1.21 nm (Ra). At frequencies over and above 20 kHz, which is beyond human hearing, a remarkable improvement is expected, because this frequency is related to auditory compliance of human. Moreover, the C2a coating pattern was found to be optimum for sputtering over the whole area of the substrate, simplify-ing the manufactursimplify-ing process, and improvsimplify-ing yield. On the basis of the results of this study, we validated that it was practicable to sputter DLC thin films onto PEI diaphragms for commercial processing, with the aim of improving high-frequency response. The investigations reported here have highlighted the importance of RF power deposition for tuning
the properties of DLC films. These results also offer useful parameters for devising modern applications of acoustic wave devices.
REFERENCES
1) Y. W. Zhou: China Avphile.07(1998) 37.
2) C. H. Jian and K. L. Lin:Audio Technology, (Chuan Hwa Book Co. Ltd., Taipei, 1976) p. 131.
3) C. M. Harris: Handbook of Noise Control, 2nd ed., (MeGraw-Hill, USA, 1979) pp. 1–6.
4) G. N. Luo, Z. W. Xie, J. H. Zhen, Z. H. Yuan, Q. S. Deng and D. H. Dai: J. Function. Mater.26(1995) 417–420.
5) Z. H. Yuan, S. S. Lin, H. J. Hou, S. C. Li and X. G. Zhu: Audio Eng.4
(2003) 21–23.
6) S. Shikata, S. Fujii and T. Sharda: Diamond Relat. Mater.18(2009) 253–257.
7) J. R. Du: Audio Eng.09(2006) 21–22.
8) T. Yoshioka, O. Imai, H. Ohara, A. Dol and N. Fujimori: Surf. Coat. Technol.36(1988) 311–318.
9) D. W. Galipeau, P. R. Story, K. A. Vetelino and R. D. Mileham: Smart Mater. Struct.6(1997) 658–667.
10) S. S. Lee, R. P. Ried and R. M. White: J. Microelectromechan. Systems
5(1996) 238–242.
11) S. H. Yi and E. S. Kim: Jpn. J. Appl. Phys.44(2005) 3836–3841. 12) I.-T. Tang, H.-J. Chen, W. C. Hwang, Y. C. Wang, M.-P. Houng and
Y.-H. Wang: J. Crystal Growth262(2004) 461–466. 13) B. J. Zhang and B. R. Sun: Audio Eng.02(1997) 23–25.
14) Z. W. Zhang, R. Z. Li and H. S. Zhu: Chin. J. Mater. Res.8(1994) 330–336.
15) K. C. Chang: Master Thesis, (National Taiwan University, Taipei, 2007).
16) Z. W. Xie, J. H. Zheng, Z. H. Yuan, Q. S. Deng, G. N. Luo, D. H. Dai and Z. Q. Fu: Mater. Res. Appl.8(1998) 52–56.
17) B. R. Pujada, F. D. Tichelaar and G. C. A. M. Janssen: Surf. Coat. Technol.203(2008) 562–565.
18) Y. Okaet al.: Nuclear Instruments and Methods in Physics Research Section B.242(2006) 335–337.
19) X. J. Que and H. Z. Fu: Technical Acoustics8(1989) 25–28. 20) J. M. Gere and S. P. Timoshenko: Mechanics of Materials,
[image:6.595.54.283.72.211.2]