of Polyurethane Foam by X-ray Computed Tomography Observations
Tsuyoshi Yamashita
*, Kazuhiro Suzuki
*, Hideki Adachi
*, Souichiro Nishino and Yo Tomota
Institute of Applied Beam Science, Graduate School of Science and Engineering, Ibaraki University, Hitachi 316-8511, Japan
We investigated several conditions for manufacturing polyurethane foam for motor vehicle application to clarify the effect of the material structure on sound absorption performance in the low-frequency region. The objective is to reduce material weight without reducing noise absorption performance. We investigated the relationship between the internal microscopic structure and absorption performance by 3D analysis of X-ray computed tomography scanning observations. We found that the microscopic structural parameters of the material cells affect the sound absorption frequency and that they have a strong relationship with tortuosity, which is an acoustic parameter of porous materials. We also found that reducing cell size and making the cell frames thicker shifts the peak frequency of the sound absorption coefficient downward.
[doi:10.2320/matertrans.MRA2008207]
(Received July 8, 2008; Accepted November 13, 2008; Published January 25, 2009)
Keywords: sound absorption, X-ray computed tomography, polyurethane foam, tortuosity, sound proof material
1. Introduction
Improving the fuel consumption efficiency of motor vehicles by reducing their weight also reduces their CO2
emissions, which is important from the viewpoint of environmental protection. One way to reduce weight is to use sound absorbing materials rather than insulation als for soundproofing. Conventional sound absorbing materi-als, however, are more effective for reducing noise in the high frequency region. For application to motor vehicle noise reduction, thin absorption materials are needed that fit the limited cabin space and that exhibit good performance over a wide frequency range.
The macroscopic acoustic parameters of porous material characteristics, such as flow resistivity and porosity, have been shown to be related to absorption performance.1–4) However, they were determined by measurement of the change in the pressure in front and in back of the material; the microscopic internal structure of the material was apparently not investigated. The sound performance of porous materials has been predicted using the Biot model,5)which uses these characteristic parameters, and the equivalent fluid model.6) There have been few reports that have clarified the relation-ship between the internal microscopic structure of porous materials and their sound absorption.7)
We previously demonstrated that X-ray computed tomog-raphy (CT) scanning is an effective non-destructive tech-nique for observing the microscopic structure of soft poly-urethane foam used as a sound absorbing material.8)And we identified a strong relationship between the cell diameter and sound absorption performance of polyurethane foam.
We have now carried out 3D analysis of X-ray CT scanning observations and propose using ‘‘cell frame thick-ness’’ as a parameter of the microscopic internal structure of the foam in addition to the ‘‘cell diameter’’, which we used in the previous study. We clarified the manufacturing condi-tions needed to obtain the target microscopic internal structure. We focused on the effects of the material filling
ratio in the molding dies and the composition ratio of the ‘‘bubble agent’’, which is a reactant used to make finer cells. We determined the relationship between the microscopic structure and sound absorption performance and the corre-lation between the conventional macroscopic acoustic mate-rial-characteristic parameters and the ones we propose using.
2. Experimental Method
2.1 Materials
We used soft ether polyurethane foam, which is commonly used for acoustic insulation in motor vehicles. We focused on two parameters related to its manufacture to investigate the effect of the microscopic structure on the sound absorbing performance. One was the filling ratio of the material into molding dies, i.e., material density. The other was the content of the bubble agent additives used to control the cell structure. We tested six kinds of materials that had different microscopic cell structures, which were obtained by adjust-ing the density and quantity of the additives.
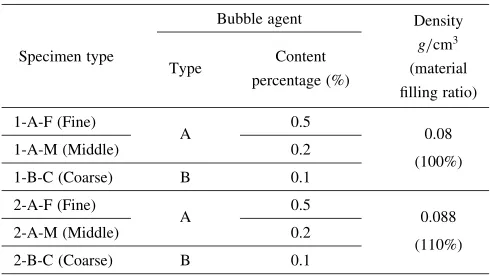
[image:1.595.304.549.648.786.2]We fabricated six types of test specimens with three different content ratios of two additives and two material densities, as listed in Table 1. The two additives were bubble agent A, which made the micro cells finer, and bubble agent B, which made them coarser. The material densities were
Table 1 Specifications of specimen types.
Bubble agent Density
Specimen type Content g/cm
3
Type
percentage (%) (material filling ratio)
1-A-F (Fine)
A 0.5 0.08
1-A-M (Middle) 0.2
(100%)
1-B-C (Coarse) B 0.1
2-A-F (Fine)
A 0.5 0.088
2-A-M (Middle) 0.2
(110%)
2-B-C (Coarse) B 0.1
0.08 and 0.088 g/cm3. The former (called ‘‘filling ratio
100%’’ here) is normally used for absorption materials, and the latter (called ‘‘filling ratio 110%’’ here) is 10% more dense.
The upper and lower injection molding dies were kept at 55C, and undiluted polyurethane solution was injected into
them. They formed polyurethane foam blocks 1 m long, 25 mm thick, and 1 m wide. The test specimens obtained from these blocks were 29 mm in diameter and 25 mm thick.
2.2 Apparatus
The normal incidence acoustic absorption coefficient was measured using a sound impedance tube (Bru¨el & Kjær, Type 4206, made in accordance with ISO 10534-2). To determine the characteristics of the material itself, we measured the absorption coefficient with the specimen close to a rigid wall so that there was no back air cavity. The absorption coefficient of the specimens was measured in the high-frequency region.
X-ray CT was used to investigate the microscopic organization of the material, as was used in the previous study.8) Observing a material’s internal structure using X-rays requires the use of X-X-rays with a wavelength suitable for the density and specific gravity of the material. Likewise, equipment must be used that can supply the proper voltage for generating the X-rays because their penetration capability depends on their wavelength and the density of the material. For our microscopic structural observations of the low-density soft polyurethane foam, we used equipment with a low-voltage X-ray tube (Shimadzu, SMX-100CT-SV). It is well suited for low-density materials for which a low voltage and current can be used for high-resolution observa-tions.8)The tube voltage was set to 40 kV, the tube current was set 80mA, and the observation scan distance was set to 0.01 mm.
3. Experimental Results
3.1 Visualization of internal microstructure by X-Ray CT scanning
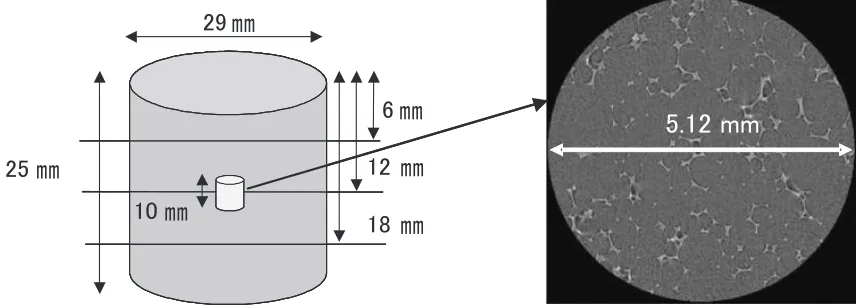
The observation of the micro-structural cells was carried out using cross-sectional images obtained by X-ray CT scanning of the specimens. To improve the reliability of the
observations, images of three cross-sections, each with a diameter of 5.12 mm and centered on the specimen diameter, were captured at 6, 12, and 18 mm below the upper surface of the specimen, as shown in Fig. 1. These areas were the most stable ones inside the material because they were where homogeneous and fine micro-structural cells were concen-trated.
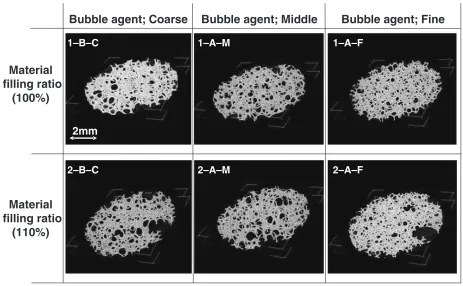
Images taken at a depth of 12 mm for representative specimens are shown in Fig. 2. X-ray CT scanning creates a section image by calculating the quantity of X-ray absorption in the cross-section. Since calculating the amount of X-ray absorption along the circumference of the cross-section improves the resolution of the analysis, we used images taken around the objective area. 3D image modeling of the internal structure was also performed by applying 3D volume-rendering software (VG Studio) to the images.
The 3D modeling images taken at 12 mm below the surface are shown in Fig. 3. A 3D modeling image of the upper and lower sides for each cross-section was generated from 108 sheets of X-ray CT cross-section data extracted at an interval of 0.01 mm within a range of 0.5 mm from the upper and lower sides.
The CT cross-section images and 3D modeling images in Figs. 2 and 3, respectively, clearly show that the internal microscopic structure of the polyurethane foam specimens consisted of countless cell frames joined together like a network of meshes. Therefore, we examined the thickness of the cell frames in addition to the diameter of the cells as microscopic structure factors.
The cell size depended on the composition ratio of the bubble agents. The fine specimens had smaller cells, and their internal structure was more complex. Furthermore, the cell frames of the specimens with a higher material density were thicker than those with a lower material density.
3.2 Correlation between internal microscopic structure and manufacturing conditions
[image:2.595.82.515.76.230.2]cell frames and the thickness of frame walls on a line were measured for each cell, except for those located at the cross-sectional perimeter. The measurements for all nine lines were averaged, and the average was defined as the mean diameter of the micro cells and the mean thickness of the cell frames
for the cross-section. This measurement for each specimen was performed for three cross-sections 6, 12, and 18 mm below the surface. The average values of the data for the cross-sections were used as the mean cell diameter and the mean cell frame thickness.
Material
filling ratio
(100%)
Material
filling ratio
(110%)
1mm
2–A–F 2–A–M
2–B–C
Fig. 2 Cross-section images by X-ray CT scan for microscopic observation (observation depth: 12 mm).
2mm
Bubble agent; Coarse
Material
filling ratio
(100%)
Material
filling ratio
(110%)
1–A–F 1–A–M
1–B–C
2–A–F 2–A–M
2–B–C
Bubble agent; Fine
Bubble agent; Middle
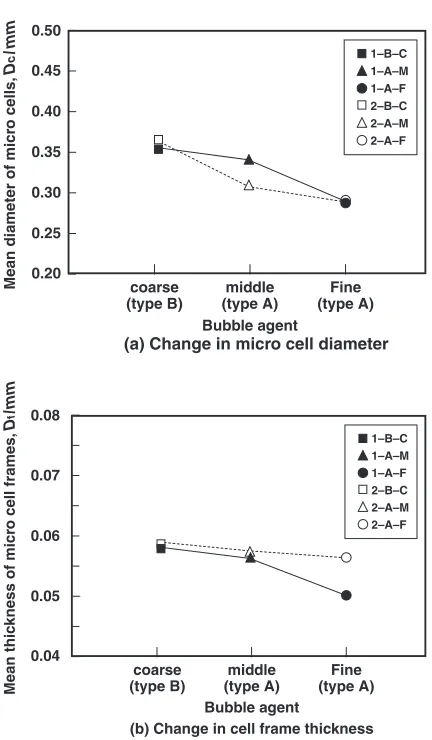
[image:3.595.68.526.73.349.2] [image:3.595.65.528.396.682.2]The effects of the different bubble agent compositions are shown in Fig. 5. As shown in Fig. 5(a), the mean cell diameter in the fine specimens was smaller for both material densities (100% and 110%). As shown in Fig. 5(b), the fine specimens with the higher density (110%) had a thicker mean cell frame.
The relationship between the mean cell frame thickness and mean cell diameter is shown in Fig. 6. Regardless of density, the specimens with the smallest cell diameter had the thinnest cell frame. However, this relationship was much weaker for the specimens with the higher density.
3.3 Micro-structure control and sound absorption per-formance
To determine the relationship between the sound absorp-tion characteristics and the internal material structure, we measured the normal incidence absorption coefficient of the specimens. As shown in Fig. 7, the sound absorption of the specimens had a frequency range in which the acoustic absorption coefficient initially reached a maximum value (the ‘‘peak absorption coefficient’’), and the peak frequency was between about 1500 and 2300 Hz. The acoustic absorption coefficient reached a minimum value (the ‘‘bottom absorption coefficient’’) due to interference between the waves incident to the material and the waves reflected from the rigid back wall. The first bottom frequency was between about 3300 and 4300 Hz.
The relationship between the peak frequency and peak absorption coefficient and that between the bottom frequency and the bottom absorption coefficient are shown in Fig. 8. The absorption coefficient at the peak frequency was between 0.94 and 0.99, and that at the bottom frequency was from
Out of measurement
[1mm]
Cell diameter Frame thickness
Fig. 4 Configuration of measurement for micro cell diameter and cell frame thickness.
(a) Change in micro cell diameter
0.20 0.25 0.35 0.45
0.30 0.40 0.50
coarse (type B)
middle (type A)
Fine (type A) Bubble agent
Mean diameter of micr
o cells,
D
c
/
mm
1–A–F 1–A–M 1–B–C
2–A–F 2–A–M 2–B–C
(b) Change in cell frame thickness coarse
(type B)
middle (type A)
Fine (type A) Bubble agent
0.04 0.06
0.05 0.07 0.08
Mean thic
kness of micr
o
cell frames,
D
f
/mm
1–A–F 1–A–M 1–B–C
2–A–F 2–A–M 2–B–C
Fig. 5 Results of observations by X-ray CT (effect of bubble agent composition).
0.040 0.060
0.050 0.070
0.065
0.20 0.35
0.055
0.045
Mean thic
kness of micr
o
cell frames,
T
f
/mm
Mean diameter of micro cells, Dc/mm
1–A–F 1–A–M 1–B–C
2–A–F 2–A–M 2–B–C
0.50 0.45 0.40 0.30
0.25
[image:4.595.72.524.74.245.2] [image:4.595.62.278.287.657.2] [image:4.595.316.535.287.442.2]0.71 to 0.75. This indicates that only the frequency changed, not the absorption coefficient.
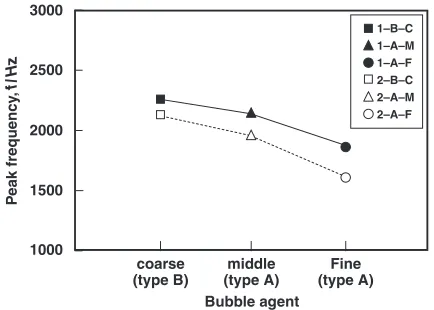
The relationship between the bubble agent composition and peak frequency, and the relationship between the material density and peak frequency are shown in Fig. 9. The peak frequency decreased as the content ratio was adjusted to make the cell structure finer. This indicates that increasing the material-filling ratio (material density) by 10% shifts the peak frequency to a lower frequency region.
These results demonstrate that the peak frequency can be shifted downward without decreasing the absorption coef-ficient by adjusting the bubble agent composition ratio and material density of the polyurethane foam when the temper-ature of the molding dies is kept at 55C.
The changes in the peak and bottom frequencies are related to the velocity of sound traveling through the porous material. To clarify the effect of the internal microscopic structure on the sound velocity, we investigated the relation-ship between the change in frequency and the internal microscopic structure of the porous material.
The relationship between the peak frequency and mean cell diameter is shown in Fig. 10, along with the results of regression analysis for both material densities. There was a strong correlation between the mean cell diameter and peak frequency. The peak frequency shifted downward as cell size was reduced. This is consistent with the results of our previous study.8)
The relationship between the peak frequency and the mean cell frame thickness is shown in Fig. 11. The specimens with the higher filling ratio had thicker cell frame walls, and their peak frequency was lower.
In short, adjusting the bubble agent composition leads to smaller micro cells, which changes the microscopic structure, so the peak frequency of the sound absorption coefficient can be shifted downward. Furthermore, even if there was no significant difference in the mean cell diameter, the peak frequency could still be shifted down by increasing the
Peak
1000 2000 3000 4000 5000
0.4 0.6 0.8 1.0 1.2
Bottom
Frequency, f/Hz
Absorption coefficient
Fig. 8 Relationship between normal incident acoustic absorption coef-ficient and peak and bottom minimum frequencies.
coarse (type B)
middle (type A)
Fine (type A) Bubble agent
3000
2500
2000
1500
1000
P
eak frequenc
y
,
f
/
Hz 1–A–F
1–A–M 1–B–C
2–A–F 2–A–M 2–B–C
Fig. 9 Frequency of peak normal absorption coefficient (for different bubble agent compositions).
2000
1500
1000
P
eak frequenc
y
0.20 0.35
Mean diameter of micro cells, Dc/mm
2–A–F
0.30
[image:5.595.56.284.74.224.2]0.25 0.40 0.45 0.50
Fig. 10 Relationship between peak frequency and micro cell diameter.
3000
2500
2000
1500
1000
P
e
ak frequenc
y
,
f
/
Hz
0.040
Mean thickness of micro cell frames, Tf/mm
1–A–F 1–A–M 1–B–C
2–A–F 2–A–M 2–B–C
0.070 0.065 0.060 0.055 0.050 0.045
Fig. 11 Relationship between peak frequency and micro cell frame thickness.
1–B–C 2–B–C
500 6500
Frequency, f/Hz
Normal incident absorption coefficient 0 0.2 0.4 0.6
5500 4500 3500 2500 1500
[image:5.595.320.534.75.216.2] [image:5.595.321.534.261.402.2] [image:5.595.62.279.267.419.2] [image:5.595.61.278.474.629.2]material density, which increases the thickness of the cell frame walls.
4. Discussion
Our results demonstrate that the microscopic cell size and thickness of the cell frame walls affect the peak frequency of the sound absorption coefficient. Here we discuss the relationship between the mean cell diameter and the tortuosity, an acoustic parameter of porous material. We define tortuosity as a parameter of the internal structure of porous material and use it to represent the quantity of sound waves entering the air spaces in the material. The larger its value, the longer the distance over which sound waves entering the material are transmitted inside the material and the larger the attenuation of the sound wave intensity inside the material. We also discuss the relationship between tortuosity and the thickness of the cell frame walls.
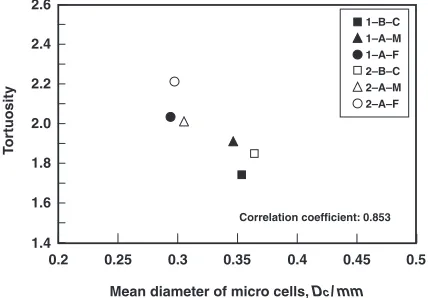
The tortuosity was calculated using Foam-X software (Acoustic Property Identification for Foam and Fiber Mate-rial; MECANUM) using the acoustic impedance obtained from the measured absorption coefficient. The relationship between the peak frequency and tortuosity is shown in Fig. 12. The correlation between them was strong—the peak frequency decreased as the tortuosity increased. Tortuosity and the mean cell diameter also had a negative correlation— the tortuosity increased as the cell diameter decreased, as shown in Fig. 13. This supports the findings of our previous study.8)
We performed multiple regression analysis among the mean cell diameter, mean thickness of the cell frame walls, and tortuosity. The equation we obtained for tortuosity takes into account both the cell diameter and the thickness of the walls.
y¼ 5:187X1þ12:13X2þ2:957 ð1Þ
y: tortuosity X1: cell diameter
X2: wall thickness
The relationship between the tortuosity and the calculated structure factor obtained using eq. (1) is shown in Fig. 14. The correlation was stronger when it was calculated using both the mean cell diameter and mean thickness of the
cell frame walls (multiple regression correlation coefficient, r, of 0.986) than when it was calculated using only the mean cell diameter (r¼0:853), as shown in Fig. 13. This demonstrates that the tortuosity relating to the peak frequency changes with the micro cell structure when both cell size and cell frame thickness are taken into account. The values of the coefficients in eq. (1) indicate that materials with smaller cells and thicker cell frame walls have larger tortuosity.
The reason the peak frequency of the absorption coefficient shifts downward when the cell diameter is reduced can be explained as follows. The normal acoustic impedance for porous materials, Zn, is related to the normal incidence absorption.
Zn¼ jZccotðk0dÞ ð2Þ
Zc: characteristic impedance
d: material thickness
k0: complex transmission constant (¼j)
: phase constant (¼!=CM)
: attenuation coefficient. !: circular frequency
CM: sound velocity in material (¼ ðK=Þ1=2)
: density of air inside material K: bulk modulus
1.4 2.2 3000 2500 2000 1500 1000 P e ak frequenc y , f / Hz
Tortuosity (structure form factor)
[image:6.595.64.277.73.223.2]1–A–F 1–A–M 1–B–C 2–A–F 2–A–M 2–B–C 2.6 2.4 2.0 1.8 1.6
Fig. 12 Relationship between peak frequency and tortuosity.
Correlation coefficient: 0.853
2.4 2.0 1.8 1.6 1.4 0.2
Mean diameter of micro cells, Dc/mm
[image:6.595.320.534.76.225.2]2.6 2.2 1–A–F 1–A–M 1–B–C 2–A–F 2–A–M 2–B–C T o rtuosity 0.5 0.45 0.4 0.35 0.3 0.25
Fig. 13 Relationship between tortuosity and micro cell diameter.
Multiple regression correlation coefficient: 0.986
T
o
rtuosity fr
om normal acoustic impedance
1.4 1.6 1.8 2.0 2.2 2.4 2.6
2.4 2.0 1.8 1.6 1.4 2.6 2.2
Tortuosity calculated by multiple regression analysis
1–A–F 1–A–M 1–B–C 2–A–F 2–A–M 2–B–C
[image:6.595.321.533.276.435.2]absorption’’) appears when d is an odd number multiple of=2.10)Since we used a constant thickness of 25 mm, the change in the periodic properties of the frequency was related
to, that is, sound velocityCMin the material. When the cell
diameter is reduced, sound velocityCMdecreases. From the relationship CM¼ ðK=Þ1=2, the decrease in the sound velocity is due to the increased effective density of the air in the material or the material’s bulk modulus K. This means that the cell diameter is related to the effective density.
We discuss the sound velocityCM from the viewpoint of the relationship between the effective densityand tortuos-ity, as shown equation by3)
¼0ks½1þ’=j!0ksGcðsÞ
¼0ksþ’=j!GcðsÞ; ð3Þ
where GcðsÞ ¼ s=4pffiffiffiffiffiffij ½J1ðs ffiffiffiffiffiffij
p
Þ=J0ðs ffiffiffiffiffiffij
p
Þ=½1
2=ðspffiffiffiffiffiffijÞ J1ðs ffiffiffiffiffiffij
p
Þ=J0ðs ffiffiffiffiffiffij
p
Þ, 0 is air density, ks is tortuosity (structure form factor), ’ is porosity (ratio of air volume to total material volume), is flow resistivity (resistance of air flow when transmitted inside material), s = c ð8!0ks=’Þ1=2, c is a parameter that depends on the
shape of the cross-section, andJis a Bessel function. The results of plotted in Fig. 13 indicate that, when the diameter of cells in polyurethane foam becomes smaller, structure factor ks defined by the cell structure inside the material increases. Therefore, increasing structure factor ks increases the effective density, as shown by eq. (3). As a result, the sound velocity inside the material decreases, and the peak frequency of the absorption coefficient decreases, as discussed in the previous report.8)
Furthermore, as shown Figs. 10 and 11, for instance, even when the micro cell diameter remained almost the same (0.3 mm), the frequency of the specimens with 10% thicker cell frame walls shifted downward. This shows that the mass of the cell frame walls, through which the sound flows, increases equivalently when the thickness of the cell frame wall increases.
This phenomenon is described by the following motion equation for the medium inside porous material3,10) (the substance through which wave motion propagates).
@p=@x¼ ðj!ks0þÞvi ð4Þ
p: sound pressure : flow resistivity vi: particle velocity of air 0: density of air
ks: tortuosity
!: circular frequency
Density of this medium is related to (!ks0!vi), an
inertia term that is the first term of the equation. That is, this phenomenon demonstrates that vibration of the fluid (air) inside the material becomes vibration of the particles of air density ks0 including tortuosity ks, which means that
the energy of the sound inside the material is spent on vibration that moves the mass of air close to the cell frames.
of air inside the material, which is related toks0, is affected
by the mass of the cell frames, and the dynamic mass increases accordingly.
Sound is transmitted through the micro cells in poly-urethane foam, while the air inside the material vibrates. However, the sound energy makes the cell frame walls vibrate. Therefore, since the mass of the cell frames increases with the frame thickness, the dynamic mass of the air inside the material increases. This means that the effective density of air (ks0) in the inertia term of the motion equation
increases. This contributes to a decrease in the natural frequency of medium vibration inside the material.
5. Conclusion
To clarify the effect of the manufacturing conditions of polyurethane foam used as an absorption material for motor vehicles on sound absorption performance in the lower frequency region, we investigated the effect of the micro-scopic structure inside the material. The material density (the material filling ratio in the molding dies) and the content percentage of the bubble agents used to make the micro cells fine were used as parameters of the manufacturing condition.
X-ray CT scanning was used to measure the micro cell diameter and thickness of the cell frame walls. The correlation between the results and the macroscopic acous-tical parameter was investigated.
(1) The internal structure of low-density polyurethane foam was visualized in three dimensions by 3D modeling based on X-ray CT scanning data, and the X-ray CT method was found to be an effective tool for observation inside materials manufactured under different conditions.
(2) The internal microscopic structure (the mean micro cell diameter and the mean thickness of the cell frames) could be controlled by adjusting the content percentage of two bubble agents and adjusting the material density. The peak frequen-cy of the absorption coefficient was shifted down without decreasing the absorption coefficient.
(3) The diameter of the micro cells and the thickness of the cell frame walls had a strong correlation with the tortuosity, which is a structural form factor, and a macroscopic acoustic parameter of porous material.
(4) Decreasing the cell diameter and increasing the thickness of the cell frame walls increased the tortuosity. This increased the effective density of the air inside the material, which reduced the sound velocity inside the material and shifted the peak frequency of the absorption coefficient downward.
Acknowledgements
REFERENCES
1) L. L. Beranek: Sound and Vibration Control, Revised Ed., (Institute of Noise Control Engineering, McGraw-Hill, New York, 1971) pp. 245– 269.
2) Y. Champoux: JASA89(1991) 910–916.
3) J. F. Allard: Propagation of Sound in Porous Media, Modelling Sound Absorbing Materials (Chapters 4 and 5), (Elsevier Applied Science, London and New York, 1993).
4) D. A. Bies and C. H. Hansen: Appl. Acoustics13(1980) 357–391. 5) M. A. Biot: J. Acoust. Soc. Am.28(March, 1956) 179–191.
6) T. Komatsu: Acoust. Sci. Tech.29(2008) 121–129.
7) Y. Attala, N. Attala, J. Fu and H. E. Naguib: The Effect of Processing Parameters on the Acoustical Efficiency of Open Cell PMMA, (2006 SAE World Congress, 2006-01-0711, Detroit).
8) T. Yamashita, K. Suzuki, S. Nishino and Y. Tomota: Mater. Trans.49 (2008) 345–351.
9) R. T. DeHoff and F. N. Rhines: Quantitative Microscopy (Japanese ed.) (original ed., McGraw-Hill, New York, 1968).