1
A Study on the Evolution of the Contact Angle of Small Punch Creep Test
of Ductile Materials
B. Cacciapuoti*, W. Sun, D. G. McCartney
Department of Mechanical, Materials and Manufacturing Engineering University of Nottingham, Nottingham NG7 2RD UK
ABSTRACT
The work discussed in the present paper reports a novel investigation of the applicability of
Chakrabarty’s theory, for membrane stretching of a circular blank over a rigid punch, to small
punch creep test (SPCT). The Chakrabarty solution was compared with corresponding results
obtained by numerical finite element (FE) analyses and experimental tests. The Liu and
Murakami creep damage model was used in the FE analyses. The aim of the work is also to
improve the understanding of the mechanism governing the deformation and the failure of the
specimen and to verify the range of applicability of the CEN Code of Practice CWA 15627,
which is based on Chakrabarty’s theory. The effects of various parameters, such as the initial
thickness of the specimen, the radius of the punch, the load magnitude, the friction coefficient
and different plasticity constitutive models, on the variation of the contact angle, θ0, and the
central displacement of the punch, Δ, were identified and correlated by fitting equations. The
variation of θ0 with Δ, obtained from Chakrabarty’s solution was compared with that
obtained by FE analyses of the SPCT. When the initial thickness of the specimen increased
and the radius of the punch decreased, the FE results, in terms of the variation of θ0 versus Δ,
showed to differ from Chakrabarty’s solution, therefore new ranges of applicability of the
CEN Code of Practice CWA 15627 were determined.
2
*Corresponding Author: [email protected]
NOMENCLATURE
ap Receiving hole radius
A Material constant in Liu and Murakami’s model A’, A0 Undamaged and the initial area of the specimen
B Material constant in Liu and Murakami’s model E Young’s Modulus of the damaged material E’ Tangential modulus
E0 Young’s Modulus of the undamaged material
f(y) Depth of 2D profiles of the deformed specimen n Material constant in Liu and Murakami’s model p Punch pressure
P Punch load Magnitude
q2 Material constant in Liu and Murakami’s model
rcontact Contact radius
Rs Punch radius
Sij Deviatoric stress tensor
t, tf Time and time to rupture
tc, t0 Current and initial thicknesses
t* Thickness at the contact boundary T Temperature
w Angular frequency
3 Δ, Δf Punch displacement and punch displacement at failure
ε, 𝜀̇ Strain and strain rate
𝜀̇𝑖𝑗𝑐 Creep strain rate components
θ0, θ0f Contact angle and contact angle at failure
μ Friction coefficient ν Poisson’s ratio
ρc, ρr Circumferential and meridian radii of curvature
σ1 Maximum principal stress
σc, σm Circumferential and meridian components of stress
σEQ von Mises equivalent stress
σRUP Rupture stress
σy Yielding stress
σ* Meridian stress at the contact boundary
χ Material constant in Liu and Murakami’s model ω, 𝜔̇ Damage variable and damage rate
ωMAX Upper bound of damage variable
1
INTRODUCTION
It is increasingly needed to evaluate creep properties for materials which components
operating at high temperature in various industrial fields are made of, e.g. in power
generation, aero-engines and petro-chemical plants, in order to estimate their remaining life
and avoid premature failures [1, 2]. For these applications, established and well-standardised
mechanical test techniques, such as the standard size uniaxial creep test, cannot always be
used as they require a large volume of material to be sampled from the component. A way
4
material to be tested, or sampling of large specimens would however be too expensive,
consists of developing miniature specimen testing methods. Several innovative testing
techniques, requiring a small amount of material to be sampled, have been developed in the
last two decades in the USA, the UK, Europe and Japan [3] and, among these one of the
non-traditional test techniques, the Small Punch Creep Test (SPCT) [1, 4] has been extensively
investigated by many authors. Unlike other miniaturised specimen techniques, such as the
impression creep test [5] and the small ring creep test [6], the SPCT potentially allows to
entirely characterise the behaviour of materials up to failure, because the specimen is taken to
rupture [7, 8]. The SPCT can also be used to perform focused analyses on critical locations of
operating components, e.g. the heat-affected zone of welds, pipe bends or joint sections of
steam headers [8]. Despite of these advantages, some concerns about the applicability of
SPCT are still open [2, 4]. Indeed, the interaction of several non-linearities, such as large
deformations, large strains, non-linear material behaviour and non-linear contact interactions
between the specimen and the punch, induces a very complex multi-axial stress field in the
specimen which also evolves in time. This affects the SPCT fracture mechanism [2, 7] and
introduces several challenges into the identification of a robust correlation to convert SPCT
data into respective standard uniaxial creep test data [7, 9-11]. Another major concern is the
non-repeatability of the testing method, since the experimental results depend on the set up
geometry [1, 4, 12, 13]. One of the major developments in this matter has been achieved by
the Code of Practice proposed in 2006 by the European Committee for Standardisation
(CEN), where an experimental procedure and a range for the specimen and the test ring
components geometry was recommended [1, 11]. Another achievement of the CEN Code of
Practice consists of a correlation proposed between the load level to be applied to the small
disc specimen and the stress induced in a conventional uniaxial creep test which exhibits the
5
the quantities involved in the SPCT, i.e. the load-stress ratio [1, 14-16], but a common
problem is faced in determining the angle between the axis of symmetry and the normal to
the specimen’s surface at the contact edge, θ0 [1], as it is an implicit variable in the
mentioned relationships.
In order to develop a robust procedure to interpret the experimental output of SPCTs and a
reliable correlation technique with conventional uniaxial creep test data, the understanding of
the complex behaviour of the specimen during testing is still to be improved.
The research presented in this paper is aimed to investigate the applicability of the
Chakrabarty solution, which forms the basis for small punch creep data interpretation in the
CEN code of practice [1], to the SPCT behaviour, by use of numerical finite elements (FE)
calculations and by comparing experimental, numerical and analytical solutions. An
improved understanding of the SPCT specimen deformation and failure behaviour is
necessary, in order to carry out a step forward for the realization of the improved code of
practice based on the existing CWA 15627 [1].
2
CHAKRABARTY’S MEMBRANE STRETCHING THEORY
Chakrabarty’s membrane stretching theory [15] is used by the CEN Code of Practice as it
provides a complete set of relations for establishing the correlation between the load level to
be applied to the SPCT specimen and the stress induced in a conventional uniaxial creep test
which exhibits the same time to rupture [1]. As well as the other equations suggested by the
Code of Practice and reported by Liu and Šturm [17] in 2005, and others [14, 16, 18],
Chakrabarty’s relation between load and stress is derived from equilibrium between load and
membrane stresses with bending stresses neglected [15]. As a matter of fact, large
6
engineering judgment) are involved in the SPCT, allowing the bending stresses to be
neglected [15].
2.1 Problem description
A representative analytical model of SPCT would be significantly complicated, as it should
account for the effects of moving contact edges, nonlinear friction conditions between the test
rig components and the tested specimen, and highly localised initial plastic deformation [7,
10, 15, 19]. However, Chakrabarty’s theory of membrane stretch forming over a rigid
hemispherical punch head, reported in ref. [15], is able to provide an analytical tool for the
interpretation of small punch creep test data [10, 11, 15]. In Chakrabarty’s study large plastic
deformations are taken into account and the geometry and the loading conditions partly
reflect those encountered in the SPCT [20]. Furthermore, the model hypotheses can be very
restrictive in comparison with the true material behaviour: an isotropic material is adopted;
the punch head is taken to be covered by a film of lubricant, therefore friction between the
blank and the punch can be neglected; since large strains are considered, the material is
assumed to be rigid-plastic; the thickness of the blank is at least one order of magnitude
smaller than the radius of the punch, therefore, the bending rigidity of the blank can be
neglected, and, as a consequence, the deformation mode can be assumed to be governed by
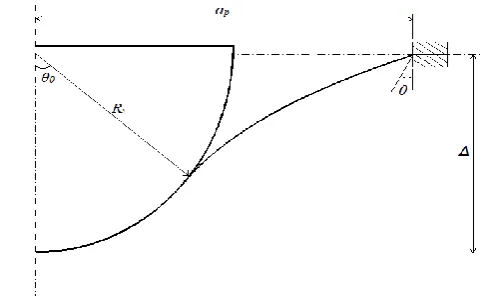
membrane stretching [15]. Figure 1 is a schematic diagram showing the components
Chakrabarty’s model comprises of.
2.2 Membrane Stress Solutions
Chakrabarty’s model consists of a thin membrane of isotropic material stretched over a static
7
Figure 1. Schematic diagram of the Chakrabarty model of membrane stretching of a circular blank over a rigid punch, adapted from ref. [15].
If p and tcdenote the punch pressure and the current thickness of the specimen, respectively, the normal equilibrium in the contact region is expressed by equation (1)
𝑡𝑐( 𝜎𝑐 + 𝜎𝑚) = 𝑝𝑅𝑠 (1)
where 𝜎𝑐 and 𝜎𝑚 are the circumferential and meridian stresses, respectively, and Rs is the punch radius [15]. In the unsupported region the corresponding relationship is given by equation (2)
𝜎𝑐 𝜌𝑐 +
𝜎𝑚 𝜌𝑟 = 0
(2)
where 𝜌𝑐 and 𝜌𝑟 are the circumferential and meridian radii of curvature, respectively, which have opposite signs in the unsupported region, while they are both positive and equal to Rs in the contact region [15]. The central displacement of the punch, Δ, is related to the angle between the surface normal and the axis of rotation, θ, and the normal angle at the contact boundary, θ0, by equation (3), which can be solved through equation (4), where ap is the receiving hole radius, by setting θ0 to vary in the range from 0 to 90o degrees [1, 15]
Δ
𝑅𝑠 = (1 − 𝑐𝑜𝑠𝜃0) + 𝑠𝑖𝑛2𝜃0𝑙𝑛
tan (𝜃0/2)
tan (𝜃/2)
(3)
𝑠𝑖𝑛𝜃 = 𝑅𝑠
𝑎𝑝𝑠𝑖𝑛2𝜃0
8
By assuming an empirical strain-hardening law, as in equation (5), where C and m are material constants, Chakrabarty also found a correlation between the punch load at any given stage and the stress at the contact boundary, which is expressed by equation (6)
𝜎 = 𝐶𝜀𝑚 (5)
𝑃 = 2𝜋𝑅𝑠𝜎∗𝑡∗𝑠𝑖𝑛2𝜃0 (6)
where 𝜎∗ and 𝑡∗ are the membrane stress and the thickness, respectively, at the contact boundary and are given by equations (7) and (8), where t0 is the initial thickness of the specimen [15].
𝜎∗= 𝐶 [2𝑙𝑛 (1 + 𝑐𝑜𝑠𝜃
1 + 𝑐𝑜𝑠𝜃0)]
𝑚
(7)
𝑡∗ = 𝑡 0(
1 + 𝑐𝑜𝑠𝜃0 1 + 𝑐𝑜𝑠𝜃)
2
(8)
2.3 Strain Solution and Correlation of the Contact Boundary Angle
A relationship between the central deflection of the punch, Δ, and the central equivalent
strain, ε, was proposed by Yang and Wang by using Chakrabarty’s membrane stress solutions
combined with a FE investigation [18]. Li and Šturm identified a correlation between the
strain at the contact boundary and the central displacement [11, 17, 21, 22]. Li and Šturm’s
third order polynomial relation, equation (9), is based on a fitting to Chakrabarty’s membrane
stretching solution and it is valid for Rs=1.25 mm and ap=2 mm. The punch radius and the receiving hole radius are consistent with those recommended in the CEN Code of Practice
[1].
𝜀 = 0.17959Δ + 0.09357Δ2+ 0.0044Δ3 (9)
9 2.4 Applicability of the Membrane Stretching Theory to the SPCT Specimen
Behaviour
Although Chakrabarty’s theory was developed for a rigid-plastic membrane (not involving
creep deformation) it was used by CEN Code of Practice for SPCT data interpretation [1].
The membrane stretching model is rigorously valid for an exponential hardening law, but it is
also applicable to different hardening laws. Furthermore, the specimen is assumed to
uniquely experience a membrane stretching deformation, while the strain variation in the
through-thickness direction is neglected [11, 15]. During small punch creep test, the
specimen deformation is caused by bending prior to membrane stretching, therefore, the work
presented in this paper is also aimed to investigate the applicability of Chakrabarty’s theory
to SPCT data interpretation [7, 8, 11, 25]. The study was carried out by investigating the
evolution of the contact angle, θ0, throughout the test.
3
FINITE ELEMENT CREEP DAMAGE ANALYSES
3.1 Model Definition
In order to study the evolution of the contact angle, θ0, with the load magnitude, P, and to
find a correlation between the contact angle and the dimensions of the punch and the
specimen, a number of finite element analyses were performed. Five punch load levels have
been used for the analyses: 90, 110, 130, 150 and 200 N. The receiving hole radius, ap, has been kept constant and equal to 2 mm. Three different punch radii, Rs, have been adopted: 1.04, 1.25 and 1.50 mm. The initial specimen thickness, t0, varies among 0.5, 0.4, 0.3 and 0.2 mm. All the geometry parameters are in the respectively ranges suggested by the CEN Code
of Practice [1]. The recommended “standard” dimensions in the CEN Code of Practice are
10
In the open literature, the punch is generally modelled as a rigid body, while displacement
boundary conditions, i.e. simply supported constrains, are adopted instead of modelling the
holder and the support [26-28]. In particular Dymáček et al. show that if the punch load is
less than 400 N and the upper and lower dies are not allowed to deform during the test, the
time to rupture obtained by the FE analyses is closer to the experimental time to failure [26].
Ma et al. also model the holder and the support as rigid bodies [25]. Therefore, in this
research, the upper and lower dies and the punch ball were modelled as rigid bodies. The
horizontal translation and the rotational degrees of freedom of the punch and the holder were
constrained, as well as all the rigid body degrees of freedom of the support. The specimen is
clamped by a load of 500 N applied to the holder reference point. Since the specimen exhibits
large deformations and since its shape significantly changes during the creep analysis, the
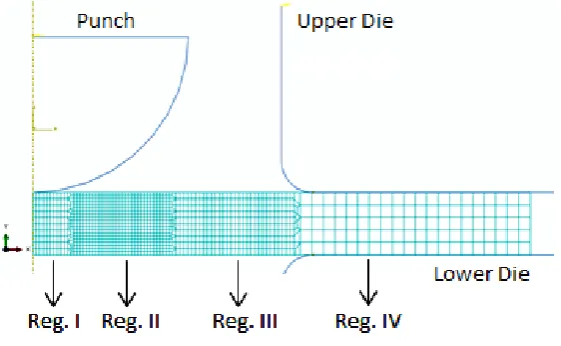
non-linear geometry formulation has been adopted [8, 11, 29, 30]. Figure 2 shows the FE
model implemented for the calculations. The FE analyses were performed by ABAQUS and a
[image:10.595.154.435.468.641.2]User Subroutine was used for the implementation of Liu and Murakami’s model.
Figure 2. FE model used for the calculations.
3.2 Meshing and Contact Modelling
The specimen is the only solid body of the model taken to be deformable. The finite element
11
elements (four-nodded bilinear with a reduced integration scheme) in ABAQUS [31]. Since
severe incompressible deformation arises throughout the SPCT analysis, reduced integration
elements have been used in order to avoid numerical errors due to shear and volume locking,
see also ref. [25]. It should be noted that bending deformation is not negligible during the
early stages of the creep deformation [32, 33], at least with the geometry recommended by
CEN, therefore, a suitable number of elements was included through the thickness of the
specimen in order to accurately calculate the stress field in the specimen. The choice of the
element size was based on the work of Ma et al. [25] and the results obtained by
implementing the described model, in terms of damage propagation, are comparable to those
found in the literature [2, 7, 13, 20, 25]. Figure 2 shows the mesh used for the FE analyses,
where four regions can be identified. A coarse mesh has been generated in Region IV,
because that location is not critical for the numerical results (as it is away from the area of the
specimen where necking occurs) and the corresponding deformation is expected to be small
[9, 25]. The necking area, Region II in Figure 2, where the most severe deformations are
expected, is characterised by the smallest element size. A mesh sensitive study was carried
out in order for this region to be centred on the location where necking is expected, which
agrees with the findings reported in refs. [9, 25]. Regions I and III are also characterised by a
relatively fine discretisation because they are adjacent to the necking area and the contact
interaction with the punch has been defined on them as well. A surface to surface contact
formulation has been used for the interactions between the specimen (slave contact surface)
and the punch (master contact surface) and between the specimen and the dies (master
contact surfaces). For the normal behaviour of all of the contact interactions, a hard
pressure-overclosure relationship has been used, with a penalty formulation adopted for the tangential
behaviour, with a friction coefficient, μ, of 0.8 for the clamps/specimen and 0.3 for the
12
coefficient between the punch and the specimen for steels at temperatures higher than 600 °C
[34], while Cortellino et al. assume μ=0.8 between the disc and the clamps [7]. The nodes
defined on the contact surfaces between the test rig components (in particular the punch) and
the specimen experience relative sliding, therefore, a finite sliding contact tracking approach
was used for the frictional formulation [7].
3.3 Creep Damage Material Model
In a uniaxial creep test, damage occurs only in the tertiary creep region [35-37], while during
a small punch creep test the material is subjected to damage in both the primary and
secondary regions of the creep curve as well as in the tertiary region [20, 24]. Damage can be
described as the ratio between the damaged area and the initial area. This ratio is expressed in
equation (10), where A’ and A0 are the undamaged area and the initial area respectively.
𝜔 =𝐴0 − 𝐴′
𝐴0 , 𝑤𝑖𝑡ℎ 0 ≤ 𝜔 ≤ 1
(10)
Kachanov (1958) and Rabotnov (1969) proposed a creep continuous damage mechanics
model which describes the cavitation damage. The numerical singularity which occurs when
the damage variable approaches its critical value (𝜔 → 1) is a limitation of this model, which
has been overcome by Liu and Murakami’s constitutive model [38] in 1998. Both these
models degenerate in Norton’s creep law [39] when the damage is zero. As a matter of fact,
the latter is capable of describing only the first two regions of the creep curve, while the other
two models allow the entire creep curve to be obtained until the specimen failures. Liu and
Murakami’s constitutive model relates the creep strain rate, 𝜀̇𝑖𝑗𝑐, with the stress and the
13
material constants. It should be also noted that the hydrostatic part of the tensor stress does
not concur to creep damage.
𝜀̇𝑖𝑗𝑐 =3 2𝐵𝜎𝐸𝑄𝑛
𝑆𝑖𝑗
𝜎𝐸𝑄𝑒𝑥𝑝
[
2(𝑛 + 1)
𝜋√1 +𝑛3 ( 𝜎1
𝜎𝐸𝑄) 2
𝜔3/2
]
(11)
𝜔̇ = 𝐴1 − exp [−𝑞2]
𝑞2 𝜎𝑅𝑈𝑃𝜒 exp [𝑞2𝜔] (12)
𝜎𝑅𝑈𝑃 = 𝛼𝜎1+ (1 − 𝛼)𝜎𝐸𝑄 (13)
A continuous model for the reduction in load-carrying capability of the damaged material is
given in equation (14), where E0 is the Young’s modulus of the undamaged material and E is the Young’s modulus of the damaged material. In view of equation (14), the stiffness of the
damaged material decreases when the damage variable value increases. Since the specimen
rupture occurs when ω approaches 1, in the present work, the maximum damage value has
been limited to 𝜔𝑀𝐴𝑋 = 0.9901, in order to avoid computational problems. However, the use
of equation (14) can also lead to numerical inaccuracies because, in the areas where the
specimen is failed, characterised by ω= ωMAX, the FE model of the specimen can potentially
carry some load, while this is not physically realistic. A novel alternative to equation (14) is
proposed in the present work and is reported in equation (15), with 0≤ω<0.9901, and in
equation (16), with ω=0.9901.
𝐸 = 𝐸0(1 − 𝜔), 0 ≤ 𝜔 ≤ 1 (14)
{𝐸 = 𝐸0(1 − 𝜔), 0 ≤ 𝜔 < 0.9901
𝐸 = 0.01 𝑀𝑃𝑎, 𝜔 = 0.9901 (15)(16)
3.4 Elastic-Plastic Constitutive Models
In section 6.6 attention is paid to the evolution of the contact angle when other material
14
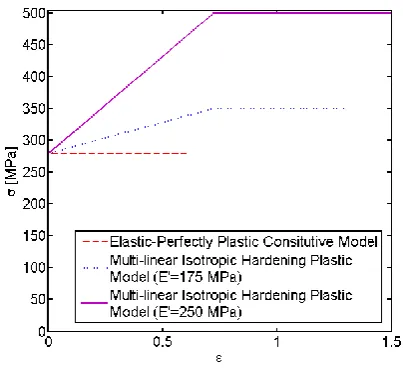
been adopted: two multi-linear isotropic hardening plastic models, characterized by a yielding
stress, σy, of 280 MPa and a tangential modulus, E’, of 175 and 250 MPa, respectively, and
an elastic-perfectly plastic constitutive model with σy = 280 MPa. These values of σy and E’
are realistic for a P91 steel at room temperature. Figure 3 plots the variation of stress versus
strain for the two multi-linear isotropic hardening plastic models and the elastic-perfectly
[image:14.595.196.398.248.434.2]plastic constitutive model.
Figure 3. Variation of stress versus strain: two multi-linear isotropic hardening plastic models were used, together with an elastic-perfectly plastic constitutive model.
4
EXPERIMENTAL TESTS
Interrupted small punch creep tests were carried out in order to measure the contact angle at
different stages of the creep curve. The test data were compared to those acquired by
Cortellino et al. [2] and to the FE results obtained for this research (see section 6.5.2).
4.1 Tested Material and Test rig
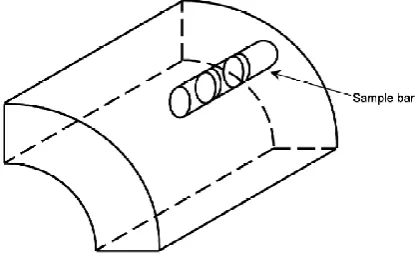
The tested material and the test rig geometry, of which Figure 4 reports a schematic cross
section, are the same as those used by Cortellino et al. [2], who carried out several interrupted
small punch creep tests of a P91 steel with an initial thickness of the specimen of 0.5 mm and
15
For this research, a P91 steel has been used to machine various small disc specimens with a
final thickness of 0.300±0.001 mm from a power plant steam pipe section, sketched in Figure
5, which has an outer diameter and a wall thickness of 298.5 and 55mm, respectively. Table 1
and Table 2 show, respectively, the chemical composition, in wt%, of the P91 steel used for
the investigation in ref. [36] and the material constants of the P91 steel at 650 °C for the
damage law [25].
A load of 11.5 kg was applied to the dead-weight machine. The temperature was held at
650±1 °C by the single-zone temperature controller of the furnace. A thermocouple was
inserted at approximately 10 mm below the specimen for allowing the tracing of potential
fluctuations of the temperature by the data acquisition system. The loading mechanism of the
machine had centralised slides which allowed the dead weight load to be applied coaxially
with the test assembly. Since the experimental results depend on the set up geometry, the
non-repeatability of the small punch testing technique is a major concern [1, 4, 12, 13].
Cortellino et al. found that, when eccentricities in the punch load occur, both the failure life
and the minimum creep strain rate can significantly change with respect to a situation in
which the punch load is perfectly aligned [8]. This also leads to asymmetry in the maximum
principal stress and in the damage variable of the specimen [8].
Table 1. Chemical composition, in wt%, of the P91 steel used for the investigation in ref. [40].
Cr Mo C Si S P Al V Nb N W
[image:15.595.67.529.641.677.2]8.60 1.02 0.12 0.34 <0.002 0.017 0.007 0.24 0.070 0.060 0.03
Table 2. Material constants for a P91 steel at 650 °C, with stress (MPa) and time (h) [29].
E0 [MPa] ν B n A χ q2 α
16
Figure 4. Schematiccross section of the experimental set-up used for the SPCTs with dimensions in mm, adapted from ref. [20].
Figure 5. Schematic representation of the specimens manufacturing from the P91 steel pipe, from ref. [2].
5
CALCULATION OF THE CONTACT ANGLE
For each time instant, and of the punch displacement, the contact angle, θ0, has been
calculated by equation (17), where rcontact is the distance of the contact edge from the axis of symmetry of the specimen, measured on the deformed configuration in the radial direction.
𝜃0 = sin−1 (𝑟𝑐𝑜𝑛𝑡𝑎𝑐𝑡
𝑅𝑠 ) (17)
[image:16.595.197.405.344.477.2]17
6
RESULTS AND DISCUSSION
6.1 Experimental results
Figure 6 shows the creep test curves, in terms of the variation of the central deformation of
the specimen, Δ, versus time, t, obtained by small punch creep tests carried out by applying a
[image:17.595.197.399.234.425.2]load of 11.5 kg to specimens with t0 =0.3 mm at a constant temperature of 650 °C.
Figure 6. Variation of the central deformation of the specimen versus time for the completed and interrupted tests under a load of 11.35 kg, with Rs = 1.04 mm and t0=0.3 mm.
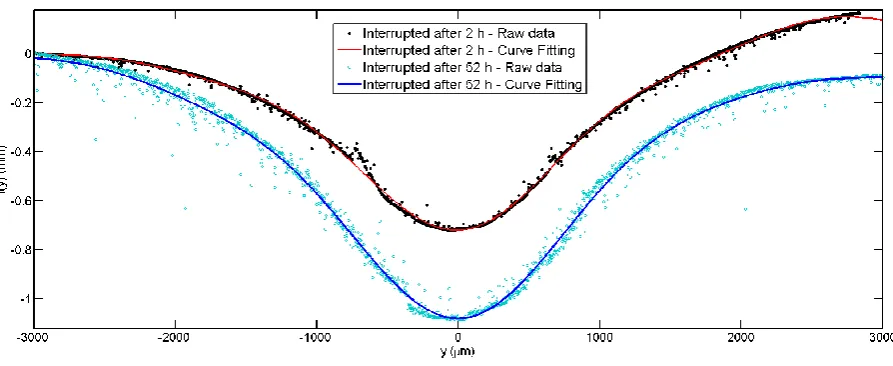
Brucker Interferometer was used to measure the specimen profiles. Figure 7 and Figure 8
show, respectively, 3D and 2D images, respectively, of the profiles of the SPCT specimens
from Bruker Interferometer for the tests interrupted after 2 h (𝑡 𝑡
𝑓
⁄ ≈ 0, ∆ ∆⁄ 𝑓≈ 0.40) and
after 52 h (𝑡 𝑡
𝑓
⁄ ≈ 0.23, ∆ ∆⁄ 𝑓 ≈ 0.62). Figure 9 shows the depth of the 2D profiles, f(y),
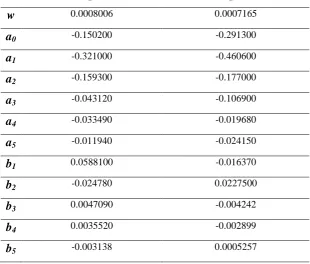
which was fitted against the distance, y, from the axis of symmetry of the specimen in the
radial direction, by use of a Fourier polynomial function, as shown in equation (18). The
fitting constant set, reported in Table 3, consists of ai, for i=0…5, of bi, for i=1…5, and of the
18
𝑓(𝑦) = 𝑎0+ 𝑎1cos(𝑤𝑦) + 𝑏1sin(𝑤𝑦) + 𝑎2cos(2𝑤𝑦) + 𝑏2sin(2𝑤𝑦)
+ 𝑎3cos(3𝑤𝑦) + 𝑏3sin(3𝑤𝑦) + 𝑎4cos(4𝑤𝑦) + 𝑏4sin(4𝑤𝑦)
+ 𝑎5cos(5𝑤𝑦) + 𝑏5sin(5𝑤𝑦)
(18)
The contact radii for the two tests, required to obtain the contact angles by equation (17),
were identified by the values of y that satisfy equation (19), i.e. equating to 0 the second derivative of f(y) with respect to y. The contact angles, calculated by using the described procedure, are equal to 40° and 45.73° for the test interrupted after 2 and 52 hours,
respectively.
𝑑2(𝑓(𝑦))
[image:18.595.66.377.384.648.2]𝑑𝑦2 = 0 (19)
Table 3.Fitting constants for equation (18).
Test interrupted after 2 h Test interrupted after 52 h
w 0.0008006 0.0007165
a0 -0.150200 -0.291300
a1 -0.321000 -0.460600
a2 -0.159300 -0.177000
a3 -0.043120 -0.106900
a4 -0.033490 -0.019680
a5 -0.011940 -0.024150
b1 0.0588100 -0.016370
b2 -0.024780 0.0227500
b3 0.0047090 -0.004242
b4 0.0035520 -0.002899
19
[image:19.595.80.521.310.477.2]Figure 7. 3D image of the profile of the SPCT specimen from Bruker Interferometer for the test interrupted after 52 hours.
Figure 8. 2D images, in the xy plane, of the profile of the SPCT specimens from Bruker Interferometer for the tests interrupted after (a) 2 hours and (b) 52 hours.
Figure 9. Depth of theSPCT specimen 2D profiles from Bruker Interferometer for the test interrupted after 2 and 52 hours, plotted against the distance from the axis of symmetry of the specimen in the radial direction.
[image:19.595.75.522.531.714.2]20
Figure 9 shows an asymmetry in the deformation of the specimens which can been related to
a misalignment of the punch load, as reported by Cortellino et al. [8]. The asymmetry is more
evident for the test interrupted after 2 hours, therefore the eccentricity of the punch load was
larger for that test.
Additional small punch creep tests, carried out by Cortellino et al. [2]. Figure 10 shows SEM
images of those tests interrupted after (a) 2 hours (𝑡 𝑡
𝑓
⁄ ≈ 0, ∆ ∆⁄ 𝑓 ≈ 0.40), (b) 200 hours
(𝑡 𝑡
𝑓
⁄ ≈ 0.20, ∆ ∆⁄ 𝑓 ≈ 0.62) and (c) after 669 hours (𝑡 𝑡
𝑓
⁄ ≈ 0.64, ∆ ∆⁄ 𝑓≈ 0.82), and FE
damage contour plots for a P91 steel at 650 °C under a load of 200 N, with Rs=1.04 mm and
t0=0.5 mm. The FE damage contour plot will be discussed in section 6.5.2. The SEM images were used to calculate the contact angle by equation (17), by considering as contact radius the
one at the inflection point of the profile of the inner surface of the specimens, clearly visible
from the SEM images in Figure 10. The calculations leaded to values of the contact angle of
39°, 42.69° and 60.62° for the tests interrupted after 2 h (𝑡 𝑡
𝑓
⁄ ≈ 0, ∆ ∆⁄ 𝑓≈ 0.40), 200 h
(𝑡 𝑡
𝑓
⁄ ≈ 0.20, ∆ ∆⁄ 𝑓 ≈ 0.62) and 669 h (𝑡 𝑡
𝑓
⁄ ≈ 0.64, ∆ ∆⁄ 𝑓≈ 0.82), respectively. These
values of θ0 are similar to those obtained from tests with an initial thickness of the specimen
21
Figure 10. SEM images from ref. [2] for a small punch creep test, for a P91 steel at 600 °C with a load of 25 kg, interrupted after (a) 2 hours (𝑡⁄ ≈ 0, ∆ ∆𝑡𝑓
𝑓
⁄ ≈ 0.40), (b) 200 hours (𝑡⁄ ≈ 0.20, ∆ ∆𝑡𝑓
𝑓
⁄ ≈ 0.62) and (c) after 669 hours (𝑡⁄ ≈ 0.64,𝑡𝑓
∆ ∆𝑓
⁄ ≈ 0.82), and FE damage contour plots for a P91 steel at 650 °C under a load of 200 N, with Rs=1.04 mm and t0=0.5
mm.
6.2 Preliminary FE Results
In order to evaluate the accuracy of the coupled equations adopted between creep and
elasticity, a set of preliminary analyses was carried out by using equation (14) and equations
(15) and (16), respectively. Figure 11 (a) shows the contour plot of the von Mises equivalent
stress when the specimen is approaching the failure time, obtained by using equation (14), i.e.
the continuous damage model without modification, while Figure 11 (b) shows the contour
plot of the von Mises equivalent stress, at the failure time, obtained by using equations (15)
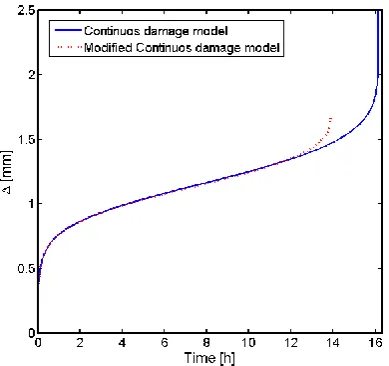
and (16). By using the modified continuous damage model, the time to rupture is lower than
that obtained by using equation (14). The reduction in the failure time is caused by the
complete disappearing of load carrying capability of the material obtained when ω
approaches unity and the modified continuous damage model is used, while, when equation
(14) is adopted, the material still has a residual strength when ω→1.
When equation (14) is used, the central displacement of the punch continues increasing after
the time when the damage variable reaches the upper bound on a path through the whole
thickness of the sample. The solver is able to compute an equilibrium configuration,
22
not negligible. When the modified coupling equations are used, the solver cannot calculate a
balanced configuration as soon as ω=ωMAX through the whole thickness of the specimen. The
reason for the more rapid non-convergence of the solution is the faster decrease in the load
carrying capability of the specimen, therefore, the modified coupling equations show to be
[image:22.595.106.494.215.372.2]more accurate that equation (14) for the modelling procedure of SPCT.
Figure 11. Contour plots of the von Mises equivalent stress obtained with a load of 200 N at (a) t=15.38h, by using a continuous damage model, and at (b) t=tf=13.89h, by using the modified coupling equations.
Figure 12. Punch displacement vs. time curves obtained under a load of 200 N, with Rs=1.04 mm, t0=0.5 mm, by using the
continuous damage model and the modified model.
In view of the more accurate description of the decrease in the load carrying capability of the
[image:22.595.202.397.438.621.2]23 6.3 Effects of Load Magnitudes
The effects of the punch load magnitude on the evolution of the contact angle were
investigated and punch load levels of 90, 110, 130, 150 and 200 N were used for the FE
analyses. The punch radius and the specimen initial thickness have been fixed at 1.04 and 0.5
mm, respectively. As shown in Figure 13, the load magnitude does not affect the θ0
evolution. This is in agreement with Chakrabarty’s theory [15], in which the load level is not
involved in the equations describing the contact angle evolution.
However, the load does not influence the variation of θ0 versus Δ because the model does not
include the effects of plasticity, which is governed by the load level, on the creep response of
the specimen, which influence the deformation mode of the specimen and, as a consequence,
[image:23.595.196.398.376.566.2]the variation of θ0 versus Δ [7, 20].
Figure 13. Evolution of the contact angle under five different punch load magnitudes, with Rs=1.04 mm and t0=0.5 mm.
6.4 Effects of Friction Coefficient
The effects of friction between the punch and the specimen on the evolution of the contact
angle were investigated and the values of the friction coefficient, μ, of 0, 0.2, 0.3, and 0.5
were used for the FE analyses. The punch radius and the specimen initial thickness were held
at 1.04 and 0.5 mm, respectively, while the punch load was held at 90 N. As shown in Figure
24
respectively show that the creep equivalent strain and the von Mises equivalent stress, plotted
against the punch displacement, exhibit remarkably similar trends when different friction
[image:24.595.196.398.165.355.2]coefficients between the punch and the specimen are used.
Figure 14. Evolution of the contact angle for different values of the friction coefficient between the punch and the specimen with Rs=1.04 mm and t0=0.5 mm, under a load of 90 N.
Figure 15. (a) Creep equivalent strain variation and (b) von Mises equivalent stress variation versus punch displacement, evaluated at the integration point of the element 780 in the mid-section of the specimen necking area, for different values of
the friction coefficient between the punch and the specimen, with Rs=1.04 mm and t0=0.5 mm, under a load of 90 N.
6.5 Effects of Punch/Specimen Dimensions
In order to investigate the effects of the punch radius and of the initial thickness of the
[image:24.595.75.519.417.629.2]25
1.50 mm) and four different specimen initial thicknesses, t0, (0.5, 0.4, 0.3 and 0.2 mm) were adopted for the FE analyses. A receiving hole radius, ap, of 2 mm, and a punch load of 90 N, were kept constant. The FE results were compared with the Chakrabarty analytical solutions
and with the experimental data.
6.5.1 FE and analytical solutions
Figure 16 show that the contact angle evolution, plotted against the central punch
displacement, Δ, tends to approach to Chakrabarty’s θ0 distribution when the punch radius
increases and the specimen initial thickness decreases. In particular, membrane stretching can
be assumed as the governing mechanism for the specimen deformation when
{
0.8 < Δ < 0.95 mm, 1.04 ≤ 𝑅𝑠 < 1.25 mm
0.8 < Δ < 1.15 mm, 1.25 ≤ 𝑅𝑠 < 1.50 mm
Δ > 0.8 mm, 𝑅𝑠 = 1.50 mm.
In those ranges, the FE results match with the analytical solution when 0.2 mm ≤ t0≤ 0.3 mm
obtained by Chakrabarty’s theory, which is valid when the thickness of the blank is small
compared to the punch radius. The reason why the SPCT specimen experiences bending as
the governing deformation mechanism when Δ is out of the range boundaries determined in
this research can be partly related to the boundary conditions applied to the disc. As shown in
Figure 1, Chakrabarty’s specimen is allowed to rotate of an angle θ where the support is
applied, while, in the same position, the SPCT specimen cannot rotate at the support due to
26
Figure 16. Evolution of the contact angle under a load of 90 N, with different initial thickness of the specimen and with (a)
Rs=1.04 mm, (b) Rs=1.25 mm and (c) Rs=1.50 mm. The FE data are compared with Chakrabarty’s analytical solution.
Figure 17 shows the variation of the contact angle obtained from FE analyses with the
reciprocal initial thickness of the specimen at several fixed Δ values, with Rs equals 1.25 mm.
When the specimen initial thickness decreases from 0.2 to 0.1 mm, the contact angle tends to
be constant, as assumed in Chakrabarty’s theory [15], which is valid when t0 is small
27
Figure 17. Contact angle vs. thickness reciprocal under a load of 90 N, with Rs=1.25 mm and constant punch displacements.
In Figure 18, the contact angle, obtained by FE calculations, is plotted versus the initial
thickness of the specimen and the punch displacement, both normalised by ap. The FE results of Figure 18 were fitted by a relation of the form of equation (20), where a, b, c, d, e, f and g
are fitting constants, listed in Table 4. It should be noted that these constants are different for
each punch radius.
𝜃0 = 𝑎𝑙𝑛 (𝑔𝑡0
𝑎𝑝
∆ 𝑎𝑝) + b
∆ 𝑎𝑝+ c
𝑡0 𝑎𝑝 + (d
𝑡0 𝑎𝑝+ e
∆ 𝑎𝑝)
𝑓
(20)
A surface fitting of the form of equation (21) was also found for the evolution of the contact
angle at failure, θ0f, versus the specimen thickness and the punch radius, where pi,for i=0…8, are fitting constants, listed in Table 5. Figure 19 plots the evolution of θ0f with t0/ap and Rs/ap.
𝜃0𝑓 = 𝑝0+ 𝑝1
𝑡0
𝑎𝑝+ 𝑝2
𝑅𝑠
𝑎𝑝+ 𝑝3(
𝑡0
𝑎𝑝) 2
+ 𝑝4
𝑡0
𝑎𝑝
𝑅𝑠
𝑎𝑝+ 𝑝5(
𝑅𝑠
𝑎𝑝) 2
+ 𝑝6(
𝑡0
𝑎𝑝) 3
+ 𝑝7(
𝑡0
𝑎𝑝) 2
𝑅𝑠
𝑎𝑝+ 𝑝8
𝑡0
𝑎𝑝(
𝑅𝑠
𝑎𝑝) 2
28
Table 4. Fitting constants for equation (20).
Rs [mm] a b c d e f g
1.04 0.06195 1.021 -0.875 2.165 0.4317 0.4545 0.5026
1.25 0.04659 0.9759 0.1492*10-3 0.4995 0.2288 0.3584 0.2732
[image:28.595.76.527.228.671.2]1.50 0.03861 0.9509 0.1369*10-3 0.4009 0.2258 0.2704 0.006693
Table 5. Fitting constants for equation (21).
p0 p1 p2 p3 p4 p5 p6 p7 p8
2.341 -0.06726 -0.7115 39.3 -27.37 -0.6988 8.217 -45.92 31.15
Figure 18. Evolution of the contact angle with the punch displacement and the specimen initial thickness both initialised by
29
Figure 19. Evolution of the contact angle at failure with the punch radius and the specimen initial thickness, with the fitted surface to the FE data.
6.5.2 Comparison with the Experimental Findings
A comparison of the numerical and analytical results with the measured experimental data of
tested SPCT specimens was also carried out. The contact angles found for the two interrupted
tests with t0=0.3 mm match with both Chakrabarty’s solution and the FE results, as reported in Figure 21.
Also, the experimental results obtained by Cortellino et al. in 2014 [2] with t0=0.5 mm were compared with FE results in terms of deformation shape and damage propagation. The FE
analysis was performed assuming for the specimen and the punch the same geometry as in
ref. [2], a punch load of 200 N and a constant temperature of 650 °C. From Figure 10 (a) it is
possible to notice that after two hours the deformation of the specimen had already reached
the 40% of its final value, due to creep mechanism. The damage of the specimen was found
to be very low, around 30%, and localized in the bottom of the specimen in the necking area,
close to the axis of symmetry. Figure 10 (b) shows that, after 200 h, the damage in the
specimen was around 70%, and it had spread toward the middle of the necking area and
through the thickness of the specimen. In Figure 10 (c) the crack in the specimen (ω ≈ 1) is
visible both in the tested specimen and in the FE contour plot. Cortellino et al. also carried
30
spread along the hoop direction of the bottom surface of the disc as well as through the
thickness of the specimen [2]. Figure 20 shows the propagation of micro-cracks at the tip of
the crack for the test interrupted after 669 h [2, 20]. The FE analysis show that the zone
affected by the maximum damage spread from the bottom of the specimen through the
[image:30.595.169.429.213.389.2]thickness in the necking area as reported in the open literature [2, 7, 13, 20, 25].
Figure 20. SEM image from ref. [2] for a small punch creep test, for a P91 steel at 600 °C with a load of 25 kg, interrupted after 669 h.
The difference between the test temperature and that assumed for the material properties
adopted for the FE analyses does not change the creep mechanism characterising the
deformation of the specimen, which is represented by dislocation creep in the secondary
creep regime and inter-granular cavitation when the tertiary creep stage is reached [20]. The
experimental and FE data in terms of contact angle were also compared with Chakrabarty’s
solution. Figure 21 plots the contact angle obtained by the numerical, analytical and
experimental procedures versus the punch displacement, and shows the consistency between
the FE and analytical results with the experimental evidence. The differences between
experimental data and FE results can be related to the effects of significant plastic
deformation which is experienced by the SPCT specimen during the test [7, 11] and to the
approximation of the friction formulation used in the FE analyses for the interactions between
31
the punch load might also be occurred, as well as specimen elastic recovery [8]. Cortellino et
al. report an increase of the failure life up to 10% when initial plastic deformation is included
in the model [7]. Both Kobayashi et al. [41] and Cortellino et al. [20] found that the time to
failure increases up to 8% when the friction coefficient between the specimen and the punch
varies from 0 to 0.5. Punch load misalignments can make the failure life to increase up to
[image:31.595.193.402.250.447.2]1.6%, according to Ref. [8].
Figure 21. Evolution of the contact angle: comparison among FE results, Chakrabarty’s analytical solution and experimental data.
The comparison of the variation of θ0 versus Δ identified from FE results with material
properties at 650 °C with that obtained from the results of tests carried out at 600 °C is
possible because, at these two temperatures, the creep mechanism governing the deformation
of the specimen is the same, i.e. dislocation creep, therefore the deformation modes are
consistent [20].
6.6 Evolution of the Contact Angle under Different Material Constitutive Models
The effects of different material constitutive models (such as the multi-linear isotropic
32
section 3.4) on the variation of θ0 versus Δ were investigated and compared to those obtained
by Liu and Murakami’s damage constitutive model and Norton’s model.
The punch radius was held constant to 1.04 mm. The load has been chosen to be 200 N and
90 N for creep analyses, for an initial specimen thickness of 0.5 mm and 0.3 mm,
respectively. Figure 22 shows the evolution of the contact angle plotted against the central
punch displacement, Δ, for these different constitutive models, also compared with
Chakrabarty’s solution. The FE results show that the specimen deformation shape is the same
for all models, but, when Δ > 0.8 mm, the instantaneous distortion due to strain hardening is
quite different from the viscous distortion due to creep, as the mechanism which governs the
stress distribution is different. In fact, during creep, the material is subjected to relaxation
(Figure 15) and, even if the stress is redistributed around a failed area, allowing the specimen
to continue in carrying some load, this behaviour cannot be described as hardening.
It is to be noted that Norton’s model can produce complex θ0 or numerical errors in θ0
calculation when Δ > 1.6 mm. This Δ value was found to depend on the initial thickness of
the specimen and on the applied load. From the definition of the contact angle in equation
(17), this means that Norton’s model simulates the penetration of the punch in the specimen.
Whereas the specimen volume is constant and this penetration has not been observed during
tests (see also ref. [2]) and although Norton’s model FE results are close to the Chakrabarty
analytical solution, this model can predict the deformation shape, but not the failure
33
Figure 22. Evolution of the contact angle for different constitutive models, with Rs=1.04 mm and with (a) t0=0.5 mm, with a
load of 200 N, and with (b) t0=0.3 mm, with a load of 90 N.
7
CONCLUSION REMARKS
The current research presented an original study on the evolution of the contact angle of the
small punch creep test specimen, with the goals to investigate the applicability of both
Chakrabarty’s membrane stretching theory and of the CEN Code of Practice CWA 15627 on
SPCTs, and to enlighten the deformation and failure mechanisms of the SPCT specimen.
Currently, material continuous damage models, based on Liu and Murakami’s model, cannot
simulate zero-stress in those areas where the specimen was supposed to be failed, therefore a
modified continuous damage model was developed and used in this work.
The results of FE analyses showed that the variation of the friction coefficient and of the
punch load level has no influence on the evolution of the contact angle with the central punch
displacement.
Further FE analyses were performed for evaluating the effects of different material
constitutive models on the variation of θ0 with Δ. The deformed shape of the specimen was
34
found to be the same for all material models, but the instantaneous distortion was found to be
different from the viscous distortion caused by creep.
Changes in the initial thickness of the specimen and in the punch radius have significant
effects on the evolution of the contact angle with the central punch displacement, as they
determine the values of Δ for which membrane stretching can be assumed as the governing
mechanism of the specimen deformation. The numerical results were fitted by equations in
two variables and compared to the Chakrabarty analytical solution and to the experimental
data, allowing for the evaluation of new ranges of applicability of the CEN Code of Practice
CWA 15627 and of Chakrabarty’s theory on the SPCTs.
Some differences were found between the numerical results and the experimental data, and
they have been associated to some factors which have not been included in the numerical
calculations, but could have been occurred during the tests, i.e. the effects on the specimen
time to failure of punch load misalignments, of initial plasticity, and of friction coefficient
between the punch and the specimen. In the open literature, it has been found that the
increment in the failure life is larger when the effects of initial plasticity and of friction
coefficient are considered in the FE model.
The results obtained could be useful for the development of an improved data conversion
relationship between the SPCT data and the uniaxial creep test data, and in particular for the
progression in the upgrade of the CEN Code of Practice CWA 15627.
ACKNOWLEDGMENTS
We would like to acknowledge the support of the Engineering and Physical Sciences
Research Council (EPSRC) for their support for the project - Flexible and Efficient Power
Plant: Flex-E-Plant (Grant number: EP/K021095/1). We also thank the following partners for
35
plc., EDF Energy (West Burton Power) Limited, E.ON Technologies (Ratcliffe) Limited,
Goodwin Steel Castings Limited, NPL Management Limited, R-MC Power Recovery
Limited, RWE Generation UK plc., Scottish and Southern Energy (SSE) plc., Siemens
Industrial Turbomachinery and TWI Limited.
We would also thank Dr Francesco Cortellino for his valuable technical support and Mr
Shane Maskill for his assistance in experimental testing during the development of this
research.
REFERENCES
1. CEN, CWA 15627 Workshop Agreement: Small Punch Test Method for Metallic Materials. European Committee for Standardisation, 2006.
2. Cortellino, F., R. Chen, W. Sun, and T.H. Hyde, A Microscopic Investigation on the Failure Mechanisms of Small Punch Creep Test of a P91 Steel at 873 K, in SSTT - Determination of mechanical properties of materials by small punch and other miniature testing techniques K. Matocha, R. Hurst, and W. Sun, Editors. 2014, OCELOT s.r.o.: Castle Seggau - Graz (Austria). p. 260-269.
3. Hyde, T.H., W. Sun, and J.A. Williams, Requirements for and Use of Miniature Test Specimens to Provide Mechanical and Creep Properties of Materials: a Review. Int. Mater. Rev., 2007. 52(4): p. 213-255.
4. Hyde, T.H., F. Cortellino, J.P. Rouse, and W. Sun, Small Punch Creep Testing and Data Analysis of a P91 Steel at 650 oC, in SSTT - Determination of mechanical properties of materials by small punch and other miniature testing techniques, K. Matocha, R. Hurst, and W. Sun, Editors. 2012, OCELOT s.r.o.: Ostrava (CZ).
5. Hyde, T.H., W. Sun, and A.A. Becker, Analysis of the Impression Creep Test Method Using a Rectangular Indenter for Determining the Creep Properties in Welds.
International Journal of Mechanical Sciences, 1996. 38: p. 1089-1102.
6. Hyde, T.H. and W. Sun, A Novel, High Sensitivity, Small Specimen Creep Test.
Journal of Strain Analysis, 2009. 44(3): p. 171-185.
7. Cortellino, F., J.P. Rouse, W. Sun, and T.H. Hyde. A Study on the Effect of Initial Plasticity on the Small Punch Creep Test for a P91 Steel at 600 oC in SSTT - Determination of mechanical properties of materials by small punch and other miniature testing techniques. 2014. Castle Seggau - Graz (Austria): OCELOT s.r.o. 8. Cortellino, F., W. Sun, T.H. Hyde, and J. Shingledecker, The Effects of Geometrical
Inaccuracies of the Experimental Set-Up on Small Punch Creep Test Results. The Journal of Strain Analysis for Engineering Design, 2014. 49(8): p. 571-582.
9. Dymáček, P. and K. Milička, Creep Small-Punch Testing and its Numerical Simulations. Materials Science and Engineering: A, 2009. 510(11): p. 444-449.
36
11. Rouse, J.P., F. Cortellino, W. Sun, T.H. Hyde, and J. Shingledecker, Small Punch Creep Testing: Review on Modelling And Data Interpretation. Materials Science and Technology, 2013. 29(11): p. 1328-1345.
12. Evans, M. and D. Wang, Stochastic Modelling of the Small Disc Creep Test. Materials Science and Technology, 2007. 23(8): p. 883-892.
13. Evans, M. and D. Wang, The Small Punch Creep Test: Some Results from a Numerical Model. Journal of Materials Science, 2008. 43(6): p. 1825-1835.
14. Bicego, V., E. Lucon, and R. Crudeli, Integrated Technologies for Life Assessment of Primary Power Plant Components. Nuclear and Engineering Design, 1998. 182(2): p. 113-121.
15. Chakrabarty, J., A Theory of Stretch Forming Over Hemispherical Punch Heads.
International Journal of Mechanical Sciences, 1970. 12(4): p. 315–325.
16. Tettamanti, S. and R. Crudeli. A Procedure for High Temperature Plant Components Life Evaluation: Small Punch Creep Test Methodology. in Case histories on integrity and failures in industry (CHIFI). 1999. Milan - Italy.
17. Li, Y. and R. Sturm, Small Punch Tests for Welded Heat Affected Zones, in
International Conference on Welds 2005. 2005: Geesthacht.
18. Yang, Z. and Z.W. Wang, Relationship Between Strain and Central Deflection in Small Punch Creep Specimens. International Journal of Pressure Vessels and Piping, 2003. 80(6): p. 397-404.
19. Hyde, T.H. and W. Sun, Interpretation of Small Punch Creep Test Data for Ductile Materials. Hutnické listy (Metallurgical Journal), 2010. LXIII: p. 25-33.
20. Cortellino, F., Experimental and numerical investigation of small punch creep test. 2015, Ph. D Thesis, The Univeristy of Nottingham.
21. Li, Y.Z. and R. Šturm, Small Punch Test for Weld Heat Affected Zones. Matererials at High Temperatures, 2006. 23(3-4): p. 225-232.
22. Li, Y.Z. and R. Šturm, Determination of Creep Properties from Small Punch Test.
Proceedings of the ASME Pressure Vessels and Piping Conference, 2009. Vol 3: p. 741-752.
23. Dobeš, F. and K. Milička, Application of Creep Small Punch Testing in Assessment of Creep Lifetime. Materials Science and Engineering: A: Properties, Microstructure and Processing, 2009. 510(11): p. 440-443.
24. Kobayashi, K.I., I. Kajihara, H. Koyama, and G.C. Stratford, Deformation and Fracture Mode During Small Punch Creep Tests. Journal of Solid Mechanics and Materials Engineering, 2010. 4(1): p. 75-86.
25. Ma, Y.W., S. Shim, and K.B. Yoon, Assessment of Power Law Creep Constants of Gr91 Steel Using Small Punch Creep Tests. Fatigue & Fracture of Engineering Materials & Structures, 2009. 32(12): p. 951-960.
26. Dymáček, P. and K. Milička, Creep small-punch testing and its numerical simulations. Materials Science and Engineering: A, 2009. 510–511: p. 444-449. 27. Ling, X., Y. Zheng, Y. You, and Y. Chen, Creep Damage in Small Punch Creep
Specimens of Type 304 Stainless Steel. International Journal of Pressure Vessels and Piping, 2006. 84(5): p. 304-309.
28. Zhou, Z., Y. Zheng, X. Ling, R. Hu, and J. Zhou, A Study on Influence Factors of Small Punch Creep Test by Experimental Investigation and Finite Element Analysis.
Materials Science and Engineering: A, 2010. 527(10–11): p. 2784-2789.
37
30. Li, Y. and R. Šturm, Determination of Creep Properties from Small Punch Test, in
ASME 2008 pressure vessels and piping conference, ASME, Editor. 2008: Chicago, Illinois, USA. p. 739-750.
31. ABAQUS Theory Manual. Hibbitt, Karlsson & Sorensen, Inc., 1998. Version 5.8. 32. Blagoeva, D.T. and R.C. Hurst, Application of the CEN (European Committee for
Standardization) small punch creep testing code of practice to a representative repair welded P91 pipe. Materials Science and Engineering: A, 2009. 510–511: p. 219-223. 33. Crocker, L.E., A.T. Fry, and J. Banks, An Extended Small Punch Test Method for
Providing Measured Displacements across a Test Specimen, in National Physical Laboratory. Hampton Road, Teddington, Middlesex, TW11 0LW, UK.
34. Dymáček, P., S. Seitl, K. Milička, and F. Dobeš, Influence of Friction on Stress and Strain Distributions in Small Punch Creep Test Models. Key Engineering Materials, 2010. 417-418: p. 561-564.
35. Ashby, M., H. Shercliff, and D. Cebon, Materials Engineering, Science, Processing and Design, ed. Butterworth-Heinemann. 2014, Oxford, UK.
36. Penny, R.K. and D.L. Marriot, Design for Creep, ed. C. Hall. 1995, London, UK. 37. Wilshire, B. and M. Willis, Mechanism of Strain Accumulation and Damage
Developmant During Creep of Prestrained 316 Stainless Steel. Metaallurgical and Materials Transactions A, 2004. 35(2): p. 563-571.
38. Liu, Y. and S. Murakami, Damage Localization of Conventional Creep Damage Models and Proposition of a New Model for Creep Damage Analysis. JSME International Journal Series A, 1998. 41(1): p. 57-65.
39. Kraus, H., Creep Analysis, ed. I. John Wiley & Sons. 1980, New York, NY, (USA). 40. Saad, A.A., T.H. Hyde, W. Sun, C.J. Hyde, and D.W.J. Tanner, Characterization of
viscoplasticity behaviour of P91 and P92 power plant steels. International Journal of Pressure Vessels and Piping, 2013. 111–112: p. 246-252.
![Table 2. Material constants for a P91 steel at 650 °C, with stress (MPa) and time (h) [29]](https://thumb-us.123doks.com/thumbv2/123dok_us/8597491.371902/15.595.67.529.641.677/table-material-constants-p-steel-stress-mpa-time.webp)

![Figure 10. SEM images from ref. [2] for a small punch creep test, for a P91 steel at 600 °C with a load of 25 kg, interrupted after (a) 2 hours (](https://thumb-us.123doks.com/thumbv2/123dok_us/8597491.371902/21.595.86.517.68.240/figure-images-interrupted-hours-hours.webp)