Grey seal pup mortality is not explained by local breeding density on the island colony of North Rona, Scotland.
Twiss S.D.1, Duck, C.2 & Pomeroy P.P.2
1: Spatial Ecology Group, School of Biological and Biomedical Sciences, Durham University, South Road, Durham, DH1 3LE, UK.
2: Sea Mammal Research Unit (SMRU), Gatty Marine Laboratory, University of St. Andrews, Scotland, KY16 8LB.
Corresponding author: Dr Sean Twiss, Spatial Ecology Group,
School of Biological and Biomedical Sciences, Durham University,
South Road,
Durham, DH1 3LE, UK.
Tel: 0191 374 8030 Fax: 0191 374 2417
E-mail: S.D.Twiss@durham.ac.uk
Abstract
Pre-weaning pup mortality in a UK grey seal breeding colony (North Rona) was examined in relation to the local adult female density over two breeding seasons. Accurate, fine scale maps of daily seal locations within a GIS database permitted the extraction of measures of female density determined at a range of spatial scales from 5m to 50m around each pup on the date of death. Adult densities around live pups provided the null distribution of adult densities which were tested against the distribution of densities where deaths occurred. Pre-weaning pup mortality at this colony was not related to any of our density measures. The proportion of pups dying each day showed no seasonal trends. Analysis of topographic features from a sub-metre Digital Terrain Model for locations where deaths occurred suggested that there were fewer mortalities in prime pupping habitats. This could have been a direct effect of habitat or the relative quality of mothers in these habitats. The distance separating mothers and pups tended to be greater on the periphery of the colony compared to more central areas. Pups in the peripheral areas may be more exposed to predation by gulls.
INTRODUCTION
Many species aggregate to breed. Advantages of group breeding include reduced risk from predation and an increased ability to detect and to exploit resources, including mates (Sutherland, 1996). However, these advantages are often traded against costs, such as increased risks of mortality, arising from density dependent processes of depletion, interference and predation (Sutherland, 1996). Density dependent mortality has been shown to occur in a wide range of vertebrates during their temporary breeding aggregations (reviewed by Sinclair, 1989), largely due to limitations on the availability of space or food. Much of this density dependent mortality impacts on juveniles (Sutherland, 1996).
Density dependent pup mortality has been suggested for some pinniped species at some breeding colonies (Arctocephalus gazella: Doidge, Croxall & Baker, 1984; Arctocephalus australis: Majluf, 1992; Harcourt, 1992; Mirounga angustirostris: Riedman, 1990; Mirounga leonina: Baldi et al., 1996). However, comparisons of overall levels of mortality between different breeding colonies with measures of breeding density derived from colony-wide counts of animals do not consider an individual’s environment at the specific location and time of its death (i.e. within a
spatial and temporal scale at which the actions of conspecifics are likely to impact directly on an individual). Few studies have examined variation in mortality within a colony in relation to adult density and habitat variation measured at this ‘local’
weather may depend upon the interaction of weather with local topographic features. Although weather parameters can easily be observed and measured at larger scales, they are experienced by individuals at local scales. Many other potential causes of individual deaths, particularly those associated with conspecifics (Baker, 1988; Baker & Baker, 1988) certainly operate at the scale of the individual and not the colony. Therefore, it is important to examine pup mortality with regard to these local scale measures. Similarly, as breeding densities often vary through a breeding season, it is necessary to assess local density at the time of death in order to ascertain if density is a potential cause of pup mortality.
Grey seals in Scottish waters aggregate to breed during each autumn, often on remote islands, such as North Rona. Individual females spend 18-20 days ashore, during which time they each bear and suckle one pup, come into oestrus towards the end of lactation and are mated. Of all the pups produced in a year, approximately 95% are born during a six week period (Harwood et al., 1991; Hiby et al., 1996). Hence, there is a turnover of females during the breeding season. At North Rona females generally remain with their pup throughout lactation (median daily movement of mothers is 10m from pupping location). Females aggregate around preferred habitat features (pools of water) (Twiss et al., 2000a; Twiss, Thomas & Pomeroy, 2001), with variation in density related to habitat suitability (Twiss et al., 2001). Males compete to maintain positions on the colony in areas that hold high densities of females (Anderson and Fedak, 1985; Twiss, 1991; Twiss, Anderson & Monaghan, 1998). Sex ratios on North Rona are typically in the order of 1male to seven females (Anderson and Fedak, 1985; Twiss et al.,1998).
Here, we are able to investigate the occurrence of pre-weaning pup deaths within the grey seal breeding colony of North Rona using fine scale accurate mapping of pup and adult daily locations within a Geographical Information System (GIS). We use these data to test the null hypothesis that pup deaths are not related to measures of local adult female density. By linking these location data to a sub-meter accurate Digital Terrain Model (DTM) of the colony we also test the null hypothesis that levels of pup mortality are not related to local topography.
Study site
The grey seal colony on the Scottish island of North Rona (59 06' N, 05 50' W) was established prior to the 1880s and has been the subject of studies of reproductive behaviour for 40 years (Boyd & Laws, 1962; Pomeroy et al., 1999). The main seal breeding area is on the low lying northern peninsula (Fianuis), measuring 1.0x0.3 km. Our study area encompasses the southern portion of this peninsula covering 185000m2. The duration of the study period in both the 1997 and 1998 breeding seasons extended from the onset of breeding at North Rona to past the time of maximum number of adults ashore (see Fig. 1a and b).
Mapping of seal locations
During the 1997 and 1998 breeding seasons the daily locations of all seals within the North Rona study area were mapped precisely on detailed fine grain, geo-referenced maps of the breeding colony. Maps incorporating detailed habitat features and a 10x10m grid were derived from digitised geo-rectified high resolution aerial photographs (Twiss et al., 2000a, 2000b, 2001). Every seal was identified by sex and age and individual identities where known, with all pups being classified into either age categories ‘I’ to ‘V’ (based on the well established descriptive age classes of Boyd et
al., 1962) or as dead pups. All these daily maps and classifications were digitised into an ARC-INFO GIS database (Twiss et al., 2000 a, 2000b, 2001).
GIS data extraction
coverage. Most dead pups remain on the North Rona breeding colony for a considerable period (see results). Therefore, in our data-set successive daily maps contained repeat records of the same dead pup. These repeat records of dead pups formed readily distinguishable clusters of locations within our composite GIS coverage of dead pups (dead pups did move marginally; artefactually through minor mapping errors, but also in reality through the actions of other seals and in particular scavenging gulls). Hence, for each cluster we selected the location with the earliest date, and used this as our representative location for the mortality and the date on which it was first recorded as its day of death. These selected ‘first’ occurrences of
Estimation of the percentage pup mortality
The total number of first occurrences of dead pups provides a count of the number of dead pups over each season within our study site. To convert this to a percentage of the total number of pups born in the study area, we extracted from our coverages of pup locations the number of pups of stage I to IV (stage V pups are fully moulted and usually weaned pups). We plotted the daily number of these pups and computed the area under this graph (the sum of daily numbers i.e. total number of pup-days) for each season. This sum was then divided by 18, the average duration from birth to weaning. To this resulting value we added the number of dead pups to provide an estimate of the total number of pups born in the study area. From this we generated an overall estimate for the seasonal percentage of mortality.
Temporal sequence of mortalities
The seasonal change in the rate of mortalities was examined with respect to both the numbers of adult females and the numbers of all pups on a daily basis.
Local adult female density and pup mortality
In order to test whether mortalities tended to occur more often than expected in areas of higher adult densities it was necessary to provide null distributions of the ‘available’ adult densities on the colony. Using a similar GIS based process to that
described above, we extracted the densities of females (for each of the 5m to 50m radii) around every live pup’s location on every day for each season. Inevitably, the
probability density functions for our null distributions by repeating 10000 bootstrapping procedures in which we resampled with replacement 1% of these records. This process was repeated for each spatial scale and for year of the two breeding seasons. Seals do not utilise all the area mapped within our GIS but prefer specific habitat features (Twiss et al., 2000a, 2001). Therefore, the use of live pup locations to sample adult densities provided a more appropriate measure of the available densities than would be achieved by random locations taken throughout the study area which would inevitably include samples from parts of the colony devoid of seals.
For each season and each sampling radii of adult female density we compared the distributions of adult densities around mortalities with the corresponding distribution derived from our bootstrapping of densities around live pups. Comparisons were made by Kolmogorov-Smirnov 2 sample tests.
Habitat and mortality
A sub-meter accurate DTM of the study area (Mills, Newton & Twiss, 1997; Twiss et al., 2000a, 2000b, 2001) provides accurate descriptions of the physical habitat for any location. These topographic measures include;
(1) elevation above mean sea level (m) (2) Slope (degrees)
(3) "Cost distance" to "nearest" pool of water,
The cost–distance variables provide an index for each location of the relative ease of moving over an irregular terrain from that location to the nearest pool or access point, though nearest is defined as the easiest to get to (least cost). Large physical features, such as cliffs present impenetrable barriers to movement in these models, requiring circumnavigation and hence longer routes and higher costs. Differing slopes also present differing costs to movement. These models provide an accurate representation of the relative ease of locomotion across the colony, and have been used to demonstrate seals’ preferences for breeding close to access points and / or
close to pools of water (see Twiss et al., 2000a, 2000b, 2001 for further details of cost-distance modeling procedures).
Each of these variables was selected for the 2m grid square in which each dead pup was found. Null distributions of ‘available’ habitat were generated in the same
fashion as for the adult densities above; using 10000 bootstrapping procedures resampling with replacement 1% of the habitat values associated with live pup locations. We then compared the distribution of habitat variables for dead and live pups.
Female-pup proximity relative to position in the colony
distance between every pup on each day and their nearest adult females using GIS proximity functions (Twiss et al., 2000a). We compared these distances between pup and nearest female for categories of cost-distance to access (divided into bins of 50 units in an index ranging from 0 to 300) using Kruskall-Wallis tests. A similar analysis was conducted to examine the pup to nearest female distances in relation to cost-distance to pools of water (divided into bins of five units in an index ranging from 0 to 35).
RESULTS
Persistence of corpses on the colony
Dead pups on North Rona remained visible, and were therefore mapped, for an
average of 9.0 1.0 consecutive days in 1997 and 10.2 1.2 days in 1998. However, many of the dead pups (32% in 1997 and 35% in 1998) remained visible up to and including our last observation date, therefore, the above values represent underestimates of the true persistence of corpses on the colony.
Estimates of the percentage pup mortality
Estimated pup mortality rates were 14.6% (52/357) in 1997 and 14.4% (51/354) in 1998.
Temporal sequence of mortalities
represented as both the total number of corpses recorded on each date (which approximates to cumulative deaths) and as the number of deaths (first occurrences of dead pups) per day (daily mortality rate). Note that the numbers of corpses and deaths have been exaggerated by a factor of ten for clarity in these figures. Table 1 presents the correlations of these two daily measures of mortality with date during the breeding season, the total number of adult females present per day and thirdly, the total number of pups present per day. The total number of corpses recorded on each date correlates highly with both the number of females and the number of pups present (as the number of corpses is a cumulative measure, no correlation was attempted with date). However, significant positive correlations also existed between the daily mortality rate and either date, the number of females and the number of pups per day. Conversely, when the daily mortality rate is expressed as a percentage of the total number of pups present per day then no significant correlations remained.
Local adult female density and pup mortality
Habitat and mortality
Our analysis of the nature of the topography at locations where deaths occurred compared to the null distribution of topographies at live pup locations provided inconsistent results between years. In the 1998 season there were no significant differences at p < 0.01 between the topography at dead and live pup locations (Table 3). However, in 1997, the frequency distributions of both elevation and cost distance to access differed for dead and live pups (Table 3). Examination of the cumulative frequency distributions of elevation values for dead and live pups (Fig. 3) indicated that dead pups occurred more frequently than live pups at the lowest elevations and less frequently at intermediate elevations (approximately 10-25m). In terms of cost-distance to access (Fig. 4), dead pups occurred more frequently in the immediate vicinity of access points (low cost-distance indices) and less frequently than live pups at moderate indices for cost-distance to access (indices of approximately 60 to 100).
Female-pup proximity relative to position in the colony
The distances separating pups and their nearest adult female tended to (i) increase
with distance from access points (Kruskall-Wallis tests: 1997 2 = 98.7, d.f. = 5, p <
0.001, 1998 2 = 53.2, d.f. = 5, p < 0.001) and (ii) increase with distance from pools
of water (Kruskall-Wallis tests: 1997 2 = 142, d.f. = 6, p < 0.001, 1998 2 = 47.6, d.f.
= 6, p < 0.001).
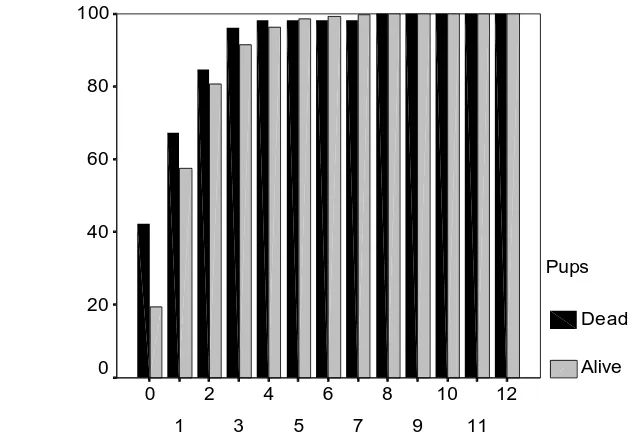
Contrary to earlier studies which examined pup mortality rates in relation to colony wide measures of pup production (Boyd et al., 1962; Boyd & Campbell, 1971; Coulson & Hickling, 1964; Summers et al., 1975), our fine scale analyses failed to demonstrate any evidence that pre-weaning pup mortality increased with adult densities at this breeding colony. The densities in which mortalities occurred encompassed the full range of available adult densities on the colony. The occurrence of pup deaths was not related to local density of adult females irrespective of the scale at which local density was measured with the exception of our smallest scale of analysis. At this 5m scale our analysis again revealed no indication of mortality increasing with local density. In fact, dead pups were found more frequently in locations with no adult females within 5m.
Our analyses were repeated at a range of scales that extended from the pup’s
of elephant seals (Riedman, 1990; Baldi et al., 1996) and of many otariid species (Harcourt, 1992; Riedman, 1990) in which pup mortality is density dependent. Even amongst the most dense aggregations, female grey seals maintain a distance of approximately 1.5 body lengths between themselves and their neighbours (Twiss et al., 2000a). Our results suggest that local adult densities on the day of death do not directly cause pup deaths. It is possible that more complex, compound effects of local density on a number of days preceding death may provide a link between adult density and death. Abandoned or starveling pups may wander from natal sites. Our finding that dead pups tended to occur more frequently in locations where no potential mothers were found within 5m radii may reflect either this, or that mothers leave a dead pup (although mothers have been observed maintaining close contact with dead pups for a number of days, pers. obs. PPP, SDT). A further consideration is the effect of adult males. Whilst densities of males, given the skewed sex ratio, are very low compared to adult females, it is possible that pup moralities, or at least injuries that subsequently lead to death, result as a by-product of male-male aggression. It is clearly necessary to quantify these parameters, and future studies should endeavour to; (a) track pup locations in relation to local density prior to death, (b) quantify the movements of live pups once they have been abandoned, (c) quantify maternal attendance, in terms of proximity to pups, in relation to local density (d) quantify local male densities and more importantly the frequency and intensity of inter-male aggression with respect to location.
stated that daily ground counts would incur too much disturbance (Summers et al., 1975 provided daily mortality rates at weekly intervals). Here, we provide such data, on a daily basis, with no disturbance, and demonstrate that daily mortality rates are proportional to the number of pups present in any day.
might expect more inter-annual variation in mortality rates). If such energetic considerations are responsible for underlying mortality rates, then it is possible that this might mask more subtle density-dependent effects. Subsequent studies of local density effects on mortality should endeavour to control for maternal condition.
Density dependent mortality in breeding aggregations may be absent where advantages accrue to centrally located individuals and yet central locations attract the highest densities of individuals (Sutherland, 1996). Competition for desirable central, high density locations may lead to occupancy of these prime sites by higher quality individuals. These individuals may then offset the potential density dependent effects by their better parental qualities and through their enhanced location. Amongst grey seals, female pupping site preferences in relation to variation in habitat quality at UK grey seal breeding colonies (Pomeroy, Twiss & Duck, 2000; Twiss et al., 2000a, 2001) has been linked with differences in female quality (Pomeroy et al., 1999, 2001). Therefore, individual quality could confound density dependent effects in grey seal colonies such as North Rona.
that local topography can determine the level of behavioural investment in pups by mothers. Pomeroy et al. (2001) extended this idea and provided evidence of high pup growth rates and potentially increased genetic success for mothers occupying these prime habitats. The result presented here from the 1997 season indicate an apparent reduction in the number of dead pups occurring at these same intermediate elevations and cost-distance to access indices (Fig. 4). Thus, reduced pup mortality in prime habitats may to be a direct consequence of habitat quality. However, since these patterns were not observed in both the breeding season examined here, it is perhaps more likely to be effected indirectly via the increased quality of animals occupying these sites. Linking long-term studies of individual females with habitat, local density and detailed behavioural observation should enable the causal direction of this relationship to be determined.
Whilst the pattern of pup mortalities on North Rona are not related to local variation in adult female density, our results suggest a possible role for both habitat and maternal quality in reducing pup deaths. These results have implications for studies of both the behavioural ecology of grey seals and also for applied models of population growth that require estimates of pup mortality on breeding colonies. Our results also illustrate the importance of examining individual based processes at the appropriate spatial scale.
Acknowledgements
This work was funded by NERC through a postdoctoral fellowship and fellowship extension to SDT, and under NERC's Core strategic programme conducted by PPP. We are extremely grateful to Simon Moss for his untiring support in the field. Thanks also for helpful comments on the manuscript from the editor and two anonymous referees.
REFERENCES
Anderson, S. S. & Fedak, M. A. (1985). Grey seal males: energetic and behavioural links between size and sexual success. Anim. Behav. 33: 829-838.
Baker, J. R. & Baker, R. (1988). Effects of environment on grey seal (Halichoerus grypus) pup mortality. Studies on the Isle of May. J. Zool. (Lond.) 216:529-537.
Baldi, R., Campagna, C., Pedraza, S. & Le Boeuf, B.J. (1996). Social effects of space availability on the breeding behaviour of elephant seals in Patagonia. Anim. Behav. 51: 717-724.
Bartholomew, G. A. (1970). A model for the evolution of Pinniped polygyny. Evolution 24: 546-559.
Boyd, J. M., & R. M. Laws. (1962). Observations on the grey seal (Halichoerus grypus) at North Rona in 1960. Proc. Zool. Soc. Lond. 164: 469-512.
Boyd, J. M. & Campbell, N. (1971). The Grey seal (Halichoerus grypus) at North Rona, 1959 to 1968. J. Zool. (Lond.) 164: 469-512.
Boyd, J. M., Lockie, J. D. and Hewer, H. R. (1962). The breeding colony of Grey seals on North Rona, 1959. Proc. Zool. Soc. Lond. 138: 257-277.
Davies, J. L. (1949). Observations on the grey seal (Halichoerus grypus) at Ramsey Island, Pembrokeshire. Proc. Zool. Soc. Lond.119: 673-692.
Doidge, D. W., Croxall, J. P. & Baker, J. R. (1984) Density dependent pup mortality in the Antarctic fur-seal Arctocephalus gazella at South Georgia. J. Zool. (Lond.) 202: 449-460.
Harcourt R. (1992) Factors affecting early mortality in the South-American fur-seal (Arctocephalus australis) in Peru – Density related effects and predation. J. Zool. (Lond.) 226: 259-270.
Harwood, J., Hiby, L., Thompson, D. & Ward, A. (1991). Seal stocks in Great Britain. Surveys conducted between 1986 and 1989. NERC News, January:11-15.
Hiby, A. R., Duck, C. D., Thompson, D., Hall, A. J., & Harwood, J. (1996). Seal Stocks in Great Britain. NERC News, January: 20-22.
Majluf, P. (1992). Timing of births and juvenile mortality in the South-American fur-seal in Peru. J. Zool. (Lond.) 227: 367-383.
Pomeroy, P. P., Anderson, S. S., Twiss, S. D. & B. J. McConnell. (1994) Dispersion and site fidelity of breeding female grey seals (Halichoerus grypus) on North Rona, Scotland. J. Zool. (Lond.) 233,429-448.
Pomeroy, P. P., Fedak, M. A., Anderson, S. S., & Rothery, P (1999). Consequences of maternal size for reproductive expenditure and pupping success of grey seals at North Rona, Scotland. J. Anim. Ecol. 68: 235-253.
Pomeroy, P. P., Twiss, S. D. & Duck, C. D. (2000). Expansion of a grey seal (Halichoerus grypus) breeding colony: change in pupping site use at the Isle of May, Scotland. J. Zool. (Lond.) 250:1-12.
Pomeroy, P. P., Worthington Wilmer, J., Amos, W. & Twiss, S. D. (2001). Reproductive performance links to fine-scale spatial patterns of female grey seal relatedness. Proc R.Soc B. 268: 711-717.
Redman, P., Pomeroy, P. P. & Twiss,S. D. (in press). Should I stay or should I go? Locomotion of female grey seals (Halichoerus grypus) and the importance of pools. Can. J. Zool.
Riedman, M. (1990). The Pinnipeds - Seals, Sea lions and Walruses. University of California Press. Berkeley and Los Angeles, CA.
Summers, C. F., Burton, R. W. & Anderson, S. S. (1975). Grey seal (Halichoerus grypus) pup production at North Rona: A study of birth and survival statistics collected in 1972. J. Zool. (Lond.) 175: 439-451.
Sutherland, W. J. (1996). From individual behaviour to population ecology. Oxford University press, Oxford.
Twiss, S.D. (1991). Behavioural and energetic determinants of individual mating success in male grey seals (Halichoerus grypus, Fabricius 1791). Ph.D. Thesis, Glasgow University.
Twiss, S. D., Anderson, S.S. & Monaghan, P. (1998). Limited intra-specific variation in male grey seal (Halichoerus grypus) dominance relationships in relation to variation in male mating success and female availability. J. Zool. (Lond.) 246, 259-267.
Twiss, S. D., Caudron, A., Pomeroy, P. P., Thomas, C. J. & Mills, J. P. (2000a). Fine scale topographical correlates of behavioural investment in offspring by female grey seals, Halichoerus grypus. Anim. Behav. 59(2), 327-338.
Twiss, S. D., Thomas, C. J. & Pomeroy, P. P. (2001). Topographic spatial characterisation of grey seal Halichoerus grypus breeding habitat at a seal’s perceptual spatial grain. Ecography 24: 257-266.
Table 1: Spearman’s rank correlations (R) of date, daily number of adult females and
daily number of live pups with:(a) the number of corpses recorded per day (as the number of corpses is effectively a cumulative measure, no correlation was
attempted with date), (b) the number of deaths per day (daily mortality rate) and (c) daily mortality rate expressed as a percentage of total number of pups (live and dead) present per day. Significant (2-tailed) correlations are emphasised in bold.
(a) Number of corpses observed
per day (cumulative deaths)
(b) Number of deaths per day (daily mortality
rate)
(c) Daily mortality rate as a percentage
of the total number of pups present on
each day
1997 (n = 27)
1998 (n = 28)
1997 (n = 27)
1998 (n = 28)
1997 (n = 27)
1998 (n = 28)
Date
R p
- - 0.49
Table 2. Results of Kolmogorov- Smirnov (KS) tests of the frequency distribution of female densities around pup mortalities on the day of death compared against the null distribution from 10000 resamplings of adult densities around live pup locations. Analysis repeated using female densities determined for a range of radii around each pup location, from 50m to 5m. Sample sizes are 52 dead pups and 578144 live for 1997 and 51 dead and 578796 live in 1998. Significance difference at p < 0.01 are emphasised in bold.
Radius (m) around pups in which adult female density was determined
Year 50 45 40 35 30 25 20 15 10 5
1997 KS Z 1.23 1.31 1.23 1.08 1.31 1.03 0.78 0.57 0.93 1.64 P 0.10 0.06 0.1 0.19 0.07 0.24 0.57 0.91 0.35 0.009
Table 3: Results of Kolmogorov- Smirnov (KS) tests of the frequency distribution of four topographic variables derived from the locations provided by dead pups and from 10000 resamplings of live pup locations. Sample sizes are 52 dead pups and 578144 live for 1997 and 50 dead and 572974 live in 1998. Significance difference at p < 0.01 are emphasised in bold.
Topographic parameter
Year elevation slope Cost-distance to
access
Cost-distance to pool
1997 KS Z 1.67 1.28 1.79 0.84
P 0.008 0.08 0.003 0.49
1998 KS Z 0.72 1.59 0.82 1.51
Figure Legends:
Fig. 1a & b: Plots of the daily numbers of adults females, live pups, pup corpses (cumulative number of deaths) and pup deaths (daily mortality rate) within the North Rona study area during the (a) 1997 and (b) 1998 breeding seasons. *NB: Numbers of pup corpses and pup deaths have been multiplied by a factor of 10 to give a clearer graphical presentation of changes in relative number with date.
Fig. 2a & b: Cumulative frequency histograms of densities of adult females within 5m of dead pups and live pups during the (a) 1997 and (b) 1998 breeding seasons.
Fig. 3: Cumulative frequency histogram of the elevation values at locations where dead pups and live pups occurred during the 1997 breeding season.
Fig. 1a: Twiss, Duck & Pomeroy: Grey seal pup mortality.
Date (days from 1st January 1997)
300 295 290 285 280 275 270
N
u
m
b
e
r
o
f
in
d
ivi
d
u
a
ls*
500
400
300
200
100
0
Pup corpses
Pup deaths
Adult females
Fig. 1b: Twiss, Duck & Pomeroy: Grey seal pup mortality.
Date (days from 1st January 1998)
300 295 290 285 280 275 270
N
u
m
b
e
r
o
f
in
d
ivi
d
u
a
ls*
500
400
300
200
100
0
Pup corpses
Pup deaths
Adult females
Fig. 2a: Twiss, Duck & Pomeroy: Grey seal pup mortality.
Number of females within 5m of pup (1997)
Fig. 2b: Twiss, Duck & Pomeroy: Grey seal pup mortality.
Number of females within 5m of pup (1998)
11 10
9 8
7 6
5 4
3 2
1 0
C
u
m
u
la
ti
v
e
P
e
rce
n
t
100
80
60
40
20
0
Pups
Dead
Fig. 3: Twiss, Duck & Pomeroy: Grey seal pup mortality.
Elevation above mean sea level (m) (1997)
Fig. 4: Twiss, Duck & Pomeroy: Grey seal pup mortality.
Cost-distance to access index (1997)