1 | P a g e
Measuring alcohol consumption in population surveys: a review of
international guidelines and comparison with surveys in England
Manjula D. Nugawela1; Tessa Langley1; Lisa Szatkowski1; Sarah Lewis1 1
UK Centre for Tobacco and Alcohol Studies, Division of Epidemiology and Public Health, University of Nottingham, Clinical Sciences Building, Nottingham City Hospital, Nottingham, NG5 1PB, UK
Correspondence: Manjula D. Nugawela, UK Centre for Tobacco and Alcohol Studies,Division of Epidemiology and Public Health, University of Nottingham, Clinical Sciences Building, Nottingham City Hospital, Nottingham, NG5 1PB, UK, E-mail: mcxmdnug@nottingham.ac.uk
Sources of support: Manjula D. Nugawela is funded by the UK Centre for Tobacco and Alcohol
2 | P a g e
Abstract
Aims: To review the international guidelines and recommendations on survey instruments for
measurement of alcohol consumption in population surveys, and to examine how national surveys in England meet the core recommendations.
Methods: A systematic search for international guidelines for measuring alcohol consumption in
population surveys was undertaken. The common core recommendations for alcohol consumption measures and survey instruments were identified. Alcohol consumption questions in national surveys in England were compared with these recommendations for specific years and over time since 2000.
Results: Four sets of international guidelines and three core alcohol consumption measures (alcohol
consumption status, average volume of consumption, frequency and volume of binge drinking) with another optional measure (drinking context) were identified. English national surveys have been inconsistent over time in including questions that provide information on average volume of consumption but have not included questions on another essential alcohol consumption measure, frequency of heavy episodic drinking. Instead they have used questions that focus only on maximum volume of alcohol consumed on any day in the previous week.
Conclusions: International guidelines provide consistent recommendations for measuring alcohol
consumption in population surveys. These recommendations have not been consistently applied in English national surveys and this has contributed to the inadequacy of survey measurements for monitoring vital aspects of alcohol consumption in England over recent years.
3 | P a g e
Introduction
Monitoring alcohol consumption across a population is crucial to evaluating whether national policies and approaches are being effective in reducing alcohol-related harm (World Health Organization Regional Office for Europe, 2012, World Health Organization, 2014). Individual level alcohol consumption data obtained using general population surveys have advantages over other measures of alcohol use such as sales data. They measure not only the volume but also patterns of individual alcohol consumption (World Health Organization, 2000), and allow researchers to link alcohol drinking with related consequences as well as to adjust for individual-level characteristics (Dawson, 2003). Furthermore, individual-level data enable comparison of drinking patterns between population subgroups (World Health Organization, 2000). However, self-reported alcohol
consumption typically only accounts for 40-60% of total alcohol sales (Midanik, 1982, Bellis et al., 2009, Boniface and Shelton, 2013). This underestimation of self-reported alcohol consumption is likely to occur mainly due to sampling-frame issues (Shield and Rehm, 2012, Meier et al., 2013), non-response bias (Zhao et al., 2009, Maclennana et al., 2012, Meiklejohn et al., 2012, Gorman et al., 2014) and under-reporting bias (Stockwell et al., 2014, Boniface et al., 2014, Livingston and Callinan, 2015). For example, general population surveys normally include people living in private households, hence they do not take into account the alcohol consumption among homeless people, military personnel, people in care homes, university students living in halls of residence and prisoners, some of which groups are more likely to be involved in heavy drinking (Meier et al., 2013).
In addition to the above limitations, the survey instruments themselves and the framing of the questions is likely to influence the adequacy of survey measures of alcohol consumption (Rehm et al., 1999, Feunekes et al., 1999, Dawson, 2003, Heeb and Gmel, 2005, Greenfield and Kerr, 2008). Multiple guidelines for how drinking should be measured in surveys have been proposed, but whether they are consistent in their recommendations has not been considered to date.
4 | P a g e
According to the General Lifestyle Survey (GLF) in 2008, the survey underestimation of alcohol consumption was around 40% when compared with the sales data (Boniface and Shelton, 2013), and the difference between GLF measure and alcohol sales was equivalent to 430 million units a week (Bellis et al., 2009). In other words, a bottle of wine per adult (16 years and over) per week is unaccounted for due to survey underestimation (Bellis et al., 2009). Adjusting GLF survey data to account for several potential biases from the methodology of the surveys, such as under-sampling of dependent drinkers, increased the GLF’s annual per capita alcohol consumption estimate, but it still remained 22% lower than the estimate obtained from equivalent alcohol sales data(Meier et al., 2013). The issues with alcohol survey instruments in English surveys may have contributed towards this residual underestimation. It is important therefore to identify whether alcohol consumption measures from English surveys are based on the best available survey instruments. This study aims to identify and compare the recommendations on alcohol survey instruments from international guidelines, and to establish whether national surveys in England are adequately measuring the key aspects of alcohol consumption.
Methods
5 | P a g e
identified guidelines were also scrutinized in order to identify any other existing international guidelines.
We extracted data on alcohol consumption measures and recommended survey instrument or questions from each guideline, and the process used to establish them. When guidelines had both a minimum set of questions and a recommended set of questions for alcohol research, the
recommended set of questions was extracted. The analysis was limited to the recommendations on alcohol survey instruments that measure levels and patterns of alcohol consumption. Therefore the recommendations for measuring alcohol consequences or minimising other limitations of national surveys, such as sampling frame issues, under-reporting and non-response bias, were not included in the analysis.
We then looked for commonality between the guidelines in terms of recommended measures and survey instruments and described these common core recommendations. For
example, all four guidelines recommend measuring frequency and volume of heavy episodic drinking and using Graduated Quantity Frequency (GQF) questions as the survey instrument.
6 | P a g e
initial comparison; for the HSE this was 2013, for the GLF 2011 and for the Opinions and Lifestyle survey this was 2008/2009 (NatCen Social Research and University College London, 2013, Office for National Statistics, 2011b, Office for National Statistics, 2009). After 2009 the Opinions and Lifestyle Survey did not include alcohol consumption questions but in 2012 some of the GLF’s alcohol
consumption questions were transferred into it (Office for National Statistics, 2011a). We then assessed the consistency of the alcohol related questions in each survey over time, from the year 2000 onwards until its most recent survey.
Results
Guidelines for measuring alcohol consumption
Four sets of international guidelines that provide recommendations for measuring alcohol consumption in general population surveys were identified; the International Guide for Monitoring Alcohol Consumption and Related Harm by the WHO; Agreement on ways to measure alcohol consumption by the Kettil Bruun Society (KBS), an international organization of scientists engaged in research on alcohol use and alcohol problems; Recommended Alcohol Questions by the National Institute on Alcohol Abuse and Alcoholism (NIAAA); and Standardizing Measurement of Alcohol Related Troubles (SMART) Project Guidelines by the European Commission (Dawson and Room, 2000, World Health Organization, 2000, National Institute on Alcohol Abuse and Alcoholism, 2003, Moskalewicz and Sieroslawski, 2010).
In 2000, the WHO published the International Guide for Monitoring Alcohol Consumption and Related Harm aiming to provide guidance on epidemiological monitoring of alcohol
7 | P a g e
12 countries (Dawson and Room, 2000). This thematic conference used 26 research papers plus the WHO guidance document mentioned above to draw their conclusions.
In 2003, a task force of the National Institute on Alcohol Abuse and Alcoholism (NIAAA) developed four recommended sets of alcohol questions for surveys that can include only a limited number of alcohol questions (National Institute on Alcohol Abuse and Alcoholism, 2003). They developed these using the recent epidemiological studies at that time and the WHO guide.
The European Commission’s Standardised Measurement of Alcohol-Related Troubles (SMART) project published its guidance and recommended alcohol questions for European countries in 2010. This project developed standardized comparative survey methodologies on heavy drinking, binge drinking, context of drinking, alcohol dependence, and alcohol related problems as well as public support for alcohol policy measures for use in the European Union (EU)(Moskalewicz and Sieroslawski, 2010). The methodology, developed on the basis of a review of European survey experiences from over 20 countries as well as a literature review, was tested in 10 countries with different socio-cultural background and patterns of alcohol consumption.
8 | P a g e
measure how often alcohol was consumed and how much on each occasion whereas BSQF questions do the equivalent for different types of alcohol beverage separately. All guidelines recommend Graduated Quantity Frequency (GQF) questions to assess heavy episodic drinking. GQF questions start by asking for the highest level of consumption on any occasion during the past year and then, based on the answer, ask a series of follow-up questions on frequency of consuming lesser
quantities ( e.g. frequency of consuming more than 144g, 96g, 60g, 36g, or 24g) (Dawson and Room, 2000, World Health Organization, 2000, Moskalewicz and Sieroslawski, 2010).
In addition to the above questions on essential alcohol consumption measures, questions on drinking context were also recommended by all four guidelines. Commonly recommended drinking context questions ask whether participants drank with or without meal, alone or with others, and the place of drinking.
9 | P a g e
Table 1: Common core categories of alcohol consumption measures and the associated questions recommended by international guidelines (M: Minimum set of questions for surveys with limited resources)
Required Recommended WHO Guidelines in 2000 KBS Conference Guidelines in 2000 NIAAA Guidelines in 2003 EU Commission (SMART)
Measures Survey
Instrument Guidelines -2010
1) Alcohol Questions on Derived from the Question 1 below when Derived from the Question 1 below when Derived from the Question 1 below when Derived from the Question 1 below when Drinking status Abstention Respondents haven’t drunk in past year Respondents haven’t drunk in past year Respondents haven’t drunk in past year Respondents haven’t drunk in past year
(Past year Abstention - past 12 months Abstention - past 12 months Abstention - past 12 months Abstention - past 12 months
& Lifetime) - Abstention-lifetime Abstention-lifetime Abstention-lifetime Abstention-lifetime
CORE ITEM
2) Volume of Quantity 1. In the past year, how often did you drink 1. Overall frequency of drinking considering 1.During the last 12 months, how often did 1. How often did you drink beer, wine, spirits
alcohol Frequency any alcoholic beverage? (M) all types of alcoholic beverages (M) you usually have any kind of alcoholic drink ?
(M) or any other alcoholic drink in past 12 months ?
Consumption Questions - QF 2.How many drinks did you usually have on 2. Usual quantity of drinking, all alcoholic 2.During the last 12 months, how many ( Recommendations for usual quantity - (Past year) - (Past year) days you drank in the past year? (M) beverages together (M) alcoholic drinks did you have on a typical day not included )
CORE ITEM you drank alcohol ? (M)
Beverage Specific 3. After a filter question that determines 3.Beverage-specific frequencies of drinking 3. Beverage specific consumption 2. How often did you drink beer in the past year? Quantity & whether or not specific type of beverage was usual quantities of drinking, size of usual 3. How much did you drink on average on a
Frequency - BSQF consumed, ask for the largest as well as drink maximum quantity and Frequency when you drank beer over the past 12 months? (Past year ) usual quantity of drinks and size of the drink. Repeat Q2, 3 for wine, sprits & for another type
3) Frequency & Graduated 4. Counting all types of beverages combined, 4.Largest amount drunk in last 12 months, 4. Largest number of drinks containing alcohol Recommendations not included
Volume of Heavy Quantity what was the largest number of drinks that all beverages together ? you drank within 24 hours during the past
year?
Episodic Drinking Frequency you drank in a single day in the past year? 5. How often above amount was consumed? 5. How often above amount was consumed?
(Past Year)- Questions Repeat Q5 for lifetime
CORE ITEM Starting with 5. In the past year, how often did you drink 6.Frequency of consuming >60g ethanol or 6. During the last 12 months, how often did 4. How often in the past 12 months, have The largest five or more drinks of any alcoholic beverage if above , frequency of consuming>96g you have 5 or more (males) or 4 or more you had 6 drinks or more on one occasion ?
Number of or combination of beverages in a single day? (M) Ethanol in a single day ? (M) (females) drinks containing any kind of alcohol (Which is equivalent to 60 g of pure alcohol)
Drinks (Preferably should obtain from questions with (Preferably should obtain from questions in within a two hour period ? (M) 5. Repeat Q4 for 12 drinks (past year) Cut-off values of 12 +, 8-11, 5-7, 3-4, 1-2 drinks, with cut-offs: 24, 36, 60, 96, 144, and 240g (A drink is equivalent to 12g of pure alcohol)
a drink is equivalent to 12g of pure alcohol) of pure alcohol)
4) Drinking Questions on 6. During the past year where did you usually 7. Questions on whether the participant 7. Questions on drinking contexts 6. When you drink alcohol do you usually drink
Context Drinking Context drink ? *Had drinks with meals or not * With a meal or at some other time?
OPTIONAL ITEM 7. What proportion of time you spent in *Had drinks on a weekday / weekend (Specific questions not included) * Where? different locations *Had drinks alone or with others * With whom? 8. How often did you drink in above mentioned *Had drinks in public (bar/restaurants) or
10 | P a g e
Comparison of English Survey Questions with Guidelines
Comparison of the most recently available questionnaire with guidelines
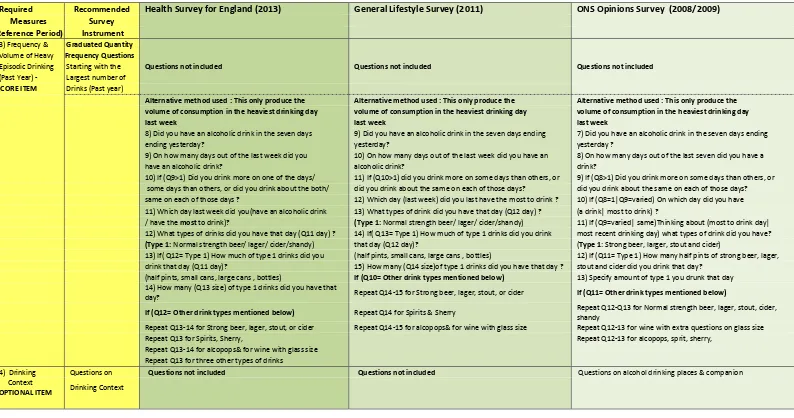
For all three surveys, the most recently available questionnaire with alcohol consumption- related questions covered only two essential alcohol consumption measures out of the three essential measures recommended by the international guidelines (Table 2). They are alcohol drinking status and average volume of alcohol consumption. English surveys addressed these two essential alcohol consumption measures precisely according to the international guidelines by using questions on abstention and Beverage Specific Quantity Frequency questions with the past year as the reference period.
English surveys did not include questions on the frequency of heavy episodic drinking, the other essential measure recommended by the international guidelines. They have used an alternative set of questions on binge drinking which focusses only on the volume of alcohol consumed on the heaviest drinking day of the last week. The guidelines, on the contrary,
recommend using GQF questions which measure not only the volume of binge drinking but also the frequency of binge drinking with the past year as the reference period.
In addition to the above questions on essential alcohol consumption measures, questions on drinking context were not addressed at all by either HSE or GLF. However, the Opinions and Lifestyle survey included some of the recommended items on drinking context such as questions on place of drinking.
Comparison of survey questions overtime from the year 2000 onwards
11 | P a g e
12 | P a g e
Table 2: Comparison of English survey questions with the common core categories of alcohol consumption measures recommended by international guidelines
Required Recommended Health Survey for England (2013) General Lifestyle Survey (2011) ONS Opinions Survey (2008/2009)
Measures Survey
(Reference
Period) Instrument
1) Alcohol Questions on 1) Do you ever drink alcohol nowadays, including drinks you 1) Do you ever drink alcohol nowadays, including drinks you 1) Do you ever drink alcohol nowadays, including drinks you Drinking Status Abstention brew or make at home? brew or make at home ? brew or make at home?
(Past year 2) If Q1=No, does that mean you never have an alcoholic 2) If Q1=No, does that mean you never have an alcoholic drink 2) If Q1=No, does that mean you never have an alcoholic drink & Lifetime) - Drink nowadays, or do you have an alcoholic drink very nowadays, or do you have an alcoholic drink very occasionally? nowadays, or do you have an alcoholic drink very occasionally?
CORE ITEM occasionally?
3) If Q2=Never, have you always been a non-drinker or did 3) If Q2=Never, have you always been a non-drinker or did you Questions not included you stop drinking for some reason? stop drinking for some reason?
2) Volume of Quantity 4) If Q1=Yes OR Q2= Very Occasionally, Thinking now about 4) If Q1=Yes OR Q2=Very occasionally, Would you say: hardly 3) Thinking now about all kinds of drinks how often have you alcohol Frequency all kinds of drinks how often have you had an alcoholic drink drink at all, drink a little, drink a moderate amount, drink quite had an alcoholic drink of any kind during the last 12 months? Consumption Questions - QF of any kind during the last 12 months? a lot, drink heavily
(Past year) - (Past year) 5) Thinking now about all kinds of drinks, how often have you
CORE ITEM had an alcoholic drink of any kind during the last 12 months?
Questions on usual quantity - not included Questions on usual quantity - not included Questions on usual quantity - not included
Beverage Specific IF Q1=Yes or Q2= Very Occasionally IF Q1=Yes or Q2= Very Occasionally IF Q1=Yes or Q2= Very Occasionally Quantity & Type 1: Normal strength beer, lager, stout, cider, shandy Type 1 :Normal Strength beer, lager, stout, cider or shandy Type 1: Strong beer, lager, stout, cider
Frequency - BSQF 5) How often have you had type 1 drink during thelast12 6) How often have you had a drink of type 1 during the last 4) How often have you had a type 1 during the last 12 months? (Past year ) months? 12 months? 5) How many half pints of type 1 have you usually drunk on 6) How much type 1 drink have you usually drunk on any one 7) How much type 1 drinks have you usually drunk on one any one day during the last 12 months?
day during the last 12 months? day during the last 12 months? 6) Specify amount of type 1,usually drunk on any day during the (half pint, small cans, large cans, bottles) (half-pints, small cans, large cans, bottles) last 12 months? (Specify no and type of units- if bottle or can 7) How many (Q6 size ) type 1 drink have you usually drunk 8)How many (size Q7) of type 1 drinks have you usually drunk - record size )
on any one day during the last 12 months? on any one day during last 12 months? Repeat above questions for other drink types
Repeat above questions for other drink types Repeat above questions for other drink types Repeat Q4-Q6 for Normal Strength beer, lager, stout, cider Repeat Q5-Q7 for Strong beer, lager, stout or cider Repeat Q6-Q8 for Strong beer, lager, stout or cider shandy and for (Sprit and Sherry with singles & glasses on Q12) Repeat Q5-Q6 for Sprits & Sherry Repeat Q6-Q7 for Sprits & Sherry Repeat Q4-Q6 for wine with extra questions on wine glass size Repeat Q5-Q6 for Wine with extra question on glass size Repeat Q6-Q7 for Wine with extra question on glass size Repeat Q4-Q6 for Alcopops and other drinks
Repeat Q5-Q7 for Alcopops Repeat Q6-Q8 for Alcopops
13 | P a g e
Table 2 Continued: Comparison of English survey questions with the common core categories of alcohol consumption measures recommended by international guidelines
Required Recommended Health Survey for England (2013) General Lifestyle Survey (2011) ONS Opinions Survey (2008/2009)
Measures Survey
(Reference Period) Instrument
3) Frequency & Graduated Quantity
Volume of Heavy Frequency Questions
Episodic Drinking Starting with the Questions not included Questions not included Questions not included
(Past Year) - Largest number of
CORE ITEM Drinks (Past year)
Alternative method used : This only produce the Alternative method used : This only produce the Alternative method used : This only produce the volume of consumption in the heaviest drinking day volume of consumption in the heaviest drinking day volume of consumption in the heaviest drinking day
last week last week last week
8) Did you have an alcoholic drink in the seven days 9) Did you have an alcoholic drink in the seven days ending 7) Did you have an alcoholic drink in the seven days ending
ending yesterday? yesterday? yesterday ?
9) On how many days out of the last week did you 10) On how many days out of the last week did you have an 8) On how many days out of the last seven did you have a
have an alcoholic drink? alcoholic drink? drink?
10) If (Q9>1) Did you drink more on one of the days/ 11) If (Q10>1) did you drink more on some days than others, or 9) If (Q8>1) Did you drink more on some days than others, or some days than others, or did you drink about the both/ did you drink about the same on each of those days? did you drink about the same on each of those days? same on each of those days ? 12) Which day (last week) did you last have the most to drink ? 10) If (Q8=1|Q9=varied) On which day did you have 11) Which day last week did you(have an alcoholic drink 13) What types of drink did you have that day (Q12 day) ? (a drink| most to drink) ?
/ have the most to drink)? (Type 1: Normal strength beer/ lager/ cider/shandy) 11) If (Q9=varied| same)Thinking about (most to drink day| 12) What types of drinks did you have that day (Q11 day) ? 14) If( Q13= Type 1) How much of type 1 drinks did you drink most recent drinking day) what types of drink did you have? (Type 1: Normal strength beer/ lager/ cider/shandy) that day (Q12 day)? (Type 1: Strong beer, larger, stout and cider)
13) If( Q12= Type 1) How much of type 1 drinks did you (half pints, small cans, large cans , bottles) 12) If (Q11= Type 1) How many half pints of strong beer, lager, drink that day (Q11 day)? 15) How many (Q14 size)of type 1 drinks did you have that day ? stout and cider did you drink that day?
(half pints, small cans, large cans , bottles) If (Q10= Other drink types mentioned below) 13) Specify amount of type 1 you drunk that day 14) How many (Q13 size) of type 1 drinks did you have that
day? Repeat Q14-15 for Strong beer, lager, stout, or cider If (Q11= Other drink types mentioned below)
If (Q12= Other drink types mentioned below) Repeat Q14 for Spirits & Sherry Repeat Q12-Q13 for Normal strength beer, lager, stout, cider, shandy
Repeat Q13-14 for Strong beer, lager, stout, or cider Repeat Q14-15 for alcopops& for wine with glass size Repeat Q12-13 for wine with extra questions on glass size
Repeat Q13 for Spirits, Sherry, Repeat Q12-13 for alcopops, sprit, sherry,
Repeat Q13-14 for alcopops& for wine with glass size
Repeat Q13 for three other types of drinks
4) Drinking Questions on Questions not included Questions not included Questions on alcohol drinking places & companion Context
OPTIONAL ITEM Drinking Context
14 | P a g e
Discussion
Alcohol consumption data from national surveys are essential for epidemiological and public health research purposes, and existing international guidelines are broadly consistent in their recommendations for how alcohol consumption should be measured in these surveys. Alcohol consumption status, average volume alcohol consumption, and frequency and volume of binge drinking are the essential alcohol consumption measures recommended by all four guidelines with another recommended item on drinking context for surveys that can include a large number of questions. English national surveys have collected data only on two core items, as they did not include questions on the frequency of binge drinking. The alternative method they have used, which focusses on volume of alcohol drunk in the heaviest drinking day of the last week, is likely to underestimate the scale of heavy drinking in England. The inclusion of beverage specific questions, the only source of information in English surveys for measuring volume of average alcohol consumption, has been inconsistent over time.
15 | P a g e
16 | P a g e
Heavy episodic drinking, extreme drinking or binge drinking refers to a drinking pattern of consuming an intensive volume of alcohol over a short period of time that is likely to lead to intoxication and acute consequences (World Health Organization, 2014, World Health
17 | P a g e
cannot be used for most epidemiological research purposes. A review of data from Scotland’s routine national surveys has also reported similar findings on binge drinking measures based on the shorter reference period of last week (Catto, 2008).
An individual’s average volume of alcohol consumption is the other most important
indicator used in alcohol epidemiology as it has a causal impact on chronic diseases such as cancers, diabetes mellitus, depressive disorder and liver cirrhosis (Rehm et al., 2003, Rehm et al., 2010). Despite its importance, the BSQF questions that provide the information on average volume of consumption in English surveys, have been inconsistently included over time so that this core measure is also unavailable for some years. This has resulted in gaps in time series data on average volume of consumption and limits the potential of these data for formal time series analysis to identify trends in consumption and evaluate policy interventions.
According to the international guidelines, total alcohol consumption from surveys should be calculated by aggregating the average volume of consumption and consumption due to binge drinking occasions (World Health Organization, 2000, Moskalewicz and Sieroslawski, 2010). This adjustment has also proven to improve prevalence estimates for heavy drinking, since respondents do not normally include heavy drinking occasions in estimates of their average consumption (Mandy Stahre, 2006). Therefore, using the average volume of alcohol consumption generated by BSQF questions on its own can contribute towards the survey underestimation of alcohol consumption in England when comparing with sales data.
18 | P a g e
alcohol consumption in England, HSE is currently the only survey which continues to measure alcohol consumption annually. However, HSE is also limited by inconsistent inclusion of questions on essential alcohol consumption measures and its small sample size when compared with GLF. Some of the limitations of England’s major national surveys in measuring alcohol consumption may be addressed by more recent additions to the spectrum of surveys in this country. The Alcohol Toolkit Study (ATS) includes all essential alcohol consumption indicators including the frequency of binge drinking in a large nationally-representative sample of adults in England (Beard et al., 2015). This study uses the Alcohol Use Disorders Identification Test (AUDIT) to measure alcohol consumption, which includes the minimum recommended number of alcohol questions but not the detailed survey instruments shown in Table 1. Alcohol Policy Interventions in Scotland and England (APISE), which is the other recent study, represents England and Scotland’s arm of the International Alcohol Control study (Casswell et al., 2012); it covers all essential alcohol consumption measures, but uses a small sample size of 3725 adults split evenly between England and Scotland (Sheffield Alcohol Research Group, 2015). Both these studies are bounded by limited funding available only for a few years (Gateway to Research-Research Councils UK, 2015, Beard et al., 2015).
Therefore, future surveys should aim to use methodologies which reduce their inherent biases, but should also strive to retain consistency of core indicators of alcohol epidemiology that are essential for monitoring public health and evaluating alcohol control policies and other
interventions. It is important that this includes a measure of the frequency of binge drinking. Ideally the recommended survey instruments on all core alcohol consumption indicators should be included in the newer Integrated Household Survey, which is carried out quarterly and has a much larger sample size than HSE(Office for National Statistics, 2012a). Including more detailed alcohol questions on drinking context would be helpful in identifying the associations between drinking and its
19 | P a g e
consequences. Ensuring that measurement of alcohol consumption in all countries adheres to the guidelines would not only provide more reliable estimates for each country to evaluate its own level of public health risk and effectiveness of national policy, but also improve the global and regional comparability of data on alcohol use and health consequences in order to improve monitoring and to facilitate research, risk assessment and advocacy.
Acknowledgements
This work was supported by the UK Centre for Tobacco and Alcohol Studies (UKCTAS), a UKCRC Public Health Research: Centre of Excellence.
21 | P a g e
References:
Beard E, Brown J, West R, Acton C, Brennan A, Drummond C, Hickman M, Holmes J, Kaner E, Lock K, Walmsley M, Michie S (2015). Protocol for a national monthly survey of alcohol use in England with 6-month follow-up: ‘The Alcohol Toolkit Study’. BMC Public Health, 15. Bellis MA, Hughes K, Cook PA, Morleo M (2009). Off Measure: How we underestimate the amount
we drink. Alcohol Concern
Boniface S, Kneale J, Shelton N (2014). Drinking pattern is more strongly associated with under-reporting of alcohol consumption than socio-demographic factors: evidence from a mixed-methods study. BMC Public Health, 14.
Boniface S, Shelton N (2013). How is alcohol consumption affected if we account for under-reporting? A hypothetical scenario. Eur. J. Public Health, 23, 1076-1081.
Casswell S, Huckle T, Pledger M (2002). Survey Data Need Not Underestimate Alcohol Consumption. Alcohol. Clin. Exp. Res., 26, 1561-1567.
Casswell S, Meier P, MacKintosh AM, Brown A, Hastings G, Thamarangsi T, Chaiyasong S (2012). The International Alcohol Control (IAC) Study— Evaluating the Impact of Alcohol Policies. Alcohol. Clin. Exp. Res., 36, 1462-1467.
Catto S (2008). How much are people in Scotland really drinking? A review of data from Scotland’s routine national surveys. Public Health Observatory Division, Health Scotland
Dawson DA (2003). Methodological Issues in Measuring Alcohol Use. Alcohol Res Health, 27, 18-29. Dawson DA, Room R (2000). Towards agreement on ways to measure and report drinking patterns
and alcohol-related problems in adult general population surveys: the SkarpoÈ Conference overview. J. Subst. Abuse, 12, 1-21.
Feunekes GIJ, Veer Pvt, Staveren WAv, Kok FJ (1999). Alcohol Intake Assessment: The Sober Facts. Am. J. Epidemiol., 150, 105-112.
Gateway to Research-Research Councils UK. (2015). Alcohol Policy Interventions in Scotland and England: APISE [Online]. Available: http://gtr.rcuk.ac.uk/project/9D0BCFB9-621E-4606-96D2-53A2C1EACC5B# (Accessed 20 May 2015)
Goddard E (2007). Estimating alcohol consumption from survey data: updated method of converting volumes to units. Office for National Statistics.
Gorman E, Leyland AH, McCartney G, White IR, Katikireddi SV, Rutherford L, Graham L, Gray L (2014). Assessing the Representativeness of Population-Sampled Health Surveys Through Linkage to Administrative Data on Alcohol-Related Outcomes. Am. J. Epidemiol., 180, 941-948.
Greenfield TK, Kerr WC (2008). Alcohol measurement methodology in epidemiology: recent advances and opportunities. Addiction, 103, 1082-1099.
Health & Social Care Information Centre (2014). Statistics on Alcohol: England-2014.
Heeb J-L, Gmel G (2005). Measuring alcohol consumption: A comparison of graduated frequency, quantity frequency, and weekly recall diary methods in a general population survey. Addictive Behaviours, 30, 403-413.
HM Government (2007). Safe. Sensible. Social. The next steps in the National Alcohol Strategy. Department of Health, Home Office,Department for Education and Skills,Department for Culture, Media and Sport,.
22 | P a g e
Maclennana B, Kypri K, Langley J, Room R (2012). Non-response bias in a community survey of drinking, alcohol-related experiences and public opinion on alcohol policy. Drug Alcohol Depend., 126, 189-194.
Mandy Stahre TN, Robert Brewer & James Holt (2006). Measuring average alcohol consumption: the impact of including binge drinks in quantity–frequency calculations. Addiction, 101, 1711-1718.
Meier PS, Meng Y, Holmes J, Baumberg B, Purshouse R, Hill-McManus D, Brennan A (2013). Adjusting for Unrecorded Consumption in Survey and per Capita Sales Data: Quantification of Impact on Gender- and Age-specific Alcohol-attributable Fractions for Oral and
Pharyngeal Cancers in Great Britain. Alcohol Alcohol., 48, 241-249.
Meiklejohn J, Connor J, Kypri K (2012). The Effect of Low Survey Response Rates on Estimates of Alcohol Consumption in a General Population Survey. PLoS One, 7.
Midanik L (1982). The Validity of Self-Reported Alcohol Consumption and Alcohol Problems: A Literature Review. Addiction, 77, 357-382.
Moskalewicz J, Sieroslawski J (2010). Drinking Population Surveys-Guidance Document For Standardized Approach. . European Commission Health,Consumer Protection Directorate General
NatCen Social Research and University College London. (2013). Health Survey for England, Series [Online]. Department of Epidemiology and Public Health, Colchester, Essex: UK Data Archive. Available: http://discover.ukdataservice.ac.uk/series/?sn=2000021 (Accessed 20 May 2015) National Institute on Alcohol Abuse and Alcoholism. (2003). Recommended Alcohol Questions
[Online]. Available: http://www.niaaa.nih.gov/research/guidelines-and-resources/recommended-alcohol-questions (Accessed 20 May 2015)
Office for National Statistics. (2009). Opinions and Lifestyle Survey, Series [Online]. Social Survey Division, Colchester, Essex: UK Data Archive. Available:
http://discover.ukdataservice.ac.uk/series/?sn=2000043 (Accessed 20 May 2015) Office for National Statistics (2011a). The Future of the General Lifestyle Survey - Update on
proposed changes
Office for National Statistics. (2011b). General Lifestyle Survey, Series [Online]. Social and Vital Statistics Division, Colchester, Essex: UK Data Archive. Available:
http://discover.ukdataservice.ac.uk/series/?sn=200019 (Accessed 20 May 2015)
Office for National Statistics (2012a). IHS User Guide Volume 1: Background and Methodology 2012. Office for National Statistics (2012b). Information paper- Quality and Methodology Information -
General Lifestyle Survey.
Office for National Statistics (2012c). Information paper- Quality and Methodology Informtion- Opinions and Lifestyle Survey.
Office for National Statistics (2013a). Chapter 2 - Drinking (General Lifestyle Survey Overview - a report on the 2011 General Lifestyle Survey).
Office for National Statistics (2013b). Drinking Habits Among Adults-2012.
Parlimentary Office of Science and Technology. (2005). postnote: Binge Drinking and Public Health Number 244. Available: http://www.parliament.uk/documents/post/postpn244.pdf [Accessed 20 May 2015].
Rehm J, Baliunas D, Borges GLG, Graham K, Irving H (2010). The relation between different
dimensions of alcohol consumption and burden of disease: an overview. Addiction, 105, 817-843.
Rehm J, Greenfield TK, Walsh G, Xie X, Robson L, Single E (1999). Assessment methods for alcohol consumption, prevalence of high risk drinking and harm: a sensitivity analysis. Int. J. Epidemiol., 28, 219-224.
23 | P a g e
Robinson S, Harris H (2009). Smoking and drinking among adults, 2009 : A report on the 2009 General Lifestyle Survey Office for National Statistics.
Rossow I (1996). Alcohol related violence: the impact of drinking pattern and drinking context Addiction, 91, 1651-1661.
Sheffield Alcohol Research Group. (2015). APISE (Alcohol Policy Interventions in Scotland and England) project [Online]. The University of Sheffield. Available:
http://www.shef.ac.uk/scharr/sections/ph/research/alpol/research/apise (Accessed 20 May 2015)
Shield KD, Rehm J (2012). Difficulties with telephone-based surveys on alcohol consumption in high-income countries: the Canadian example. Int. J. Methods Psychiatr. Res., 21, 17-28.
Stockwell T, Zhao J, Chikritzhs T, Greenfield TK (2008). What did you drink yesterday? Public health relevance of a recent recall method used in the 2004 Australian National Drug Strategy Household Survey. Addiction, 103, 919-928.
Stockwell T, Zhao J, Macdonald S (2014). Who under-reports their alcohol consumption in telephone surveys and by how much? An application of the ‘yesterday method’ in a national Canadian substance use survey. Addiction, 109, 1657-1666.
Trevisan M, Schisterman E, Mennotti A, Farchi G, Conti S (2001). Drinking Pattern and Mortality: The Italian Risk Factor and Life Expectancy Pooling Project. Ann. Epidemiol., 11, 312-319.
Wells S, Graham K (2003). Aggression involving alcohol: relationship to drinking patterns and social context. Addiction, 98, 33-42.
World Health Organization. Lexicon of alcohol and drug terms published by the World Health Organization [Online]. Available:
http://www.who.int/substance_abuse/terminology/who_lexicon/en/ (Accessed 20 May 2015 )
World Health Organization (2000). International Guide for Monitoring Alcohol Consumption and Related Harm
World Health Organization (2014). Indicator Code Book, Global Information System on Alcohol and Health.
World Health Organization Regional Office for Europe (2012). European action plan to reduce the harmful use of alcohol (2012–2020).