Detection of the Delayed Condensation Effect and Determination of its
Impact on the Accuracy of Gas Adsorption Pore Size Distributions
Sean P. Rigbya,*, Muayad Hasana, Iain Hitchcockb, Robin S. Fletcherc
a
Department of Chemical and Environmental Engineering, University of Nottingham, University Park, Nottingham NG7 2RD, U.K.
bJohnson Matthey Technology Centre, Blount’s Court, Sonning Common, Reading, RG4
9NH, U.K.
c
Johnson Matthey Process Technologies, P.O. Box 1, Belasis Avenue, Billingham, Cleveland, TS23 1LB, U.K.
* To whom correspondence should be addressed. Email:
ABSTRACT
Macroscopic, highly disordered, mesoporous materials present a continuing challenge for accurate pore structure characterization. The typical macroscopic variation in local average pore space descriptors means that methods capable of delivering statistically representative characterizations are required. Gas adsorption is a representative but indirect method, normally requiring assumptions about the correct model for data analysis. In this work we present a novel method to both expand the range, and obtain greater accuracy, for the information obtained from the main boundary adsorption isotherms by using a combination of data obtained for two adsorptives, namely nitrogen and argon, both before and after mercury porosimetry. The method makes use of the fact that nitrogen and argon apparently ‘see’ a different pore geometry following mercury entrapment, with argon, relatively, ‘ignoring’ new metal surfaces produced by mercury porosimetry. The new method permits the study of network and pore-pore co-operative effects during adsorption that substantially affect the accuracy of the characteristic parameters, such as modal pore size, obtained for disordered materials. These effects have been explicitly quantified, for a typical sol-gel silica catalyst support material as a case study. The technique allowed the large discrepancies between modal pore sizes obtained from standard gas adsorption and mercury
thermoporometry methods to be attributed to the network-based delayed condensation effect, rather than spinodal adsorption. Once the network-based delayed condensation effect had been accounted for, the simple cylindrical pore model and macroscopic thermodynamic Kelvin-Cohan equation were then found sufficient to accurately describe adsorption in the material studied, rather than needing a more complex microscopic theory. Hence, for disordered mesoporous solids, a proper account of inter-pore interactions is more important than that of intra-pore adsorbate density distribution, to obtain accurate pore size
distributions.
1. INTRODUCTION
Gas adsorption is still an extremely common method used to obtain pore size distributions (PSD) for disordered porous solids. The typical PSD obtained is a probability density function for pore size weighted by volume. A similar descriptor can be obtained using
mercury porosimetry. This descriptor is used to understand the performance of such materials as heterogeneous catalyst pellets, adsorbents, chromatographic media, and many other
applications. While the gas adsorption and mercury porosimetry methods are indirect, unique pore size distributions can be obtained for some materials using particular techniques for the simultaneous inversion of mercury intrusion and nitrogen sorption curves [1].
In addition, many recent workers [2,3] have attempted to use a range of tomographic methods to more directly study the void space. Methods such as electron tomography and dual beam scanning electron microscopy can obtain nanometre-resolution images of the void space, and thus image the nanoporous materials that can also be probed by gas adsorption. However, the imaging methods can only obtain images for samples of sizes of ~500 nm at nanometre resolution, and, thus, it must be assumed that the volume sampled is representative of the pellet as a whole. While it is sometimes found that the characteristic size, of the particular volume of sample imaged, exceeds the correlation length of the local void space, combined mercury porosimetry and computerised X-ray tomography (CXT) studies [4] have also shown that many disordered materials are macroscopically heterogeneous, as well as microscopically heterogeneous. Combined CXT and mercury porosimetry allowed the macroscopic length-scale spatial variation in the penetration of nanopores by mercury up to a particular pressure to be monitored. The pore structures of many disordered materials may be such that local regions with statistically-similar properties may only exist over length-scales up to ~100 m, at the most, but other similarly-sized regions may exist elsewhere within the pellet with very different characteristic properties. This means that it is, in principle,
necessary to image the whole macroscopic pellet (typically of length-scales >mm) to obtain information representative of the whole network of (typically) ~1014 pores within the pellet. However, this is currently physically impossible with current imaging and computer
much quicker and cheaper to obtain by gas adsorption, than by imaging, and thus are still popular in industry. There is thus still a need for accurate gas adsorption data.
However, research on the fundamental physical processes involved in gas adsorption in complex pore geometries has revealed the existence of certain effects that reduce the accuracy of PSDs thus obtained. These effects are known as advanced [5] and delayed [6] filling (or condensation, or adsorption). These particular effects are pore-pore co-operative in nature, and thus the size of the effects is associated with the random inter-connectivity of pores of various different sizes within disordered solids, and, thence, studies of the more regular structures possessed by templated materials does not help to elucidate the actual extent of these problems in a given disordered material. The basic underlying principle of advanced condensation can be best understood in the context of a model through ‘ink-bottle’ pore. If the pressure for condensation, via a cylindrical sleeve meniscus, in the empty necks of the ink-bottle exceeds the pressure for condensation, via a hemispherical meniscus in the body, then all pore segments will fill at once because condensation in the necks creates hemispherical menisci at the ends of the body. Delayed condensation occurs when the pore potential in a given pore is reduced, below that for a void of the same geometry but with completely solid walls, due to side-arms branching off that pore leaving gaps in the walls.
The potential impact of the co-operative phenomena on PSD accuracy has been demonstrated by computer simulation of adsorption in pore network models [7]. Matadamas et al. [7] have simulated the effects of delayed and advanced adsorption in pore body-pore neck network models with a range of pore connectivities, and overlaps between pore body and neck size distributions. They compared the actual pore space characteristics of the underlying models with those obtained, by standard analysis methods, from the simulated isotherms, and showed that delayed condensation gave rise to a significant error in the accuracy of the PSD derived.
these pores. Previous work with this technique has demonstrated the existence of advanced adsorption of nitrogen in disordered silica gel materials [5], but has not studied delayed condensation. More recently the integrated gas sorption and mercury porosimetry technique has shown that there is a difference in the wetting of solid mercury relative to silica for nitrogen and argon adsorbates at their boiling points [8]. It was found that nitrogen will readily wet solid mercury surfaces, while argon, relatively, does not very much. As will be described in more detail below, in this work, this newly found effect will be used to demonstrate the presence of delayed condensation in gas adsorption in a typical catalyst support pellet as a case study. The mercury porosimetry data also available from the integrated experiment allows alternative interpretations of the gas sorption data to be
discounted, and a definitive interpretation to be obtained. In order to determine the impact of the delayed condensation on PSD accuracy the pore sizes will also be measured
independently using mercury thermoporometry, and also 1H NMR cryoporometry.
2. METHOD
2.1 Material
The material studied in this work is a sol-gel silica sphere denoted Q1. The specific surface area is 24020 m2
g-1. The specific pore volume is 0.5 ml g-1.
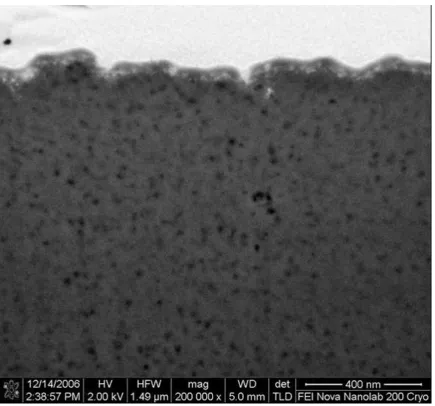
2.2 Electron microscopy
Electron microscopy experiments on samples from batch Q1 were performed using a FEI Nova Nanolab 200 Cryo apparatus. Images were taken with the In lens detector in BSE detection mode at 2 kV.
2.3 Integrated gas sorption and mercury porosimetry
min-1 and held at temperature for 16 hours under a vacuum of better than 1×10⁻³ mmHg (0.13 Pa). After the heat treatment the sample tube was removed from the ASAP 2020 (seal frit attached) to calculate the dry sample mass. A Micromeritics patented isothermal jacket was then placed around the sample tube and it was reattached to the ASAP 2020. The gas sorption experiment was fully automated and the relative pressures studied were between 0.004 0.995. The equilibration time used in these studies was tested and found to be 5 s.
Following the gas sorption experiment the sample tube was allowed to reach ambient temperature (~293 K), and the sample was then transferred to a Micromeritics mercury penetrometer. The transfer took place in a small glove box, which was under a dry nitrogen atmosphere. This minimised any adsorption of water from the atmosphere onto the sample when the transfer between sample tubes took place. A mercury porosimetry experiment was then performed using a Micromeritics Auto-pore IV 9450 apparatus. The sample was first evacuated to 6.7 Pa to remove physisorbed water that had adsorbed onto the sample when it was transferred from the gas sorption apparatus. When the system was at vacuum, mercury was allowed to enter the penetrometer and then the pressure was increased toward ambient. A fully automated mercury porosimetry experiment was then studied from ambient pressure to 414 MPa using a standard 15 s equilibration time between pressure steps.
Following the mercury porosimetry experiment the sample (and mercury) was transferred to a fume cupboard and placed in a crucible. Using tweezers the sample was removed from the mercury and transferred back into the Micromeritics gas sorption tube. The gas sorption tube was reattached to the Micromeritics ASAP 2020 and a filled liquid nitrogen Dewar was raised around the tube to cool the system to 77 K. This set up was left for 60 minutes to ensure all the mercury inside the sample became frozen, before the system was then evacuated to start the next nitrogen sorption experiment. If the mercury was not frozen, a potential hazard would be introduced, as the vacuum pump used to evacuate the sample at the beginning of the gas sorption experiment was vented into the laboratory. Further, the freezing of the mercury ensures it remains within the pores in which it became entrapped. Once the mercury was frozen the nitrogen gas sorption experiment was repeated.
not being affected by contamination with surface films of atmospheric moisture that could have arisen during sample transfer between the two sets of apparatus in the integrated experiment.
For the integrated argon sorption and mercury porosimetry experiments, the argon isotherms on the sample before and after mercury intrusion were measured on a Micromeritics 3500 3Flex fitted with a Cold Edge Cryostat to cool the sample to 87 K. Mercury Intrusion Porosimetry was carried out using a Micromeritics AutoPore 9520.
Prior to the first isotherm (pre mercury intrusion), the sample was heated to 90 °C at 10 °C min-1 whilst applying a vacuum. Once 90 °C was reached the sample was held at temperature for 1 hour under vacuum, and then heated to 350 °C at 10 °C min-1 and held at temperature for 16 hours under a vacuum of better than 1×10⁻³ mmHg. After out-gassing, the sample (still under vacuum), was cooled to 87 K using the cryostat. Once thermal equilibrium was reached argon sorption isotherms were obtained with an equilibration time of 10 seconds.
Once the isotherm was complete, the sample was warmed to ambient temperature and the tube backfilled with nitrogen. The sample was then transferred to a mercury porosimeter sample cell (penetrometer) and a full intrusion/extrusion porogram obtained. The intrusion curve was measured over the pressure range of 0.003 MPa to 413.7MPa and the extrusion from 413.7MPa to 0.103MPa, using an equilibration time of 15 seconds. Immediately following the mercury porosimetry experiment, the sample was discharged, and all the sample particles recovered and placed into a physisorption tube. The sample was then cooled to 87 K and left for 60 minutes to ensure all mercury entrapped within the sample had frozen solid, and thermal equilibration had been reached, prior to evacuating the sample in
preparation for a second argon isotherm measurement. It is important to discharge the sample from the mercury porosimeter as soon as the analysis has finished, and to cool as quickly as possible. After 60 minutes cooling the sample was evacuated until a pressure of less than 0.133 Pa.
2.4 Mercury thermoporometry
Mercury porosimetry was used to prepare the samples used in the thermporometry
stated here. The sample with entrapped mercury was initially frozen in the DSC cell to the temperature of -80 ○C, and then kept at this temperature for 30 minutes to ensure temperature homogeneity. The melting curves were measured over the temperature range from -80 ○C to -37 ○C at low scanning rate, 0.5 ○C min-1. Preliminary studies established this rate was the most appropriate. The DSC has the capability to measure heat flow rates with a resolution of ±0.5µW and an accuracy of ±2µW.
2.5 NMR cryoporometry
Experiments were conducted on a Bruker Avance III 600 MHz spectrometer. For the cryoporometry melting curve experiments, the confined water was super-cooled to 250 K, and the sample was warmed up in steps of 0.3 K per 10 minutes. The NMR spectrum was taken at each temperature following equilibration. The echo time was chosen such that no signal was obtained when the sample was fully frozen
3. THEORY
3.1 Mercury porosimetry
In general, mercury porosimetry data is analysed using the Washburn Equation [10]. However, previous work [11] suggests that both the surface tension and contact angle vary with the radius of curvature of the meniscus, and that the contact angle depends upon whether the meniscus is advancing or receding. More recently [12,13] correlations for the term coshave been obtained that take into account these effects. These correlations have
been determined by calibrating the pressure p at which mercury invades into, or retreats from, a model porous medium with a regular structure (e,g, controlled pore glass) against an
independent measure of pore size r, such as electron microscopy [14]). Combination of these correlations for .cos with the Washburn Equation gives rise to expressions of the form:
p
pB
A
A
r
2
2
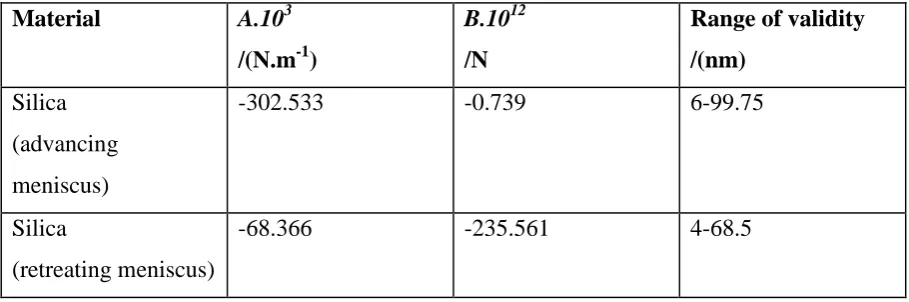
where A and B are constants depending on the material, and whether the mercury meniscus is advancing or retreating. The values of A and B for silica are given in Table 1. The
expressions of the form of Eq. (1) are empirical in origin, and are, therefore, of limited range of applicability (see Table 1), and also contain experimental error (~4-5 %) [14]. In previous work [15], it has been found that the silica materials for which it is appropriate to use the particular parameters given in Table 1 in eq. (1) to analyse the mercury porosimetry data have similar degrees of surface roughness (as measured by surface fractal dimension – see below) to the CPGs ultimately used to do the calibration. The contact angle hysteresis is not entirely removed by the parameters in Table 1 for silica materials with fractal dimensions
[image:9.595.66.521.331.482.2]substantially above 2.200.05. However, it has been found that the parameters in Table 1 are valid for intrusion in a wide range of materials with different surface chemistry [13].
Table 1. Parameters for use in Equation (1).
Material A.103
/(N.m-1)
B.1012
/N
Range of validity /(nm)
Silica (advancing meniscus)
-302.533 -0.739 6-99.75
Silica
(retreating meniscus)
-68.366 -235.561 4-68.5
3.2 Thermoporometry and cryoporometry
Thermoporometry is based on the effect that when a fluid is confined to a pore, the freezing and melting points of that fluid is changed. Generally, the change in the phase transition point for a small crystal, relative to the bulk, varies inversely with crystal size [16]. When a crystal is melting within a cylindrical pore the relevant form of the Gibbs-Thompson equation suggests the melting point depression Tm will be given by:
, (2)
where Tm(x) is the melting point in a pore of diameter x, is the bulk melting temperature,
is the contact angle (typically assumed to be 180○ for liquid-solid). This equation is often simplified to the form:
Tm = k/x , (3)
where k is known as the Gibbs-Thompson constant. In previous work [9], it has been found that for melting of a mercury crystal via a hemispherical meniscus, the value of k is 90 nm K. Hence, pore sizes can be determined by the temperature at which a solid crystal melts, and the volume of such pores can be obtained from the heat flow, due to latent heat of fusion, on melting.
The same basic physical effect of melting point depression for fluids imbibed in porous media is also the basis of NMR cryoporometry [16]. However, in NMR cryoporometry the volume of pores is obtained by observing the increase in NMR signal strength for liquid phase as the crystal melts. In a liquid-state NMR machine, the solid and liquid phases can be distinguished by large differences in the NMR spin-spin relaxation time.
3.3 Fractal analysis of surfaces
The analysis method used to derive the surface fractal dimension, d, from gas adsorption data was the fractal version of the BET theory. The derivation [17,18] of a fractal BET equation is based upon the fact that, for a fractal surface, the area available for adsorption in the ith layer of adsorptive, Ai, decreases by a factor fi, given by:
1 1
i
A
A
f
i i , (4)where = 3 - d, from that (A1) which is available for the adsorption of the initial monolayer.
behaviour, for the earlier equation, in the case of a surface fractal dimension of 3. The isotherm equation derived by Mahnke and Mögel [18] is given by:
0
0 0
0
/ (3 )log1 /
/ / 1 / log log log
0 d P P
P P C P P P P C V
VP P m
(5)
where V is the volume adsorbed, Vm the monolayer volume, C the fractal BET constant, P/P0
the relative pressure and d the fractal dimension. Equation 5 was fitted between relative pressure 0.05-0.6 for all isotherms before and after mercury porosimetry. This pressure range includes the typical range of validity of the standard BET equation (~0.05 to ~0.35) but is expanded at the high pressure end to include more of the multilayer adsorption region where the fractal-dependent behaviour becomes more apparent, while avoiding the capillary
condensation region for which the BET theory is not appropriate.
For surfaces with even greater degrees of (both chemical and geometric) heterogeneity, the surface may be thought to consist of a random patchwork where the values of the BET constant and/or fractal dimension may take one of two very different values, one high and one low. This approach is known as a homotattic patch model of a surface [19], where it is assumed that the patches are large, such that edge effects are small, and adsorption behaviour in each patch is independent of that in surrounding patches. For a homotattic patch variant [19] on the original BET model the overall isotherm is thus a composite of two BET-type equations, one for each of the two types of surface patch, that are each weighted by the fraction of the total surface area they occupy:
0 2 2 0 1 1 0 01
1
1
1
1
1
C
P
P
C
.
P
P
C
C
.
P
P
P
P
V
V
m
(6)C1and C2 are the BET constants for surface patches of type 1 and 2, respectively, and is the
3.4 Integrated experiments and surface wetting effects
In previous work [8] it was found that, while the surface fractal dimension obtained from the adsorption isotherm declined following mercury entrapment in a mesoporous silica when nitrogen was used as the adsorbate, there was no such significant change in fractal dimension when argon was used as the adsorbate. It was suggested that this effect occurred because nitrogen wetted the smooth mercury metal surface significantly more than argon. Hence, when mercury entrapment created free metal surfaces, the nitrogen multi-layer readily extended over these surfaces, but the adsorption of the argon multi-layer remained relatively more localised upon the silica surface for relative pressures in the usual multi-layer range. Since the mercury surface was flat, but the silica surface was rough, then the addition of mercury surfaces would be expected to decrease the apparent surface fractal dimension measure of overall roughness provided by nitrogen multi-layer adsorption. This is just what was observed for nitrogen and argon adsorption for sol-gel silicas in previous work [8].
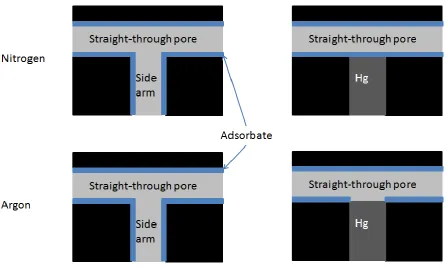
This difference in wetting of mercury by nitrogen and argon can also be used to detect delayed condensation effects. The way this would work is illustrated schematically for a simple T-junction model pore system in Figure 1. The straight-through branch of a T-junction can be thought of as an open cylindrical pore with a hole in the side wall. The presence of this hole in the wall leads to a decline in the pore potential in the straight-through pore at this position. Hence, the attractive force for adsorbate is reduced at this point, and a higher pressure can, thus, be anticipated to be required to achieve condensation. However, if just the side-arm of the T-junction were filled with entrapped mercury, then the pore wall of the straight-through section would now be complete as long as the chemical heterogeneity in the wall surface did not matter and the adsorbate wetted the mercury patch as well as it did the rest of the pore surface. Configurations of mercury equivalent to the entrapment of mercury in the side-arm of the T-junction in Figure 1 have been observed in experiments on
micromodels etched in glass [20]. If the adsorbate did not wet mercury then the patch would be effectively ‘invisible’ to the adsorbate, and the pore would still behave as if the mercury were not there. Hence, it would be expected that filling the side-arm with mercury would remove delayed condensation for an adsorbate that wets the mercury patch but not otherwise.
mercury from pore bond networks, including rules for vacating intersections, using
[image:13.595.80.528.237.511.2]simulations, and compared their data with the experimental results of Wardlaw and McKellar [20]. The simulations showed that the mercury retraction mechanism that best matched the experimental results led to configurations of mercury that left side arms, branching off through pores, full of mercury as envisaged above.
Figure 1. Schematic diagram of the difference in wetting of a model T-junction before and after mercury entrapment in the side-arm for different adsorbates.
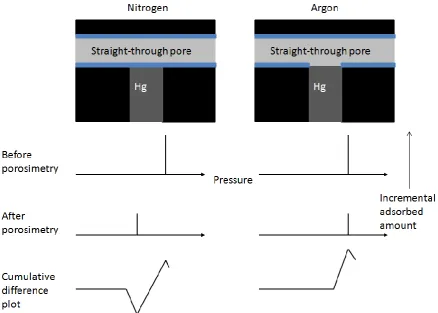
condensation is occurring. It can be seen that the lack of wetting of mercury by an adsorbate would mean the lack of the negative peak at lower relative pressures in the plots. The
reasoning behind this prediction is as follows. When the side-arm is empty the required condensation pressure is higher in the through-pore relative to what it would be if the wall was complete. Hence, once the hole in the pore wall is patched with mercury, if the adsorbate is wetting, the condensation pressure in the through-section will shift to lower pressure. The gain in incremental adsorption at low pressure after entrapment would give rise to the
[image:14.595.79.518.432.745.2]negative peak in the cumulative difference plot. In contrast, if the adsorbate is not so wetting of mercury, then the patch will be effectively invisible and there would be no shift in the condensation pressure in the through-pore following entrapment, and thus no negative peak in the cumulative difference plot. In both cases, a positive peak would be observed at higher pressures in the cumulative difference plots because available pore volume filling at higher pressure is lost for all adsorbates due to mercury entrapment.
Further experiments on mercury retraction from model pore bond networks suggest other configurations of entrapped mercury might also lead to removal of advanced condensation. Mercury retracting from pore intersections in bond networks, such as that shown
[image:15.595.66.526.430.654.2]schematically in Figure 3(a), has been found to adopt meniscus configurations, such as that shown in Figure 3(b), such that the pore intersection itself is left virtually empty of mercury, while some branches leading off it remain full of mercury [22,23]. Hence, a ‘+’ shaped intersection is converted into an ‘L’ shaped pore. The empty spaces in the walls, where pores branch off from the intersection, would mean that it would be a location with a low pore potential for condensing adsorbate. However, once two of the pore branches were filled with entrapped mercury, the remaining void space would be more like a pore with a continuous wall, albeit now with a bend. Other mercury configurations, that have been observed to occur at intersections [22], tend to just lead to dead-end pores, and the effects of these on gas sorption are considered below.
Figure 3. (a) Schematic depiction of an empty, ‘+’ shaped intersection in a model pore bond network (shown in white), and (b) following partial retraction and subsequent entrapment of mercury (shown in black).
gain in adsorption at lower pressure, as with the nitrogen data in the scenario outlined above. However, in this second case, argon would also be expected to give a similarly-sized negative peak at lower pressure, even if its wetting properties are different to nitrogen. Hence, the lack of a negative argon peak signifies a different scenario is occurring, as described above.
The integrated mercury porosimetry data enables a further alternative interpretation of the gas adsorption data to be discounted. The forms of the cumulative difference plots for nitrogen and argon in Figure 2 are also consistent with adsorption in a dead-end ink-bottle pore in which mercury becomes entrapped in the pore body and completely fills it. In that case, in the empty sample, the adsorption process would be controlled by condensation according to a cylindrical-sleeve meniscus (or adsorption spinodal) in the pore neck, which would be followed by advanced condensation in the pore body at the same pressure, provided that the body size is less than twice that of the neck (according to the Cohan equations [24]).
However, following entrapment, since nitrogen wets the mercury, the pore-neck would be converted into a dead-end pore and condensation would occur according to a hemi-spherical meniscus, and thus at a lower pressure. This would lead to the prominent negative peak in the cumulative difference plot. In contrast, since argon does not wet the mercury, the pore neck still seems like a through-pore and the condensation pressure is unaffected, and only a positive peak occurs in the cumulative difference plot due to the loss of accessibility to the pore body. However, if this scenario were occurring it would be expected that both the different methods of characterisation of the pore neck size, namely gas adsorption and mercury intrusion, would give the same value (within experimental error), as permitted by a properly calibrated mercury intrusion equation. Hence, the method permits the dead-end ink-bottle scenario to be discounted if this does not occur, and, thence, the delayed condensation scenario to be validated. A similar reasoning would apply to other potential scenarios for entrapment-induced dead-end pores.
4. RESULTS
4.1 Microscopy
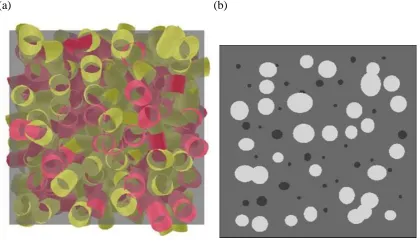
pores was constructed using software developed in previous work [25], and is shown in Figure 5. The software was used to create a virtual section through the network mimicking the process used to obtain the image of the real material in Figure 4. It can be seen that the overall spatial pattern and ovoid forms of the pore elements revealed in the EM image for the real material are highly similar to those seen in the virtual section. Hence, the comparison now made possible with the simulation software suggests that the void space geometry of pellets from batch Q1 could reasonably be represented as a random pore bond network. For a macroscopically heterogeneous, disordered solid, like Q1, the sampling of pore sizes possible via (even several such) images with a small field of view, such as in Figure 4, is insufficient to be statistically representative of a single pellet of Q1, let alone a packed bed of pellets.
Figure 5. (a)View of a random, cylindrical pore-bond network model with 512 nodes and 1726 cylindrical pores. (b) View of simulated random planar section through network in (a). The discrete black and white ovoids correspond to small and large pores, respectively, and the continuous grey matrix corresponds to solid.
(a) (b)
4.2 Integrated gas sorption and mercury porosimetry
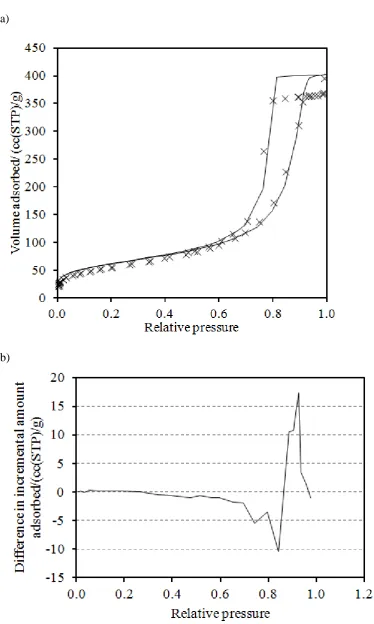
Figure 6 shows the nitrogen gas sorption isotherms for a typical sample from batch Q1 for before and after mercury entrapment. It can be seen that the top of the isotherms is
Figure 6. (a) Nitrogen sorption isotherms for a sample from batch Q1 obtained at 77 K for before (solid line) and after (×) entrapment of mercury in integrated experiment. (b) Plot of difference in incremental amount adsorbed at particular relative pressures obtained by subtracting the isotherm obtained after porosimetry from that obtained beforehand.
(a)
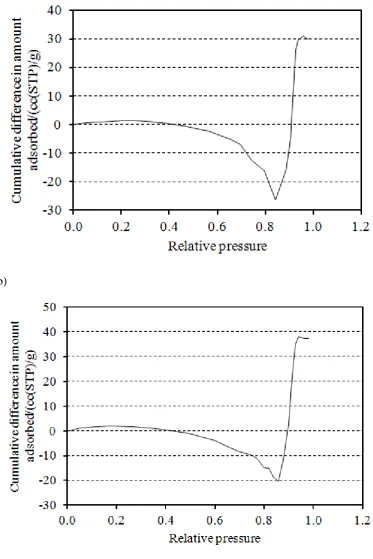
Figure 7 shows a typical example of a set of argon sorption isotherms for Q1 from before and after mercury entrapment. Figure 8 shows the cumulative difference in amount adsorbed plots for adsorption of nitrogen and argon on typical samples from batch Q1. Data from two
different samples are shown for each adsorbate to demonstrate the size of the inter-sample variability within the batch. It can be seen that the plots for nitrogen, for both samples, show a very pronounced negative peak at lower pressure in the capillary condensation region of the isotherm, followed by an even stronger positive deviation at higher pressure. In contrast, the plots for argon show very little negative deviation at low pressure, before the stronger
[image:20.595.89.476.399.689.2]positive deviation at high pressure. The negative deviation at low pressure is very much more marked for nitrogen than for argon For nitrogen, the negative deviations at lower relative pressure typically extend down to ~-20-30 cc(STP)g-1, whereas, for argon, the cumulative difference plot even remains positive for some samples.
Figure 8. Cumulative difference in amount adsorbed plots for adsorption of nitrogen (a&b) and argon (c&d) on typical samples from batch Q1.
(a)
(c)
The multi-layer regions (~0.05<P/P0<~0.6) of the gas adsorption isotherms were fitted to the
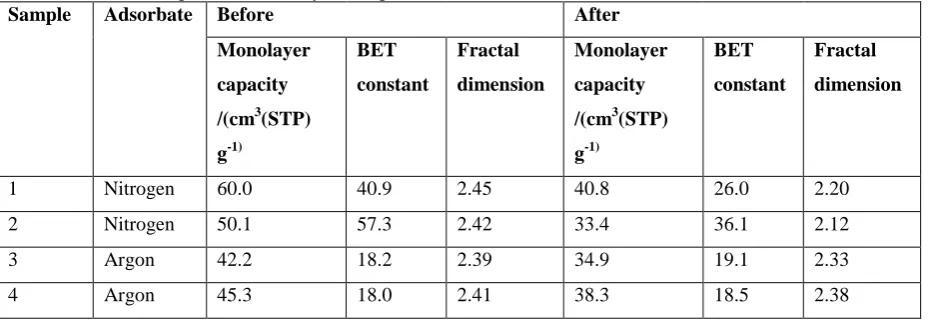
[image:23.595.68.533.260.422.2]fractal BET equation and the resulting model parameters are given in Table 2. It can be seen that in all cases the monolayer capacity declines following mercury entrapment reflecting the loss of accessible porosity. However, it can also be seen that while the BET constant and fractal dimension for nitrogen decline substantially following mercury entrapment, this is not observed for argon. This suggests that the nature of the surface occupied by the nitrogen multi-layer is changed by mercury entrapment while that covered by argon is largely not.
Table 2. Parameters from fitting the fractal BET model to adsorption isotherms for nitrogen or argon obtained before and after entrapment of mercury in samples from batch Q1.
Sample Adsorbate Before After
Monolayer capacity /(cm3(STP) g-1) BET constant Fractal dimension Monolayer capacity /(cm3(STP) g-1)
BET constant
Fractal dimension
1 Nitrogen 60.0 40.9 2.45 40.8 26.0 2.20
2 Nitrogen 50.1 57.3 2.42 33.4 36.1 2.12
3 Argon 42.2 18.2 2.39 34.9 19.1 2.33
4 Argon 45.3 18.0 2.41 38.3 18.5 2.38
Figure 9 shows raw mercury porosimetry data for a typical sample from batch Q1. Figure 9b also shows the results after subtracting the small amount of inter-pellet intrusion evident in Figure 9a, then analysing these data using equation 1 and the parameters in Table 1 for intrusion, and values of A and B of -20 and -187, respectively, for extrusion. From Figure 9b, it can be seen that the modal pore radius from the intrusion curve is ~3.5 nm. It can also be seen, from Figure 9b, that it is possible to achieve a superposition of the mercury intrusion and extrusion curves for smaller pore sizes using these values. It is noted that the region of deviation of the extrusion curve from the intrusion curve in Figure 9b suggests that the majority of entrapment occurs for pores of radii ~3.5-4.5 nm. This is much smaller than the size suggested from gas adsorption above. The wider hysteresis for sample Q1, compared with that of the CPGs used to calibrate eq. 1, is consistent with what has been found
Figure 9. (a) raw mercury intrusion (solid line) and extrusion (×) curves for a typical sample from Batch Q1, and (b) these data following removal of inter-pellet intrusion and analysis of data by eq (1) using parameters in Table 1 and as explained in text.
(a)
4.3 Mercury thermoporometry
Figure 10 shows the DSC cryoporometry melting curve for the mercury entrapped in the sample Q1 following the porosimetry experiment that produced the data shown in Figure 9. The modal peak in the melting curve, for mercury in the pores occurs, at a temperature of -51
○
[image:25.595.76.443.387.656.2]C. The melting point for bulk mercury occurs at -38.8 ○C. Hence, the melting point depression is ~12 ○C. For melting from a hemispherical meniscus the Gibbs-Thompson parameter in eq (3) is 90 K nm [9]. Hence, the characteristic crystal size for entrapped mercury is ~7.5 nm. This corresponds to a pore radius of ~3.8 nm (assuming a non-freezing layer thickness of one atomic diameter). For melting via a cylindrical sleeve-type meniscus the Gibbs-Thompson parameter is 45 K nm [9], and thus the pore sizes obtained would be half the size of those reported above.
4.4 NMR cryoporometry
Figure 11 shows the NMR cryoporometry melting curve for a sample of Q1 spheres fully saturated with water. The melting curve shows two step increases in NMR signal
[image:26.595.87.477.363.659.2]corresponding, at the lower temperatures, to the melting of the liquid within the pores, and, at the higher temeperatures, the bulk layer on the exterior of the pellets. The slight tilt down to higher temperatures in the plateau intermediate between the two steps is due to the Curie effect. The point of inflexion in the step for the melting of the water in the pores occurs at 267.00.5 K. For a Gibbs-Thompson parameter of 52 K nm (for melting from a cylindrical sleeve meniscus) and non-melting layer thickness of 0.4 nm, calibrated using templated mesoporous silicas [28], this suggests the modal pore size is 9.30.8 nm, corresponding to a pore radius of 4.70.4 nm.
4.5 Modelling of multi-layer adsorption on a heterogeneous surface
The aim of the modelling is to see what broad type of underlying scenario for surface-adsorbate interactions would lead to a particular general trend in the observed changes to fitted single fractal BET parameters for isotherms from before and after mercury entrapment. Hence, the point of the modelling is not to quantitatively predict all the experimentally-measured fractal dimensions in Table 2 but predict the qualitative relative trends in fitted parameters for different adsorbates following entrapment. The multi-layer adsorption on the chemically heterogeneous surface obtained after mercury entrapment was modelled using a homotattic patch model, as described in the Theory section, comprising two fractal BET components. It was presumed that the surface of entrapped mercury metal would be smooth and flat, and, thus, have a fractal dimension (d1) of 2. Two adsorption scenarios were
considered. In Case One it was presumed that the adsorbate was relatively non-wetting of the metal surface, such that the BET constant (C1) on the mercury was 1, and the amount of
mercury surface occupied by multi-layer was limited to just the margins neighbouring silica surface, such that it only corresponded to a fraction () of 0.1 of the total occupied surface. Case One corresponds to what would be anticipated for argon. In Case Two, it was presumed that the adsorbate wetted the mercury surface well and the BET constant (C2) was 25, and the
multi-layer spread over all accessible metal surfaces such that they represented as fraction () of 0.5 of the total occupied surface. Case Two corresponds to what would be anticipated for nitrogen. In both models, component two also corresponded to adsorption of the
corresponding adsorbate on the pure silica before mercury entrapment. The full set of model parameters in each scenario was used to obtain a resultant composite isotherm that
represented adsorption on the sample after mercury entrapment. To mimic what happens with the analysis of the experimental data, that homotattic patch model-derived isotherm was then fitted to a single fractal BET equation to obtain the apparent BET constant (Cf) and fractal
dimension (df) from such a fit. The results are shown in Table 3.
Table 3. Input model parameters to homotattic adsorption model and fitted parameters from fit of single fractal BET to composite model isotherm (for 0.05<P/P0<0.6).
Case Underlying model Fit
Vm p C1 d1 C2 d2 Cf df
1 50 0.1 1.0 2.0 19.0 2.40 18.8 2.31
2 50 0.5 25.0 2.0 57.0 2.40 38.1 2.17
5. DISCUSSION
It has been seen that the pore size, obtained from gas adsorption and standard analysis methods, for the pores that entrap mercury in batch Q1 is larger than that obtained from mercury intrusion porosimetry, and also from thermoporometry using the entrapped mercury as the probe fluid. Further, the modal pore size obtained from NMR cryoporometry with water is also much smaller than that obtained from nitrogen adsorption. These findings are in line with what would be expected if gas adsorption was affected by delayed condensation. All of the standard gas adsorption data analysis methods, as described in textbooks [29-31] (Cohan equation, BdB, and NLDFT), all assume a parallel pore bundle model for the void space, and neglect pore-pore co-operative effects in adsorption. Hence, all standard methods will be impacted by the errors determined above. However, the negative peak in the
common to data analysis algorithms, and also macroscopic thermodynamic descriptions of condensation, rather than needing microscopic theories, such as NLDFT or Monte-Carlo methods.
However, it should be mentioned that thermo-/cryo-porometry methods also suffer from a pore-pore co-operative effect known as advanced melting [32-34]. Advanced melting occurs when the melting of the probe fluid in a narrow neck, via a cylindrical-sleeve shaped
meniscus facilitates the melting of the probe fluid in a neighbouring larger pore body via a hemispherical meniscus formed at the join between neck and body. Simple classical geometric treatments, and simulations [34] both suggest this effect may arise when the characteristic size of the pore body does not exceed that of the pore neck by more than a factor of two. It is conceivable that melting of the mercury in Q1 is dominated by the advanced melting effect. This would mean that pore sizes obtained could be underestimated by a factor of two. However, the discrepancy between the pore sizes from thermoporometry and gas adsorption is more than a factor of two suggesting advanced melting effects do not change the conclusion that gas adsorption over-estimates pore sizes. Further, the agreement between mercury porosimetry and thermoporometry validates the interpretation of the thermoporometry data as proposed above.
The integrated mercury porosimetry data has enabled the alternative interpretation of the gas adsorption data due to dead-end ink-bottle pores to be discounted. If this scenario had arisen, it would be expected that both the different methods of characterisation of the pore neck size, namely gas adsorption and mercury intrusion, would have given the same value, but this is not what was found. Hence, the dead-end ink-bottle scenario can be discounted, and the delayed condensation scenario is the correct one.
The homotattic patch modelling has suggested the trends that might be anticipated in the fractal analysis of the multi-layer region of isotherms for before and after mercury
that wet, and do not wet, the entrapped mercury, respectively. These findings thus suggest that nitrogen and argon wet mercury differently, as found in earlier work, and that this effect demonstrates the presence of delayed condensation in Q1.
In a complex, disordered pore network the influence of the advanced condensation effect acts to make large pores appear smaller than they really are, while the influence of the delayed condensation effect acts to make pores look larger than they really are. However, it is unlikely that the two effects will completely compensate for each other in pore bond
networks because the advanced condensation effect is brought about by smaller pores that are co-axial with the larger pores, and can produce a hemispherical meniscus at the end of the larger pore, while delayed condensation is caused by pores that are perpendicular to the through-pore axis. In a complex disordered material it is unlikely that, just by chance, the small pore attached to the entrance to large pore would have just the right size to compensate for the effect of one, or more, side branches off the larger through-pore. Hence, it is likely one effect will dominate over the other, and in Q1 it is the delayed condensation effect that is dominant.
6. CONCLUSIONS
REFERENCES
1. C.D., Tsakiroglou, V.N. Burganos, J. Jacobsen, Pore structure analysis by using nitrogen sorption and mercury intrusion data, AIChEJ. 50 (2004) 489-510.
2. F. Tariq, R. Haswell, P.D. Lee, D.W. McComb, Characterization of hierarchical pore structures in ceramics using multiscale tomography. Acta Materialia, 59 (2011) 2109-2120.
3. S. Komini Babu, H. Chung, G. Wu, P. Zelenay, S. Litster, Modeling Hierarchical Non-Precious Metal Catalyst Cathodes for PEFCs Using Multi-Scale X-ray CT Imaging, ECS Trans. 64 (2014) 281-292.
4. A. Nepryahin, R.S. Fletcher, E.M. Holt, S.P. Rigby, Structure-transport relationships in disordered solids using integrated rate of gas sorption and mercury porosimetry, Chem. Engng Sci. 152 (2016) 663–673.
5. I. Hitchcock, M. Lunel; S. Bakalis, R.S. Fletcher, E.M. Holt, S.P. Rigby, Improving sensitivity and accuracy of pore structural characterisation using scanning curves in
integrated gas sorption and mercury porosimetry experiments, J. Colloid Interface Sci. 417 (2014) 88-99.
6. J.M. Esparza, M.L. Ojeda, A. Campero, A. Dominguez, I. Kornhauser, F. Rojas, A.M. Vidales, R.H. Lopez, G. Zgrablich, N-2 sorption scanning behavior of SBA-15 porous substrates. Colloids and Surfaces A: Physiochem. and Eng. Aspects 241 (2004) 35-45.
7. J. Matadamas, R. Alferez, R. Lopez, G. Roman, I. Kornhauser, F. Rojas, Advanced and delayed filling or emptying of pore entities by vapour sorption or liquid intrusion in simulated porous networks. Colloids and Surfaces A: Physiochem. and Eng. Aspects 496 (2016) 39-51.
9. B. Bafarawa, A. Nepryahin, L. Ji, E.M. Holt, J. Wang, S.P. Rigby, Combining mercury thermoporometry with integrated gas sorption and mercury porosimetry to improve accuracy of pore-size distributions for disordered solids, J. Colloid Interface Sci. 426 (2014) 72-79.
10. E.W. Washburn, The dynamics of capillary flow. Phys. Rev. 17 (1921) 273-283.
11. J. Van Brakel, S. Modry, M. Svata, Mercury porosimetry: State of the art. Powder Technol. 29 (1981) 1-12.
12. J. Kloubek, Hysteresis in porosimetry, Powder Technol. 29 (1981) 63-73.
13. S.P. Rigby, New methodologies in mercury porosimetry. Studies in Surface Science and Catalysis 144 (2002) 185-192.
14. A.A. Liabastre, C. Orr, Evaluation of pore structure by mercury penetration. J. Colloid Interface Sci. 64 (1978) 1-18.
15. S.P. Rigby, P.I. Chigada, MF-DFT and experimental investigations of the origins of hysteresis in mercury porosimetry of silica materials, Langmuir 26 (2010) 241-248.
16. J. Mitchell, J.B.W. Webber, J. Strange, Nuclear magnetic resonance cryoporometry.
Physics Reports 461 (2008) 1-36.
17. J.J. Fripiat, L. Gatineau, H. Van Damme, Multilayer Physical Adsorption on Fractal Surfaces. Langmuir 2 (1986) 562-567.
18. M. Mahnke, H.J. Mögel, Fractal Analysis of Physical Adsorption on Material Surfaces.
Colloids Surf., A 216 (2003) 215-228.
20. N.C. Wardlaw, M. McKellar, Mercury porosimetry and the interpretation of pore
geometry in sedimentary rocks and artificial models. Powder Technology 29 (1981) 127-143.
21. R.L. Portsmouth, L.F. Gladden, Determination of pore connectivity by mercury porosimetry. Chem. Engng Sci. 46 (1991) 3023-3036.
22. Y. Li, N.C. Wardlaw, Mechanisms of nonwetting phase trapping during imbibition at slow rates. J. Colloid Interface Sci. 109 (1986) 473-486.
23. G. Neubauer, Intrusion and extrusion of mercury in idealized rectangular pores. Bachelor of Science in Ceramic Engineering Senior thesis; Alfred University, Alfred, NY, 2007.
24. L.H. Cohan, Sorption Hysteresis and the Vapor Pressure of Concave Surfaces. J. Am. Chem. Soc. 60 (1938) 433-435.
25. L. Ruffino, R. Mann, R.J. Oldman, S. Rigby, S. Allen, Using low melting point alloy intrusion to quantify pore structure: studies on an alumina support. Stud. Surf. Sci. Catal. 133 (2001) 155-162.
26. J.C.P. Broekhoff, J.H. De Boer, Studies on Pore Systems in Catalysis X: Calculations of Pore Distributions From the Adsorption Branch of Nitrogen Sorption Isotherms in the Case of Open Cylindrical Pores, J. Catal. 9 (1967) 15-27.
28. A. Schreiber, I. Ketelsen, G.H. Findenegg, Melting and freezing of water in ordered mesoporous silica materials, Phys. Chem. Chem. Phys. 3 (2001) 1185-1195.
29. S. J. Gregg, K. S. W. Sing, Adsorption, Surface Area and Porosity. 2nd ed., Academic Press: London, 1982.
30. F. Rouquerol, J. Rouquerol, K. Sing, Adsorption by Powders and Porous Solids: Principles, Methodology and Applications. Academic Press, London, 1999.
31. S. Lowell, J.E. Shields, M.A. Thomas, M. Thommes, Characterisation of Porous Solids and Powders: Surface Area, Pore Size and Density. Dordrecht: Spinger, 2004.
32. D. Kondrashova, C. Reichenbach, R. Valiullin, Probing Pore Connectivity in Random Porous Materials by Scanning Freezing and Melting Experiments, Langmuir 26 (2010) 6380-6385.
33. I. Hitchcock, E.M. Holt, J.P. Lowe, S.P. Rigby, Studies of freezing-melting hysteresis in cryoporometry scanning loop experiments using NMR diffusometry and relaxometry, Chem. Engng Sci. 66 (2011) 582-592.
34. D. Kondrashova, R. Valiullin, Freezing and Melting Transitions under Mesoscalic Confinement: Application of the Kossel-Stranski Crystal-Growth Model J. Phys. Chem. C
TOC Graphical Abstract