1
Crystalline Polymer Electrolytes
Yuri G. Andreev, Chuhong Zhang and Peter G. Bruce
School of Chemistry, University of St Andrews, North Haugh, St Andrews, Fife, Scotland KY16 9ST
In this chapter we describe crystalline ion-conducting complexes formed by akali metal salts and poly(ethylene oxide). A variety of factors influencing the conductivity of such complexes are presented. Electrochemical testing of these materials in lithium and sodium rechargeable batteries demonstrate that crystalline polymer/salt complexes can be used as electrolytes in all-solid-state energy storage devices.
1. Introduction
Since their discovery by Wright1and the realization of their potential as solid ionic
conductors by Armand,2polymer/salt complexes have been the subject of intense
study for over 40 years.3,4 During the first 30 years amorphous polymer/salt
complexes formed by alkali metal salts and poly(ethylene oxide) (PEO), CH3O(CH2CH2O)nCH3, or its various derivatives, were the main focus of research
since only such complexes were known to conduct ions and thus serve as polymer electrolytes (PE) in a variety of electrochemical devices.
Amorphous PE’s operate only above their glass transition temperature, Tg, and
their conductivity mechanism is explained in terms of the dynamic bond percolation theory.5 According to this theory, ion transport is promoted by local
order in their amorphous counterparts, since it had been demonstrated that the arrangement of the nearest neighboring atoms was independent of the degree of long-range order.6
We shall begin by describing the discovery of ionic conductivity in crystalline polymer/salt complexes, followed by a presentation of their crystal structures, the factors that influence the magnitude of the conductivity ending with some comments on the future direction of research.
2. Discovery of Crystalline Polymer Electrolytes
The research on crystalline polymer/salt complexes took a significant turn when a new and powerful structure determination method from powder diffraction data was developed,7,8which led to solution of the crystal structures of PEO
6:Li15F6
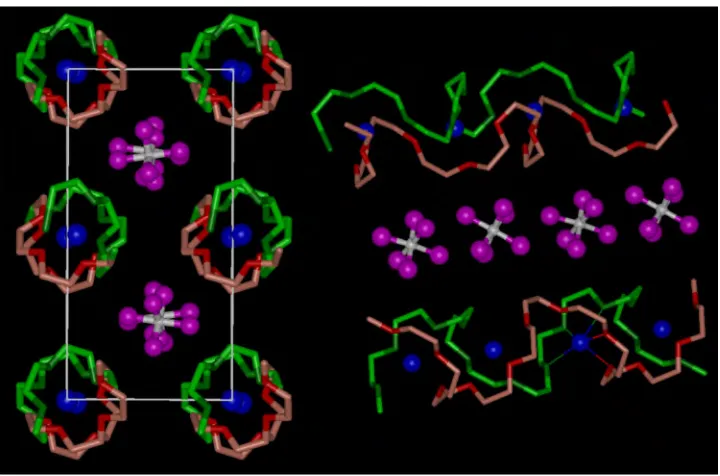
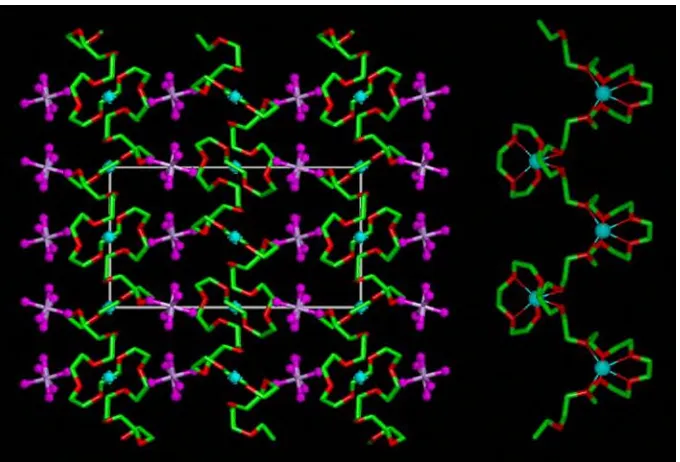
(X=P, As, Sb).9,10Each of these isostructural complexes, Fig 15.1, contains
[image:2.595.118.478.365.603.2]cylindrical tunnels formed by pairs of polymer chains. Lithium cations reside
Figure 15.1. The structure of PEO6::LiAsF6, Left, view of the structure showing rows of Li+ions perpendicular to the page. Blue spheres, lithium; white spheres, arsenic; magenta, fluorine; light green, carbon in chain 1; dark green, oxygen in chain 1; pink, carbon in chain 2; red, oxygen in chain 2 (hydrogen atoms not shown). Right, view of the structure showing the relative positions of the chains and their conformation.
structural arrangement immediately suggested possible Li+ transport along the
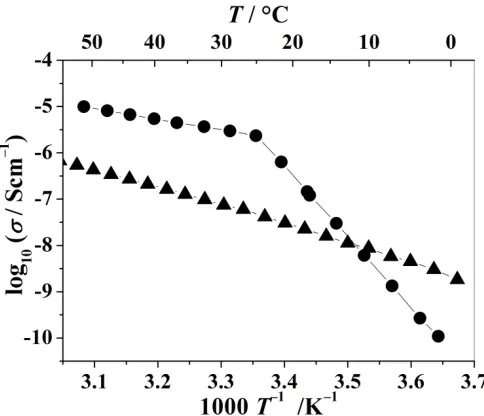
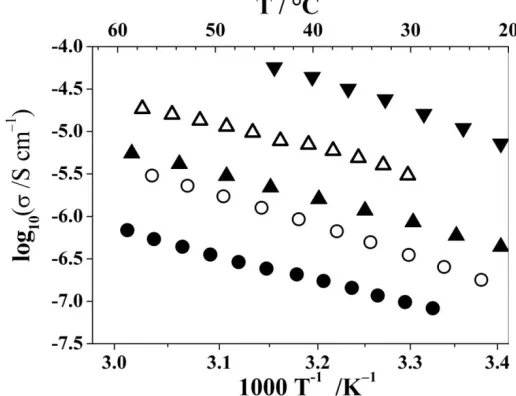
tunnels, which was readily confirmed by variable-temperature conductivity measurements, Fig 15.2, establishing the existence of crystalline PE’s. The later discovery of PEO8:MAsF6(M=Na, K, Rb) expanded the field of crystalline PE’s.
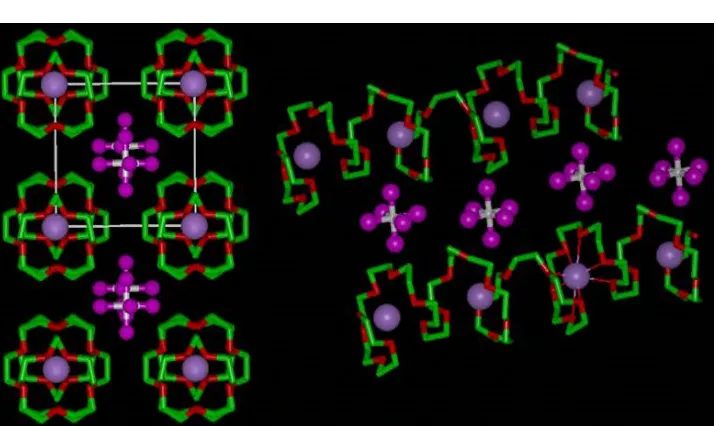
[image:3.595.196.438.278.486.2]The structure of the 8:1 complexes is distinct from that of the 6:1 complexes. The alkali metal cations are contained within tunnels formed from only one helical polymer chain. The cations are coordinated by 8 ether oxygens and the anions are located in the inter-tunnel space and not involved in coordination, Fig 15.3.
Figure 15.2. Ionic conductivity of crystalline PEO6::LiAsF6(triangles) and PEO8:NaAsF6(circles) as a function of temperature.
A common feature of all crystalline PE’s is a linear dependence of the logarithm of conductivity with the inverse temperature, see Fig. 15.2, like that in ceramic ionic conductors, and distinctly different from the non-linear temperature dependence in amorphous PE’s described by a Vogel-Tamman-Fulcher equation. Such linear behavior is adequately described by an Arrhenius equation and suggests the ion-hopping mechanism of conductivity. It should be mentioned here that the observed change of the slope in the conductivity dependence of PEO8:NaAsF6 at ~25° C is associated with a phase change in the crystalline
Figure 15.3. The structure of PEO8::NaAsF6, Left, view of the structure showing rows of Li+ions perpendicular to the page. Violet spheres, sodium; white spheres, arsenic; magenta, fluorine; green, carbon; red, oxygen (hydrogen atoms not shown). Right, view of the structure showing the relative positions of the chains and their conformation.
The ratio of the cations and anions involved in the charge transport is different in Li- and Na-based crystalline PE’s. Only Li+ cations diffuse in PEO
6:LiXF6,
along the tunnels formed by PEO. Molecular dynamics simulations reveal that the polymer chains “breathe” to ease the ion transport without disrupting the integrity of the crystal structure, thus the dynamics of the chains plays an important role in promoting conductivity by opening bottlenecks between static sites.11,12 The
cations hop through coordination sites found in the structure of each tunnel and formed by either 6 (site occupied by Li+in the structure) or 4 (vacant site in the
structural model) ether oxygens. In PEO8:NaAsF6, however, 60% of charge is
carried by anions at temperatures above ambient. This proportion increases to over 80% below room temperature.
Conductivity of the early crystalline lithium PE’s was not sufficient for applications in electrochemical devices. As a result, research was carried out to understand the factors that influence the level of ionic conductivity, revealing ways by which it can be increased. Let us consider them in turn.
3. Crystal Structure
between 1 and 4, were established prior to discovery of the ion-conducting 6:1’s and 8:1’s with hexafluoride anions. The common feature of all structures withn≤4
[image:5.595.117.481.190.338.2]is that both ether oxygens and anions coordinate the cations, Fig. 15.4.
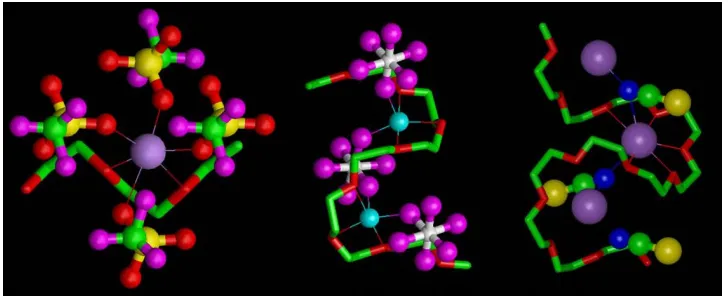
Figure 15.4. Fragments of the structures of (from left to right) PEO::NaCF3SO3,13PEO3::LiAsF6,14 PEO4::KSCN15showing cation coordination. Violet spheres, sodium/potassium; light blue spheres, lithium; yellow spheres, sulfur; dark blue spheres, nitrogen; white spheres, arsenic; magenta, fluorine; green, carbon; red, oxygen
Strong binding between the cations and the coordinating anions can inhibit ion transport. However, successful diffusion of ions in an ordered environment is possible only via pathways connecting the sites occupied by the potentially mobile ions. Such pathways also require intermediate vacant coordination sites if the sites populated by ions are too far apart to enable hopping.
The profound effect of crystal structure on ionic conductivity of PE’s can be demonstrated by comparing two polymorphs of PEO6:LiAsF6. In addition to the
structure shown in Fig.15.1, hereafter referred to as α phase, a complex with the
same chemical composition can be obtained with a different atomic arrangement,
β phase, Fig. 15.5.16Each Li+ ion in the β phase is coordinated by 6 ether oxygens
from a turn of a single non-helical PEO chain. The shortest lithium-lithium
distance is 7.5 Å, compared to 5.4 Å in the α phase. Unlike the α phase, Li+ions
in the β phase are arranged in a zigzag fashion and there are no intermediate
coordination sites to sustain cation hopping. The AsF6-anions form columns and
do not coordinate the cations. Thus the ionic conductivity is likely to be largely
Figure 15.5. The structure of β-PEO6::LiAsF6, Left, view of the structure showing chain and ion arrangements. Blue spheres, lithium; white spheres, arsenic; magenta, fluorine; green, carbon; red, oxygen (hydrogen atoms not shown). Right, fragment of the structure showing conformation of the PEO chains and coordination of cations by ether oxygens.
4.
Molecular Weight of the Polymer
[image:6.595.125.465.167.398.2]crystallographic order) increases on reduction of the Mw.17 The dependence is
linear, Fig.15.6, only at low weights up to ~2000 Da, above which it rapidly plateaus.
Figure 15.6. Crystallite size of PEO6::LiXF6(X=P, As, Sb) as a function of molecular weight of the polymer.
The trend of increasing crystallite size with decreasing molecular weight is as expected for polymer crystallization. 2000 Da is below the entanglement limit for PEO and hence chain lengths corresponding to the molar masses below should grow larger crystals, unimpeded by chain entanglement which causes disorder. The exact arrangement at the junctions of neighboring PEO chains in the structure cannot be directly established by diffraction studies, since even at 750 Da the average individual chain in the structure of PEO6:LiAsF6 spreads over 33 Å –
almost twice the value of the longest unit cell edge, 17.5 Å, of the complex. This and the fact that the crystallite size is greater than 2500 Å (no broadening of the diffraction peaks) make the polymer chains appear crystallographically infinite.
Like the crystallite size, ionic conductivity in PEO6:LiXF6 also increases on
reduction of the Mw, Fig.15.7, by four orders of magnitude in the range from 2000 to 750 Da. The increase in crystallite size results in fewer grain boundaries per unit length and this is expected to increase conductivity, but not by 4 orders
of magnitude. It may be that accompanying the growth of larger crystallites there is better alignment of the chains within the crystals which reduces the barriers to Li+transport at lower Mw’s of the polymer. Such changes are consistent with the
[image:7.595.196.399.487.635.2]non-linearity of the dependence shown in Fig.15.7.
5. Doping
Doping is a well-established means of changing electrical properties of solids. A variety of doping strategies were tested in an attempt to improve the ionic conductivity of crystalline PE’s.
5.1. Isovalent anionic doping
While it is common to increase the conductivity of hopping ionic conductors by introducing additional vacancies or interstitials, as discussed later, there is precedent for enhanced conductivity due to isovalent doping in ceramic ionic conductors, specifically AgI.18 Conductivity increases by three orders of
magnitude on replacing 20 mol% of I-with Br-. The substituting ion changes the
potential energy of the conducting ion and hence the energetics of defect creation as well as ion mobility.
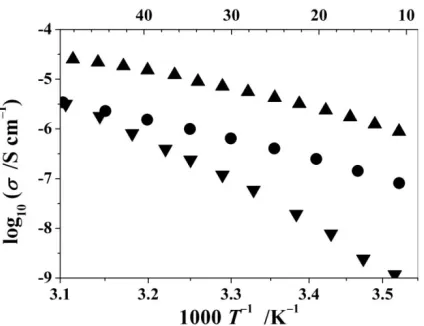
It is possible to replace up to 5 mol% of the hexafluorarsenate anions in PEO6:LiAsF6 by bis(trifluoromethanesulphonyl)imide (TFSI), N(SO2CF3)2-,
without changing the crystal structure of the host complex and without any evidence of amorphization, despite the significant difference in the shape and size between the two anions. The conductivity of such the PEO6:(LiAsF6)0.95(LiTFSI)0.05complex is 1.5 orders of magnitude higher than of
[image:8.595.149.407.469.667.2]the pristine, undoped, PE, Fig.15.8.19
It appears that differences in shape, size and charge distribution of the doping anion do not have to be substantial in order to provide significant increase in conductivity. PEO6:Li(AsF6)1-x(SbF6)x complex at x=0.9 and x=0.1 has over an
order of magnitude higher conductivity than the undoped ones, at x=0 or x=1, see Fig.15.8.20 The only discerning difference between the two anions is the ionic
radius – 1.67 Å (AsF6-) and 1.81 Å (SbF6-). However, like in the case of AgI, subtle
strains caused by the size difference between the two XF6-anions is sufficient to
disrupt the potential around the Li+ions, enhancing the conductivity.
5.2. Aliovalent anionic doping
Introduction of vacancies or interstitial ions are the dominant methods of increasing conductivity of ceramic superionic conductors. The latter strategy was applied to crystalline PE’s by means of partial replacement of SbF6- anions with
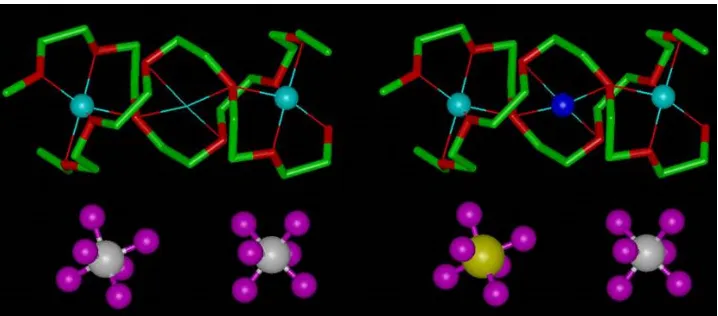
divalent SiF62- in the corresponding 6:1 complex.21 Less than 5 mol% of the
antimony hexafluoride anions can be replaced by SiF62-, with additional Li+ions
[image:9.595.119.478.435.593.2](to maintain electroneutrality) most likely occupying the 4-coordinate sites in the tunnel formed by the PEO chains, Fig.15.9, located between the 6-coordinate sites occupied by lithiums in the structure of PEO6:LiSbF6. The conductivity of
Figure 15.9. Aliovalent doping of PEO6::LiSbF6. Left, fragment of the undoped structure showing unoccupied 4-coordinate site. Right, same fragment with one of the SbF6-anions replaced by SiF6 2-and the vacant site occupied by Li+(dark blue sphere). White spheres, antimony; magenta spheres, fluorine; blue spheres, lithium; yellow sphere, silicon; green, carbon; red, oxygen.
PEO6:(LiSbF6)0.98(Li2SiF6)0.02, see Fig.15.8, is just over an order of magnitude
5.3. Polymer doping
For ion transport to occur, point defects (vacancies or interstitials) are required. Polymer chain ends are a likely source of point defects in crystalline PE’s. To probe this, the number of chain ends must be increased. This can be achieved by using mixtures of PEO and glymes – commercially available monodispersed poly(ethylene oxide) with fewer repeat units – during the synthesis of crystalline complexes. The major hurdle to be overcome with doping by glymes is phase segregation. Short-chain monodispersed polymers readily form crystalline complexes with alkali metal salts that have different structure and not necessarily good ionic conductors. At present only one 6:1 complex, in which the tunnel enclosing the cations is formed by a 3:1 mixture of PEO (Mw 1000 Da) and tetraglyme, has been reported, (PEO0.75G40.25)6:LiPF6 [G4=
CH3O(CH2CH2O)4CH3].22 The conductivity of this complex is one and a half
orders of magnitude higher than that of the PEO6:LiPF6, see Fig.15.8.
6. Polymer Chain Ends
Once the role of the PEO chain ends in ionic conductivity of crystalline PE’s had been established, the influence of the size of the end groups was investigated. In addition to the PEO6:LiPF6complex with PEO (Mw=1000 Da) chains terminated
by methyl groups, –CH3, complexes with the same polymer terminated by –C2H5
and –C3H7 were prepared. It turns out that slightly bulkier end groups, –C2H5,
[image:10.595.185.397.515.678.2]increase the conductivity of the complex by an order of magnitude, Fig.15.10,23
while the conductivity drops significantly at temperatures below 50 °C, when even larger groups, –C3H7, are used to terminate the polymer, with noticeable increase
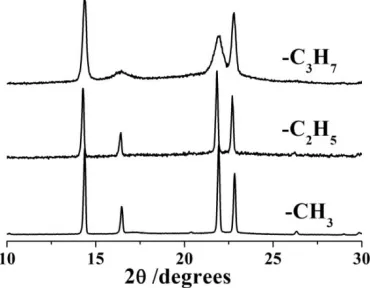
of the activation energy (change in the slope of the temperature dependent conductivity in Fig.15.10). Powder diffraction patterns, Fig.15.11, confirm that all three complexes have the same structure but the crystallite size is significantly smaller (broader Bragg peaks) in the complex prepared with C3H7-terminated
PEO. Thus, chain ends that are moderately larger than –CH3create greater local
[image:11.595.202.387.317.461.2]structural disorder, which is beneficial for the conductivity increase, however once the size of the terminal groups increases further, the long-range crystal order becomes disrupted, which is detrimental for conductivity.
Figure 15.11. X-ray powder diffraction patterns PEO6::LiPF6prepared with PEO terminated by various end groups. Although the structure is the same for all three groups, broader peaks in the pattern from the complex with the bulkiest ends indicate significant reduction of the crystallite size.
7. Dispersity of Polymer Chain Lengths
Figure 15.12. Mass spectrum of polydispersed PEO (<Mw> = 1000 Da). Numbers above the peaks represent the number of EO units in the corresponding chains.
However, it is possible to synthesize PEO of selective Mw’s which closely approach monodispersity. PEO6:LiPF6 complex with monodispersed polymer of
22 EO repeat units, Mw=1015 Da, has the same structure as the 6:1 complex prepared with polydispersed PEO. Only the lattice parameters in the two complexes are slightly different, which is manifested by small shifts in the diffraction peak positions, Fig.15.13. With dispersity of the polymer length being the sole distinction, it is the arrangement of the chain ends that causes the
Figure 15.13. X-ray powder diffraction patterns PEO6::LiPF6prepared with polydispersed (black) and monodispersed (red) PEO. Peak shifts indicate change in the unit cell sizes.
[image:12.595.217.414.477.631.2]tunnels such an arrangement would effectively mimic the complex with polydispersed PEO and no change in the lattice parameters would take place. However, coincidence of all ends of the polymer chain pairs forming the tunnels, see Fig.15.1, imposes a greater impact on the structure, which is likely to change the lattice parameters both in the direction of the tunnels’ axes and perpendicular to them.
There are two possible patterns of how the PEO chain ends can be arranged in the structure of the 6:1 complex prepared with a monodispersed polymer. The first one implies the highest degree of coincidence – junctions of chain ends coincide in all neighboring tunnels, forming planes throughout the crystallites. The second pattern precludes formation of such planes, limiting coincidence of chain ends of the two polymer strands only within individual tunnels. The “planes” model inevitably entails a change in crystal symmetry of the complex. However, no experimental evidence of superstructure in the monodispersed complex has been obtained. In addition, MD simulations of the first model indicate that the blocks of tunnels containing uninterrupted polymers are unlikely to be aligned perpendicular to the planes of chain ends but instead are canted with respect to each other. The consequence of such a canted arrangement would be reduction of the crystallite size from 2500 Å down to ~40 Å (the overall length of an individual PEO chain in the complex), manifested by pronounced peak broadening in the powder diffraction pattern. This is not supported by the experimental data, see Fig.15.13. Thus, the only plausible model of the chain ends arrangement in the 6:1 complex prepared with a monodispersed PEO, which explains the change in the unit cell dimensions while preserving the crystallite size, is the coincidence of the ends on both sides of individual tunnels but with no registry between tunnels.
Coincidence of chain ends may explain the lower conductivity of the PEO6:LiPF6complex, when monodispersed polymer is used,23Fig.15.14, because
there are fewer occurrences of such defects along the same length of the tunnel than in the 6:1 structure with polydispersed PEO.
8. Conduction in Crystalline Polymer Electrolytes
Although our understanding of ion transport in PE’s is far from complete, the studies described above have permitted the statement of some key features.
Ionic conductivity in crystalline polymers resembles that in ceramic electrolytes more closely than amorphous polymers above Tg. The ion motion
involves hopping between neighboring sites along the polymer tunnels and hence requires defects, vacancies and interstitials. The tunnels are composed of chains of finite length. Chain ends are natural sources of point defects, where one might expect missing cations or cations located outside the tunnels, paired with the anions. Increasing the magnitude (size of chain end groups) of the disorder at the chain ends can increase conductivity proportionally to an increase in the number of defects (conductivityσ=nqμ,n– number of carriers;q– charge;μ– mobility). However since this is a 1D conductor, too much disruption of the tunnel continuity at the chain ends will compromise the mobility of the ions along the tunnels. As a consequence, a balance has to be struck and of course this highlights the importance of searching for 2- and 3D crystalline PE structures where defects are much less likely to impede ion transport.
Despite the limitations of the 1D structure, investigation of the factors influencing the ionic conductivity of crystalline PE’s led to conductivities approaching that of the best amorphous PEO:salt complexes, with the advantage of higher Li+ transport numbers in the ordered, crystalline, complexes. To make
further improvements a detailed knowledge of the mechanism of conductivity in crystalline PE’s is required. Work to better establish the conduction mechanism is currently under way.
9. Crystalline Polymer Electrolytes in Lithium and Sodium Ion Batteries
Solid electrolyte holds the key to all-solid-state electrochemical devices. Ionic conductivity is not the only criteria of importance for the application of solid electrolytes in lithium-ion batteries. The electrolyte/electrode interface is critical and this is a major problem for ceramic electrolytes.3,4 PE’s offer potentially
superior interfacial properties with solid intercalation electrodes. Crystalline PE, (PEO0.75G40.25)6:LiPF6, which has the highest conductivity at room temperature
Linear voltammetry established the electrochemical stability window between ~4.5V (cathodic polarization) and 1.5V (anodic polarization) versus Li+/Li
(Fig.15.15), which is consistent with expectations for an ether-based electrolyte.
Figure 15.15. Linear sweep voltammograms of (left) (PEO0.75G40.25)6:LiPF6 and (right) PEO8:NaAsF6at 45oC. Scan rate 1 mV s-1. Stainless steel working electrode.
The results of galvanostatic cycling of a cell with LiFePO4as a cathode and
Li-metal as anode are shown in Fig.15.16. The cycling reveals good capacity retention at various current densities (see inset in Fig.15.16). The load curve is dominated by a plateau at ~3.5V, as expected for the two phase intercalation reaction associated with LiFePO4/FePO4.24 The capacity does decrease significantly with
increasing rate. From the current density in mAcm-2at each rate we calculated the
IRdrop from the electrolyte resistance and this is 20mV at C/20 rising to 80mV at C/5. Examining the load curve in Fig.15.16, it is unlikely the IRdrop alone can account for the reduction in capacity at higher rate. As such, there must be significant interfacial resistance.
As the polymer electrolyte is not of course stable in contact with Li, we replaced it with VO2(B), the potential of which vs Li+/Li is 2.45V and hence lies
within the stability window of the electrolyte. Galvanostatic cycling of a cell constructed with VO2(B) (anode) and LiFePO4 (cathode) is shown in Fig.15.16.
The overall cell potential is as anticipated, based on the voltages of the two electrodes, as is the shape of the overall load curve, which is dominated by plateaus on charge and discharge with good capacity retention (see inset in Fig.15.16). The cell is cathode-limited and the capacities are therefore based on the mass of the cathode. Unlike LiFePO4, there is no phase change associated with lithium
intercalation/de-intercalation in VO2(B) during charge and discharge.25
Linear voltammetry of the crystalline PEO8:NaAsF6 complex revealed an
Na0.44MnO2 as both cathode and anode electrodes demonstrated sustainable
cycling (Fig.15.17).
Figure 15.16. Charge–discharge curves of all-solid-state batteries consisting of
(PEO0.75G40.25)6:LiPF6polymer electrolyte, LiFePO4cathode and (left) Li metal anode at 45 °C, (right) VO2(B) anode at 25 °C, at a rate of C/20. Capacities are based on the LiFePO4cathode expressed as C rate, where 1C corresponds to 170 mAhg-1(the theoretical capacity of LiFePO
[image:16.595.176.389.407.572.2]4). Insets are discharge capacity of corresponding cells at various current densities.
Figure 15.17. Charge-discharge curves for a NaxMnO2/ PEO8:NaAsF6/ NaxMnO2cell (x0= 0.44) at 45 °C, rate C/6. Numbers indicate cycles.
Future research of crystalline PE’s will be focused on establishing detailed mechanism of ionic conduction in such complexes. The conductivity mechanism will pave the way for design of PE’s with the composition and the structure optimized for ionic conduction. In addition, new types of crystalline PE’s with two- and three-dimensional pathways for ion transport are likely to deliver a major increase of conductivity.
References
1. D. E. Fenton, J. M. Parker and P. V. Wright,Polymer, 14 (1973) 589.
2. M. B. Armand, J. M. Chabagno and M. J. Duclot, in''Fast Ion Transport in Solids'', Eds. P. Vashishta, J. N. Mundy and G. K. Shenoy, North-Holland, (1979) 131.
3. F. M. Gray and R. S. o. Chemistry,Polymer electrolytes, Royal Society of Chemistry, (1997).
4. C. Sequeira and D. Santos, Polymer Electrolytes: Fundamentals and Applications, Woodhead Publ Ltd, Cambridge, (2010).
5. S. D. Druger, M. A. Ratner and A. Nitzan,Solid State Ion., 9-10 (1983) 1115. 6. R. Frech, S. Chintapalli, P. G. Bruce and C. A. Vincent,Chem. Commun., (1997) 157. 7. Y. G. Andreev, P. Lightfoot and P. G. Bruce,Chem. Commun., (1996) 2169.
8. Y. G. Andreev, P. Lightfoot and P. G. Bruce,J. Appl. Crystallogr., 30 (1997) 294. 9. G. S. MacGlashan, Y. G. Andreev and P. G. Bruce,Nature, 398 (1999) 792.
10. Z. Gadjourova, D. M. Marero, K. H. Andersen, Y. G. Andreev and P. G. Bruce,Chem. Mat., 13 (2001) 1282.
11. D. Brandell, A. Liivat, A. Aabloo and J. O. Thomas,J. Mater. Chem., 15 (2005) 4338. 12. D. Brandell, A. Liivat, H. Kasemagi, A. Aabloo and J. O. Thomas,J. Mater. Chem., 15
(2005) 1422.
13. Y. G. Andreev, G. S. MacGlashan and P. G. Bruce,Phys. Rev. B, 55 (1997) 12011. 14. I. Martin-Litas, Y. G. Andreev and P. G. Bruce,Chem. Mat., 14 (2002) 2166. 15. P. Lightfoot, J. L. Nowinski and P. G. Bruce,J. Am. Chem. Soc., 116 (1994) 7469. 16. E. Staunton, Y. G. Andreev and P. G. Bruce,J. Am. Chem. Soc., 127 (2005) 12176. 17. Z. Stoeva, I. Martin-Litas, E. Staunton, Y. G. Andreev and P. G. Bruce,J. Am. Chem. Soc.,
125 (2003) 4619.
18. K. Shahi and J. B. Wagner,Appl. Phys. Lett., 37 (1980) 757.
19. A. M. Christie, S. J. Lilley, E. Staunton, Y. G. Andreev and P. G. Bruce,Nature, 433 (2005) 50.
20. S. J. Lilley, Y. G. Andreev and P. G. Bruce,J. Am. Chem. Soc., 128 (2006) 12036. 21. C. H. Zhang, E. Staunton, Y. G. Andreev and P. G. Bruce,J. Am. Chem. Soc., 127 (2005)
18305.
22. C. Zhang, E. Staunton, Y. G. Andreev and P. G. Bruce,J. Mater. Chem., 17 (2007) 3222. 23. E. Staunton, Y. G. Andreev and P. G. Bruce,Faraday Discuss., 134 (2007) 143.