The VANDELS ESO public spectroscopic survey
R. J. McLure,
1‹L. Pentericci,
2A. Cimatti,
3,4J. S. Dunlop,
1D. Elbaz,
5A. Fontana,
2K. Nandra,
6R. Amorin,
7,8M. Bolzonella,
9A. Bongiorno,
2A. C. Carnall,
1M. Castellano,
2M. Cirasuolo,
10O. Cucciati,
9F. Cullen,
1S. De Barros,
11S. L. Finkelstein,
12F. Fontanot,
13P. Franzetti,
14M. Fumana,
14A. Gargiulo,
14B. Garilli,
14L. Guaita,
2,15W. G. Hartley,
16A. Iovino,
17M. J. Jarvis,
18S. Juneau,
5W. Karman,
19D. Maccagni,
14F. Marchi,
2E. M´armol-Queralt´o,
1E. Pompei,
20L. Pozzetti,
9M. Scodeggio,
14V. Sommariva,
3M. Talia,
3,9O. Almaini,
21I. Balestra,
22S. Bardelli,
9E. F. Bell,
23N. Bourne,
1R. A. A. Bowler,
18M. Brusa,
3F. Buitrago,
24,25K. I. Caputi,
19P. Cassata,
26S. Charlot,
27A. Citro,
3G. Cresci,
4S. Cristiani,
13E. Curtis-Lake,
27M. Dickinson,
28G. G. Fazio,
29H. C. Ferguson,
30F. Fiore,
2M. Franco,
5J. P. U. Fynbo,
31A. Galametz,
6A. Georgakakis,
32M. Giavalisco,
33A. Grazian,
2N. P. Hathi,
30I. Jung,
12S. Kim,
34A. M. Koekemoer,
30Y. Khusanova,
35O. Le F`evre,
35J. M. Lotz,
30F. Mannucci,
4D. T. Maltby,
21K. Matsuoka,
4D. J. McLeod,
1H. Mendez-Hernandez,
26J. Mendez-Abreu,
36,37M. Mignoli,
3M. Moresco,
3,9A. Mortlock,
1M. Nonino,
13M. Pannella,
38C. Papovich,
39P. Popesso,
40D. P. Rosario,
41M. Salvato,
6,40P. Santini,
2D. Schaerer,
11C. Schreiber,
42D. P. Stark,
43L. A. M. Tasca,
35R. Thomas,
20T. Treu,
44E. Vanzella,
9V. Wild,
45C. C. Williams,
43G. Zamorani
9and E. Zucca
9Affiliations are listed at the end of the paper
Accepted 2018 May 7. Received 2018 May 3; in original form 2018 March 20
A B S T R A C T
VANDELS is a uniquely deep spectroscopic survey of high-redshift galaxies with the VIMOS spectrograph on ESO’s Very Large Telescope (VLT). The survey has obtained ultradeep optical (0.48< λ <1.0μm) spectroscopy of2100 galaxies within the redshift interval 1.0≤z≤
7.0, over a total area of0.2 deg2centred on the CANDELS Ultra Deep Survey and Chandra Deep Field South fields. Based on accurate photometric redshift pre-selection, 85 per cent of the galaxies targeted by VANDELS were selected to be atz≥3. Exploiting the red sensitivity of the refurbished VIMOS spectrograph, the fundamental aim of the survey is to provide the high-signal-to-noise ratio spectra necessary to measure key physical properties such as stellar population ages, masses, metallicities, and outflow velocities from detailed absorption-line studies. Using integration times calculated to produce an approximately constant signal-to-noise ratio (20<tint<80 h), the VANDELS survey targeted: (a) bright star-forming galaxies at 2.4≤z≤5.5, (b) massive quiescent galaxies at 1.0≤z≤2.5, (c) fainter star-forming galaxies at 3.0≤z≤7.0, and (d) X-ray/Spitzer-selected active galactic nuclei andHerschel-detected galaxies. By targeting two extragalactic survey fields with superb multiwavelength imaging data, VANDELS will produce a unique legacy data set for exploring the physics underpinning high-redshift galaxy evolution. In this paper, we provide an overview of the VANDELS survey
designed to support the science exploitation of the first ESO public data release, focusing on the scientific motivation, survey design, and target selection.
Key words: surveys – galaxies: evolution – galaxies: high-redshift – galaxies: star formation.
1 I N T R O D U C T I O N
Understanding the formation and evolution of galaxies remains the key goal of extragalactic astronomy. However, delineating the evo-lution of galaxies, from the collapse of the first gas clouds at early times to the assembly of the complex structure we observe in the local Universe, continues to present an immense observational (e.g. Madau & Dickinson2014) and theoretical challenge (e.g. Knebe et al.2015; Somerville & Dav´e2015).
From an observational perspective, the last 15 yr have been a period of unprecedented progress in our understanding of the basic demographics of high-redshift galaxies. As a direct consequence of the availability of deep, multiwavelength, survey fields, we now have a good working knowledge of how the galaxy luminosity func-tion (e.g. McLure et al.2013b; Bowler et al.2015; Finkelstein2016; Mortlock et al.2017), stellar mass function (e.g. Muzzin et al.2013; Tomczak et al.2014; Davidzon et al.2017), and global star forma-tion rate density (SFRD) evolve with redshift (e.g. Magnelli et al.
2013; Novak et al.2017). Indeed, Madau & Dickinson (2014) re-cently demonstrated the consistency (within a factor of∼2) between the integral of current SFRD determinations and direct estimates of the evolution of stellar-mass density.
As a consequence, we can now be confident that the low SFRD we observe locally is approximately the same as it was when the Universe was less than 1 Gyr old (i.e.z7), and that in the in-tervening period the Universe was forming stars up to≥10 times more rapidly. However, despite this, it is still perfectly plausible to argue that the peak in cosmic star formation occurred anywhere in the redshift interval 1.5<z< 3.5, an uncertainty of 2.5 Gyr. Moreover, the results of the latest generation of semi-analytic and hydro-dynamical galaxy simulations (e.g. Genel et al.2014; Hen-riques et al.2015; Somerville & Dav´e2015) demonstrate that, from a theoretical perspective, even reproducing the evolution of the cos-mic SFRD can still be problematic.
Over the last decade it has become established that the majority of cosmic star formation is produced by galaxies lying on the so-called main sequence of star formation (Daddi et al.2007; Elbaz et al.2007; Noeske et al.2007), a roughly linear relationship be-tween star formation rate (SFR) and stellar mass, the normalization of which increases with look-back time. Furthermore, the evolving normalization of the main sequence over the last 10 Gyr is now relatively well determined, with the average SFR at a given stel-lar mass increasing by a factor of30 between the local Universe and redshiftz2 (e.g. Speagle et al.2014; Whitaker et al.2014; Johnston et al.2015). However, at higher redshifts the evolution of the main sequence is still uncertain, despite a clear theoretical prediction that it should mirror the increase in halo gas accretion rates (i.e.∝(1 +z)2.5; Dekel et al.2009). Depending on their
as-sumptions regarding star formation histories, metallicity, dust, and nebular emission, different studies find that the increase in average SFR betweenz=2 andz=6 at a given stellar mass is anything from a factor of2 (e.g. Gonz´alez et al.2014; M´armol-Queralt´o et al.2016) to a factor of25 (e.g. de Barros, Schaerer & Stark
2014); see Stark (2016) for a recent review.
Although the decline of the global SFRD atz≤2 is now well characterized observationally, the relative importance of the differ-ent physical drivers responsible for the quenching of star formation
remains unclear. With varying degrees of hard evidence and specu-lation, feedback from active galactic nuclei (AGNs), stellar winds, merging and environmental/mass-driven quenching have all been widely discussed in the recent literature (e.g. Fabian2012; Conselice
2014; Peng, Maiolino & Cochrane2015). At some level, quenching must be connected to the interplay between gas outflow, the inflow of ‘pristine’ gas, and morphological transformation. However, to date, the precise roles played by the different underlying physical mechanisms still remain uncertain, as does the potential redshift evolution of the quenching process. Indeed, recent evidence based on deep optical and near-IR spectroscopy strongly suggests that the physical properties of star-forming galaxies atz=2–3 are signif-icantly different from their low-redshift counterparts in terms of metallicity,α−enhancement, and ionization parameter (e.g. Cullen et al.2014; Shapley et al.2015; Cullen et al.2016; Steidel et al.
2016; Strom et al.2017). Moreover, recent results at submm and mm-wavelengths withHerscheland ALMA indicate that the dust properties of star-forming galaxies at high redshift may also be sig-nificantly different (e.g. Capak et al.2015; Bouwens et al.2016; Reddy et al.2018), although the current picture is far from clear (e.g. Dunlop et al.2017; Bourne et al.2017; Bowler et al.2018; Koprowski et al.2018; McLure et al.2018).
In summary, it now appears that progress in our understanding of galaxy evolution at high redshift is often less limited by poor statistics than by the systematic uncertainties in our measurements of the crucial physical parameters, caused by the insidious and inter-related degeneracies between age, dust attenuation, and metallicity. It is also clear that substantive progress in addressing these uncer-tainties will rely on combining the best available multiwavelength imaging with deep spectroscopy (e.g. Kurk et al.2013). Within this context, a series of spectroscopic campaigns with VLT+VIMOS, such as the VIMOS Very Deep Survey (VVDS; Le F`evre et al.
2005), the COSMOS spectroscopic survey (zCOSMOS; Lilly et al.
2007), and the VIMOS Ultra Deep Survey (VUDS; Le F`evre et al.
2015), have played a key role in improving our understanding of galaxy evolution, primarily through providing large numbers of spectroscopic redshifts over wide fields. The VANDELS survey is designed to complement and extend the work of these previous campaigns by focusing on ultralong exposures of a relatively small number of galaxies, pre-selected to lie at high redshift using the best available photometric redshift information.
The VANDELS survey is a major new ESO Public Spectro-scopic Survey using the VIMOS spectrograph on the VLT to ob-tain ultradeep, medium resolution, red-optical spectra of 2100 high-redshift galaxies. The survey was allocated 914 h of VIMOS integration time, between 2015 August and 2018 February, and each target galaxy received 20–80 h of on-source integration, ob-tained via repeated observations of the UDS and CDFS multiwave-length survey fields. The fundamental science goal of VANDELS is to move beyond redshift acquisition and obtain a spectroscopic data set deep enough to study the astrophysics of high-redshift galaxy evolution. The VANDELS spectroscopic targets were all pre-selected using high-quality photometric redshifts, with the vast majority (97 per cent) drawn from three main categories. Firstly, VANDELS targeted bright (iAB≤25) star-forming galaxies in the
VAN-DELS spectra are designed to allow stellar metallicity and gas out-flow information to be extracted for individual objects. Secondly, to study the descendants of high-redshift star-forming galaxies, VAN-DELS targeted a complementary sample of massive (HAB≤22.5)
passive galaxies at 1.0≤z≤2.5 (medianz=1.2). Again, in combi-nation with deep multiwavelength photometry and 3D-HSTgrism spectroscopy (Brammer et al.2012), the high SNR spectra provided by VANDELS are designed to provide age/metallicity information and star formation history constraints for individual objects. Thirdly, VANDELS extended to fainter magnitudes and higher redshifts by targeting a large statistical sample of faint star-forming galaxies (25
≤HAB≤27,iAB≤27.5) in the redshift range 3≤z≤7 (medianz =3.5). Throughout the rest of the paper, we will refer to the galax-ies in this sample as Lyman-break galaxgalax-ies (LBGs), although they were not selected via traditional colour–colour criteria (see Section 4). The final3 per cent of VANDELS spectroscopic slits were al-located to AGN candidates orHerschel-detected galaxies withiAB ≤27.5 andz≥2.4 (medianz=2.7).
In this paper, we provide an overview of the VANDELS survey to support the science exploitation of the first data release (DR1) via the ESO Science Archive Facility (archive.eso.org). The structure of the paper is as follows. In Section 2, we provide a brief review of the science cases that provided the principal motivation for VANDELS, along with the multiple legacy science cases which could be facilitated by the data. In Section 3, we describe the rea-soning behind the choice of survey fields. In Section 4, we describe the target selection process, including the generation of photometric catalogues and the determination of robust photometric redshifts. In Section 5, we describe the basic observing strategy before pro-viding brief details of the data reduction and spectroscopic redshift measurement procedures in Section 6. In Section 7, we describe the contents of the first data release, before reviewing the success of the VANDELS target selection process using the on-sky DR1 data in Section 8. A full description of DR1, including a detailed dis-cussion of the observing strategy, data reduction, and spectroscopic redshift measurements is provided in a companion data release pa-per (Pentericci et al.2018). In Section 9, we provide a summary and an overview of the content and timeline for subsequent data releases. Throughout the paper, we refer to total magnitudes quoted in the AB system (Oke & Gunn1983). We assume the following cosmology:M=0.3,=0.7, andH0=70 km s−1Mpc−1, and
adopt a Chabrier (2003) initial mass function (IMF) for calculating stellar masses and SFRs.
2 S C I E N C E M OT I VAT I O N
The primary motivation behind the VANDELS survey was to pro-vide spectra of high-redshift galaxies with sufficiently high SNR to allow absorption line studies both on individual objects and via stacking. Armed with spectra of sufficient quality it should be possi-ble, in combination with excellent multiwavelength photometry, to provide significantly improved constraints on key physical param-eters such as stellar mass, SFR, metallicity, and dust attenuation. As a result, it is clear that the data set provided by VANDELS will have a potentially significant impact on many different areas of high-redshift galaxy evolution science. In this section, we provide a concise overview of the key science goals that motivated the origi-nal VANDELS survey proposal, before briefly reviewing the legacy science case.
2.1 Stellar metallicity and dust attenuation
Tracing the evolution of metallicity is a powerful method of con-straining high-redshift galaxy evolution, due to its direct link to past star formation and sensitivity to interaction (i.e. gas inflow/outflow) with the intergalactic medium (e.g. Mannucci et al.2010). More-over, accurate knowledge of metallicity is essential for deriving accurate SFRs and breaking the degeneracy between age and dust attenuation (e.g. Rogers et al.2014). Consequently, it is clear that extracting constraints on the metallicity and dust attenuation of high-redshift galaxies from VANDELS spectra is important to in-vestigations of the build-up of thestellarmass–metallicity relation, accurately quantifying the peak in cosmic star formation history (e.g. Castellano et al.2014; Dunlop et al.2017), and resolving the current uncertainties regarding the evolution of sSFR atz≥2 (e.g. Stark2016).
Recent studies using stacked spectra of relatively small samples (e.g. Steidel et al.2016) have shown that it is possible to derive accu-rate stellar metallicities from the rest-frame UV spectra of galaxies atz≥2, given a sufficiently high SNR. In addition, Steidel et al. (2016) also demonstrated that rest-frame UV spectra can potentially be used to quantify the impact of binary stars in stellar population synthesis models (e.g. Eldridge & Stanway2016; Stanway, Eldridge & Becker2016) by fitting to the HeIIemission line at 1640 Å.
The high SNR and accurate flux calibration of the VANDELS spectra facilitates the measurement of stellar metallicities using photospheric UV absorption lines (1370–1900 Å), whose equivalent width is sensitive to metallicity and independent of other stellar parameters (e.g. Rix et al.2004; Sommariva et al.2012). Moreover, within the context of dust attenuation, the VANDELS data set also has the potential to differentiate between competing dust reddening laws (e.g. Cullen et al.2018; McLure et al.2018), and to constrain the strength of the 2175 Å bump.
The final VANDELS data set will provide individual and stacked measurements of stellar metallicity based on1000 spectroscop-ically confirmed star-forming galaxies in the redshift range 2.4≤ z≤5.0. These measurements can be compared with the gas-phase metallicities currently being derived forz 2.5 galaxies by the MOSDEF (Shapley et al.2015) and KBSS-MOSFIRE (Strom et al.
2017) surveys and forthcoming observations with theJames Webb Space Telescope(JWST).
2.2 Outflows
Along with stellar-metallicity measurements, a key science goal for VANDELS is to investigate the role of stellar and AGN feedback in quenching star formation at high redshift via studies of outflowing interstellar gas. Over recent years, it has become established that high-velocity outflows are likely to be ubiquitous for star-forming galaxies atz > 1 (e.g. Weiner et al.2009), with mass outflow rates comparable to the rates of star formation (e.g. Bradshaw et al.
2013), and that very compact starbursts can produce outflows with velocities>1000 km s−1, yielding winds that were previously only
thought possible from AGN activity (Diamond-Stanic et al.2012). It seems likely that such outflows are playing a major role in the termination of star formation at high redshift and the build-up of the mass–metallicity relation.
morphology. This offers the prospect of improving our understand-ing of the impact of galactic outflows on star formation atz≥2, directly testing models of the evolving gas reservoir (e.g. Dayal, Ferrara & Dunlop2013) and addressing the origins of the Funda-mental Mass–Metallicity Relation (Mannucci et al.2010). Finally, comparing the outflow velocities of star-forming galaxies with and without hidden AGNs (e.g. Talia et al.2017) will allow the role of AGN feedback in quenching star formation and the build-up of the red sequence to be investigated (e.g. Cimatti et al.2013).
2.3 Massive galaxy assembly and quenching
A key subcomponent of the VANDELS survey was obtaining deep spectroscopy of>250 massive, passive galaxies at 1.0≤z≤2.5. This population holds the key to understanding the quenching mech-anisms responsible for producing the strong colour bi-modality ob-served atz<1, together with the significant evolution in the number density, morphology, and size of passive galaxies observed between z=2 and the present day (e.g. Bruce et al.2012; McLure et al.
2013a; Tomczak et al.2014; van der Wel et al.2014). The physi-cal parameters which will be delivered by the VANDELS spectra offer the prospect of connecting these quenched galaxies with their star-forming progenitors atz≥3 in a self-consistent way.
For the majority of the passive subsample, the VANDELS spec-tra provide a combination of crucial rest-frame UV absorption-line information (e.g. MgUV, 2640 Å/2900 Å breaks) and Balmer-break measurements. Combined with the unrivalled photometric data available in the UDS and CDFS fields, it will be possible to break age/dust/metallicity degeneracies and deliver accurate stel-lar mass, dynamical mass, SFR, metallicity, and age measurements via full spectrophotometric SED fitting (e.g. McLure et al.2013a; Chevallard & Charlot2016; Carnall et al.2017).
2.4 Legacy science
Although the science cases outlined above provided the primary motivation, as an ESO public spectroscopy survey, the greatest strength of VANDELS is arguably its long-term legacy value to the astronomical community. In general terms, by providing high SNR continuum spectroscopy of galaxies which traditionally only have Lyαredshifts at best, VANDELS is guaranteed to open up new parameter space for investigating the physical properties of high-redshift galaxies.
More specifically, the VANDELS spectra provide the opportu-nity to accurately determine the fraction of Lyαemitters amongst the general LBG population in the redshift range 3.0<z<6.0, thereby providing an improved baseline measurement for studies within the reionization epoch (e.g. Curtis-Lake et al.2012; Penter-icci et al.2014; De Barros et al.2017). In addition, VANDELS will also provide large samples of spectroscopically confirmed galaxies atz3 with which to identify and study Lyman continuum emit-ters (e.g. de Barros et al.2016; Shapley et al.2016; Vanzella et al.
2016; Marchi et al.2018). Moreover, combining the VANDELS spectra with near-IR spectroscopy offers the prospect of directly comparing stellar and gas-phase metallicities out toz3.5, and constraining the possible star formation time-scales via quantifying the level ofα-enhancement (e.g. Steidel et al.2016) as a function of stellar mass and SFR. We also note that additional science will be facilitated by the samples of rarerHerschel-detected galaxies and AGNs targeted by VANDELS. For these systems, the deep VAN-DELS spectroscopy will make it possible to assess their physical
conditions (e.g. metallicities, ionizing fluxes, and outflow signa-tures) and compare them with those of less active systems at the same redshifts.
In terms of future follow-up observations, there is an excellent synergy between VANDELS and the expected launch date of the JWSTin 2020. The opportunity to combine ultradeep optical spec-troscopy with the unparalleled near-IR spectroscopic capabilities of NIRSpec will make VANDELS sources an obvious choice for follow-up spectroscopy withJWST. For high multiplex follow-up observations, there is also an excellent overlap between the foot-print of the VANDELS survey within the UDS and CDFS fields and the field of view of ESO’s forthcoming Multi Object Optical and Near-infrared Spectrograph (MOONS) for the VLT (Cirasuolo et al.2014).
Finally, it is also worth noting that the declinations of the UDS and CDFS fields make them ideal for submm and mm follow-up observations with ALMA. One of the key scientific questions that VANDELS will help to address is the evolution of star formation and metallicity in galaxies atz≥2. However, in order to derive a complete picture it will be necessary to obtain dust mass and SFR measurements at long wavelengths, which can now be provided by short, targeted, continuum observations with ALMA.
3 F I E L D C H O I C E
The VANDELS survey targets two fields, the UKIDSS Ultra Deep Survey (UDS: 02:17:38,−05:11:55) and the Chandra Deep Field South (CDFS: 03:32:30,−27:48:28). Both fields were selected on the basis of their observability from Paranal and the quality of their existing multiwavelength ancillary data. We note that the COSMOS field, which was also actively considered for inclusion in VAN-DELS, was targeted with VIMOS by the ESO public spectroscopy survey LEGA-C (van der Wel et al.2016).
Both UDS and CDFS offer deep optical–near-IRHSTimaging provided by the CANDELS survey (Grogin et al.2011; Koekemoer et al.2011) with the CDFS also offering deepHST/ACS optical imaging from the original GOODS survey (Giavalisco et al.2004) and ultradeep X-ray imaging (Luo et al.2017). Moreover, both fields feature the deepest availableSpitzerIRAC imaging on these angular scales from the S-CANDELS survey (Ashby et al.2015) and deep WFC3/IR grism spectroscopy from the public 3D-HSTprogramme (Brammer et al.2012). When combined with the deepest available Y+Kimaging from the HUGS survey (Fontana et al.2014), it is clear that the UDS and CDFS are excellent legacy fields for studying the high-redshift Universe.
Figure 1. Layout of the eight VANDELS pointings, four in UDS and four in CDFS. In each figure, the VIMOS quadrants of a given pointing are shown as a different colour, overlaid on a grey-scale image showing theHST H-band imaging provided by the CANDELS survey (Grogin et al.2011; Koekemoer et al.
2011) in the central regions and ground-basedH-band imaging from the UKIDSS UDS (Almaini et al., in preparation) and VISTA VIDEO (Jarvis et al.2013) surveys covering the wider fields. The total area covered by the eight VIMOS pointings is0.2 deg2. The spectroscopic slits are all placed E-W on the sky, as recommended to minimize slit losses during long VIMOS integrations on fields at these declinations (S´anchez-Janssen et al.2014).
4 TA R G E T S E L E C T I O N
The ideal situation when selecting targets for a spectroscopic survey is to utilize a single photometric catalogue that provides consistent photometry with uniform wavelength coverage over the full survey area. Unfortunately, this was not possible when performing target selection for the VANDELS survey for two fundamental reasons. Firstly, given that VANDELS targeted two separate survey fields, covered by different sets of imaging data, it is clear that target selection had to be performed using a minimum of two independent photometric catalogues.
Secondly, as described above, the footprint of the VANDELS survey within the UDS and CDFS fields covers both the central areas with deepHSTimaging and the wider-field areas covered pri-marily by ground-based imaging (see Fig.1). As a result, the VAN-DELS survey area is effectively divided into four regions: UDS-HST, UDS-GROUND, CDFS-HSTand CDFS-GROUND, each of which required a separate photometric catalogue. Consequently, the first stage in the target selection process was the adoption or production of robust photometric catalogues for each of the four regions.
4.1 Photometric catalogues
Within the two regions covered by the WFC3/IR imaging provided by the CANDELS survey (UDS-HSTand CDFS-HST), we adopted theH-band-selected photometric catalogues produced by the CAN-DELS team (Galametz et al.2013; Guo et al.2013). Both catalogues provide PSF-homogenized photometry for the available ACS and WFC3/IR imaging, in addition to spatial-resolution-matched pho-tometry fromSpitzerIRAC and key ground-based imaging data sets derived using theTFITsoftware package (Laidler et al.2007). We
refer the reader to Galametz et al. (2013) and Guo et al. (2013) for full details of the production of these photometric catalogues for the CANDELS UDS and CANDELS CDFS fields, respectively.
Table 1. Details of the imaging data included in the new photometric cat-alogues generated for the wide-field areas of the CDFS and UDS fields. Column 1 lists the field, column 2 lists the filters, column three lists the median 5σdepths measured within a 2 arcsec diameter aperture, column 4 lists the telescopes on which the imaging was obtained and column 5 lists the paper where the data are presented. For the two filters tagged with a
†in column 2, the 5σ depth refers to the depth measured after theHST
imaging was convolved to match the 1.0 arcsec FWHM spatial resolution of the ground-based imaging in CDFS. The filters listed as ‘IA’ in column 2 are medium-band filters and NB921 is a narrow-band filter. The twoz-band filters listed for the UDS field (z1and z2) refer to imaging obtained with the Suprime-Cam z−filter before and after the CCD detectors were upgraded. The references listed in column 5 correspond to (1) Almaini et al., in prepa-ration, (2) Furusawa et al. (2008), (3) Furusawa et al. (2016), (4) Sobral et al. (2012), (5) Jarvis et al. (2013), (6) Nonino et al. (2009), (7) Cardamone et al. (2010), (8) Rix et al. (2004), and (9) Hsieh et al. (2012).
Field Filter Depth(5σ) Telescope Reference
UDS U 27.0 CFHT 1
B 27.8 Subaru 2
V 27.4 Subaru 2
R 27.2 Subaru 2
i 27.0 Subaru 2
z1 26.0 Subaru 2
z2 26.4 Subaru 3
NB921 25.8 Subaru 4
Y 25.1 VISTA 5
J 25.5 UKIRT 1
H 24.9 UKIRT 1
K 25.1 UKIRT 1
CDFS U 27.8 VLT 6
B 27.1 ESO 2.2-m 7
IA484 26.4 Subaru 7
IA527 26.4 Subaru 7
IA598 26.2 Subaru 7
V606† 26.6 HST 8
IA624 26.0 Subaru 7
IA651 26.3 Subaru 7
R 27.2 VLT 1
IA679 26.2 Subaru 7
IA738 26.1 Subaru 7
IA767 25.1 Subaru 7
z850† 25.6 HST 8
Y 24.5 VISTA 5
J 24.7 CFHT 9
H 23.8 VISTA 5
K 24.1 CFHT 9
PSF-homogenize the images to a common spatial resolution of 1.0 arcsec FWHM using Gaussian convolution kernels. The imaging in the UDS field had a much narrower range of seeing (0.8±0.05 arc-sec FWHM), meaning that PSF-homogenization was not necessary. Following this initial processing, the photometric catalogues were generated withSEXTRACTORv2.8.6 (Bertin & Arnouts1996) in
dual-image mode, using the H-band images as the detection images. Object photometry was measured within 2 arcsec diameter circular apertures, with accurate errors calculated on an object-by-object basis using the aperture-to-aperture variance between local blank-sky apertures (see Mortlock et al.2017for full details).
In Table1, we provide details of the imaging data incorporated within the new photometric catalogues for the UDS-GROUND and CDFS-GROUND regions. All of the depths listed in Table1refer to the data that were publicly available and included in the target selec-tion catalogues in summer 2015. We note that, since that date, many
of the near-IR data sets have increased in depth significantly, par-ticularly within the extended CDFS field. Therefore, to accompany the final data release of the VANDELS survey, we are commit-ted to publicly releasing updacommit-ted photometric catalogues, including deeper data where available, along with photometric redshifts and stellar-population parameters derived via SED fitting.
4.2 Photometric redshifts
A key element of the VANDELS survey strategy was the use of robust photometric-redshift pre-selection. For this process to be successful, it was of paramount importance to either adopt or derive photometric redshifts of equal quality within all four of the VAN-DELS regions. For the two regions covered by deepHSTnear-IR imaging (UDS-HSTand CDFS-HST), we adopted the photometric redshifts made publicly available by the CANDELS survey team (Santini et al.2015). As discussed in Dahlen et al. (2013), these photometric redshifts are derived by optimally combining the inde-pendent estimates produced by a variety of different photometric-redshift codes.
For the wider area regions outside of the CANDELS WFC3/IR imaging footprint, new photometric redshifts were generated within the VANDELS team, based on the new UDS-GROUND and CDFS-GROUND photometric catalogues. These photometric redshifts were derived by taking the median value ofzphotfor each galaxy,
based on a total of 14 different photometric redshift estimates de-rived by different members of the VANDELS team. 14 different photometric redshift estimates were produced using a variety of different publicly available codes (e.g. Arnouts et al.1999; Bol-zonella, Miralles & Pell´o2000; Feldmann et al.2006; Ilbert et al.
2006; Brammer, van Dokkum & Coppi2008) and in-house software (e.g. Fontana et al.2000; McLure et al.2011), using a wide variety of different SED templates, star formation histories, metallicities, and emission-line prescriptions.
In order to optimize their respective photometric-redshift codes, each member of the VANDELS team taking part in the photometric-redshift exercise was initially allocated a spectroscopic training set for the UDS-GROUND and CDFS-GROUND regions. Each train-ing set consisted of approximately 1000 high-quality spectroscopic redshifts, and were used by each team member to optimize the performance of their code. The second step in the process was to allocate spectroscopic validation sets to each member of the photometric-redshift team. The spectroscopic validation sets were identical in size and quality to the corresponding training sets, the only difference being that the spectroscopic redshifts were not dis-closed to the team members. The accuracy of the results on these blind validation sets was used to ensure that each set of photometric-redshift estimates was adding useful information to the overall re-sult. For the UDS-GROUND region the robust spectroscopic red-shifts used for training and validation purposes were drawn from the VIPERS survey (Guzzo et al.2014), the 3D-HSTsurvey (Momcheva et al.2016), and the UDSz survey (Almaini et al., in preparation). For the CDFS-GROUND region, the robust spectroscopic redshifts were drawn from the large number of spectroscopic redshift cam-paigns previously undertaken within the field (e.g. Le F`evre et al.
2005; Mignoli et al.2005; Vanzella et al.2008; Balestra et al.2010; Cooper et al.2012; Le F`evre et al.2013; Momcheva et al.2016).
To quantify the quality of the photometric redshift estimates we calculate three statistics. To quantify any systematic offset between the photometric and spectroscopic redshifts we calculate the bias, which we define as the median value of dz=(zspec−zphot)/(1 +zspec).
calculateσdz using the robust median absolute deviation (MAD) estimator. Finally, we also calculate the fraction of catastrophic outliers, where an object is considered to be a catastrophic outlier if|dz|>0.15. Based on the spectroscopic validation sets, 14 indi-vidual photometric-redshift runs produced bias values in the range 0.03–0.003, values of σdz in the range 0.018–0.058, and
catas-trophic outlier rates between 2 per cent and 16 per cent. The equiva-lent statistics for the adopted median combinedzphotresults are bias =0.008,σdz=0.017 and a catastrophic outlier rate of 1.9 per cent.
Compared to the best-performing individual photometric redshift run, the process of median combination has produced a 15 per cent improvement in bothσdzand the catastrophic outlier fraction, with the same level of bias. In Fig.2, we show the accuracy of the final photometric redshifts adopted for the wider area UDS-GROUND and CDFS-GROUND regions, based on the spectroscopic valida-tion sets.
Within the final spectroscopic validation sets used to define the accuracy of the VANDELS photometric redshifts, 44 per cent of the galaxies also had photometric redshifts determined by the CAN-DELS team. As a result, it was possible to perform a useful com-parison of the quality of our new photometric redshifts, based on the photometric data listed in Table1, and the photometric red-shifts derived by the CANDELS survey team based on a combi-nation of deepHST imaging, ground-based imaging andSpitzer IRAC imaging. For the objects in common, the VANDELS photo-metric redshifts have a catastrophic outlier rate of 2.0 per cent and σdz=0.018, virtually identical to the statistics for the full valida-tion sets. The equivalent statistics for the CANDELS photometric redshifts are an outlier rate of 2.2 per cent andσdz= 0.023 (see bottom panel of Fig.2). The results of this comparison suggest that the VANDELS photometric redshifts are slightly more accurate that the photometric redshifts derived by the CANDELS survey team.
In summary, we are confident that by combining the results of the CANDELS and VANDELS teams we were able to produce a final set of photometric redshifts of consistent quality over all four of the VANDELS regions, irrespective of the availability of deep HSTimaging data.
4.3 Star–galaxy separation
In order to produce the cleanest selection catalogue possible, it was necessary to remove potential stellar sources. Due to the high angular resolution provided by HST, this was a straightforward process for the photometric catalogues within the UDS-HSTand CDFS-HSTregions. All sources originating from the Galametz et al. (2013) and Guo et al. (2013) catalogues were excluded if they had a SEXTRACTOR (Bertin & Arnouts1996) stellaricity parameter of
CLASS STAR≥0.98. Following the application of this criteria to remove stellar sources, it was confirmed that the UDS-HSTand CDFS-HSTphotometric catalogues no longer displayed a stellar locus in a variety of different colour–colour diagrams.
For the two ground-based photometric catalogues, all sources consistent with the stellar locus on theBzKdiagram (Daddi et al.
2004) were excluded. In addition, all remaining sources had their SED fitted with a range of stellar templates drawn from the SpeX archive (Burgasser2014).1All sources which produced an improved
SED fit with a stellar template and were consistent with being a point source at ground-based resolution were excluded. It should be noted that<5 per cent of the objects in the two ground-based photometric
[image:7.595.340.514.55.643.2]1http://pono.ucsd.edu/adam/browndwarfs/spexprism/
Figure 2. Top: photometric redshifts derived by the VANDELS team com-pared to robust spectroscopic redshifts in the wide-area region of the UDS (red data points are catastrophic outliers with|dz|>0.15). Middle: equiva-lent plot for the wide-area region of the CDFS. Bottom: photometric redshift versus spectroscopic redshift for those objects in the top two panels for which photometric redshifts derived by the CANDELS survey team were available (see the text for more details). The catastrophic outlier fraction,σdzand bias
catalogues were excluded as being potentially stellar. Moreover, it is noteworthy that 98 per cent of the excluded objects hadzphot<1
and would therefore not even have entered the VANDELS parent sample (see Section 4.5).
4.4 Physical properties and rest-frame photometry
At this stage, a final run of SED fitting was carried out in order to derive SFRs, stellar masses, and rest-frame photometry. This SED fitting was performed using Bruzual & Charlot (2003) templates with solar metallicity and no nebular emission. Exponentially de-clining star formation histories were employed, withτin the range 0.3≤τ≤20 Gyr, and ages were constrained to lie between 50 Myr and the age of the Universe at the redshift of interest. Dust at-tenuation was described using the Calzetti et al. (2000) starburst attenuation law, withAVin the range 0.0≤AV≤2.5, and IGM
absorption was accounted for using the Madau (1995) prescription. These parameters were adopted following the results of Wuyts et al. (2011), who showed that this parameter set does a reasonable job of recovering the total SFR of main-sequence galaxies, provided that they are not heavily obscured. We also note that this SED pa-rameter set is very similar to that adopted by the 3D-HSTsurvey team (Momcheva et al.2016) and delivers stellar-mass estimates in good agreement with those derived for the CANDELS CDFS and UDS photometric catalogues by Santini et al. (2015). During the SED-fitting process the redshift was fixed at the median value derived from the multiple photometric-redshift runs described in Section 4.2.
Further cleaning of the sample was carried out based on the results of the SED fitting. For each of the four photometric catalogues, plots of the SED fits for the objects comprising the worst 10 per cent of fits (i.e. highestχ2), were visually examined. Objects that were revealed
by this process to have unreliable or discrepant photometry were excluded from the sample (4 per cent of objects).
4.5 Parent spectroscopic sample
Armed with catalogues providing robust photometry, photometric redshifts, and physical properties, it was then possible to select the parent sample ofpotentialspectroscopic targets. The vast majority (i.e.97 per cent) of the potential targets were drawn from three main target categories:
(i) Bright star-forming galaxies in the range 2.4≤z≤5.5 (ii) LBGs in the range 3.0≤z≤7.0
(iii) Passive galaxies in the range 1.0≤z≤2.5
while the remaining 3 per cent of potential targets were either known or candidate AGNs (2 per cent), or Herschel-detected galaxies (1 per cent).
4.5.1 Bright star-forming galaxies
This subsample consists of bright star-forming galaxies within the redshift range 2.4≤ z≤5.5 with i≤ 25. The redshift range is designed to ensure that the UV absorption features necessary for investigating stellar metallicity lie within the 0.48< λ <1.0μm wavelength coverage of the VANDELS spectra. The magnitude con-straint is designed to ensure that the final VANDELS spectra have sufficient SNR to allow absorption-line studies on individual ob-jects. In order to be classified as actively star forming, each member of this subsample was required to satisfy: sSFR>0.1 Gyr−1, where
sSFR is the specific star formation rate (SFR/M∗) derived from the SED fitting described in Section 4.4. In reality, 99 per cent of this subsample satisfy the criteria: sSFR>0.6 Gyr−1, ensuring that they
are fully consistent with being located on the main sequence of star formation (see Fig.3).
4.5.2 Lyman-break galaxies
This subsample consists of fainter star-forming galaxies within the redshift range 3.0≤z≤7.0. The vast majority (95 per cent) of the galaxies in this subsample lie in the redshift interval 3.0≤z≤5.5 and in theHSTregions have 25≤H≤27i≤27.5. In the wider field regions these objects havei≤26.0. The remainder of the subsample consists of galaxies selected to have redshifts in the range 5.5≤z
≤7.0 and, in theHSTregions, to have 25≤H≤27 andz≤26.5 (UDS-HST) orz850≤27.0 (CDFS-HST). In the wider field regions,
these objects havez≤26.0 andz850≤25.0 in the UDS-GROUND
and CDFS-GROUND regions, respectively. The change in selection criteria for thez≥5.5 targets was mandatory, due to the impact of IGM absorption oni-band photometry at these redshifts. Once again, the formal requirement for these galaxies to be classified as star forming was that sSFR>0.1 Gyr−1. However, in reality,
99 per cent of the galaxies in this subsample have sSFR>0.3 Gyr−1
and provide a good sampling of the main sequence of star formation (see Fig.3).
4.5.3 Passive galaxies
This subsample consists of UVJ-selected (Williams et al.2009; Whitaker et al.2011) passive galaxies in the redshift interval 1.0≤ z≤2.5 withH≤22.5i≤25. TheH-band magnitude constraint for this subsample is designed to impose an effective lower stellar-mass limit of log(M∗/M )≥10. As with the bright star-forming galaxy subsample, thei-band magnitude constraint is designed to ensure that the final individual spectra are deep enough to allow detailed absorption-line studies. The UVJselection was performed using the rest-frame photometry derived from the SED fitting described in Section 4.4. Galaxies which satisfied all of the following criteria were identified as passive:
U−V >0.88(V−J)+0.49, U−V >1.2,
V −J <1.6. (1)
We note here that although these galaxies are classified as passive, it is not the case that they are necessarily expected to exhibit no on-going star formation. Based on the results of the SED fitting, 94 per cent of theUVJ-selected passive galaxies do have estimated values of sSFR<0.1 Gyr−1, clearly separating them from
main-sequence galaxies. However, 3 per cent of theUVJ-selected passive galaxies have sSFR >0.3 Gyr−1, placing them in a location on
the SFR−M∗diagram consistent with the low-SFR tail of the main sequence. This is not unexpected, given thatUVJselection is in-evitably vulnerable to contamination by dusty star-forming galaxies at some level.
4.5.4 AGNs and Herschel-detected galaxies
The candidate AGNs all lie within the CDFS field and were selected based on either a power-law SED shape in the mid-IR (Chang et al.
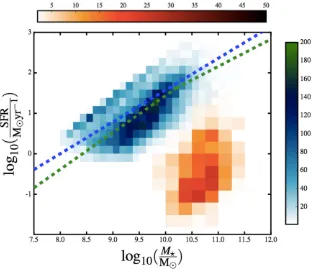
Figure 3. The distribution of the VANDELS parent sample on the SFR−M∗plane. The blue-shaded 2D histogram shows the location of the star-forming galaxies (including additional candidate AGNs andHerschelsources) in the redshift interval 2.4≤z≤7.0 (median redshiftz=3.4). The red-shaded histogram shows the location of the passive galaxy subsample in the redshift interval 1.0≤z≤2.5 (median redshiftz=1.2). The horizontal and vertical colour bars indicate the number of galaxies within each 2D bin. The blue and green dashed lines show determinations of the main sequence of star formation atz=3 and
z=2.5 by Speagle et al. (2014) and Whitaker et al. (2014), respectively. It can be seen that the VANDELS galaxies successfully sample the main sequence of star formation and the area of parameter space occupied by massive, quenched galaxies. In total, the VANDELS spectroscopic sample spans 3.5 dex in stellar mass and 4.5 dex in SFR.
et al.2014). Within the CDFS-HSTregion the candidate AGNs were restricted toz≥2.4 andi≤27.5, while in the CDFS-GROUND region they were restricted toz≥2.4 andi≤26. The Herschel-detected galaxies all lie within the UDS-HSTand CDFS-HST re-gions, havez≥2.4 andi≤27.5, and are detected in at least one Herschel band (cf. Pannella et al.2015). We note here that the photometric redshifts derived for the AGN candidates are based on SED fitting with the same set of galaxy templates discussed in Section 4.2, and are therefore not expected to be as accurate as the photometric redshifts derived for the rest of the VANDELS sample.
4.5.5 Summary
Following the application of the selection criteria outlined above, a final visual check was performed on the entire sample to ensure that no image artefacts had survived the selection procedure. The resulting parent sample of potential VANDELS spectroscopic tar-gets consisted of 9656 galaxies, split roughly equally between the UDS and CDFS fields. The distribution of the parent sample on the SFR−M∗plane is shown in Fig.3, from which it can be seen that the adopted selection criteria successfully isolated the main sequence of star formation and the high stellar-mass quenched population. Overall, the parent VANDELS sample spans 3.5 dex in stellar mass and 4.5 dex in SFR.
4.6 Final spectroscopic sample
Using the parent sample as input, extensive simulation work was undertaken in order to maximize the number of slits which could be allocated across the eight VIMOS pointings. In addition to the
total number of spectroscopic slits, the primary goal of this exper-imentation was to maximize the number of slits allocated to bright star-forming galaxies and massive passive galaxies, the two classes of targets with the lowest surface densities. Apart from the photo-metric redshift and magnitude constraints outlined above, the only additional constraint applied to the simulations was the desire to allocate the slits to objects requiring 20, 40, and 80 h of integration in an approximately 1:2:1 ratio. Crucially, during the slit allocation process, no additional prioritization was applied based on source brightness, redshift, or position.
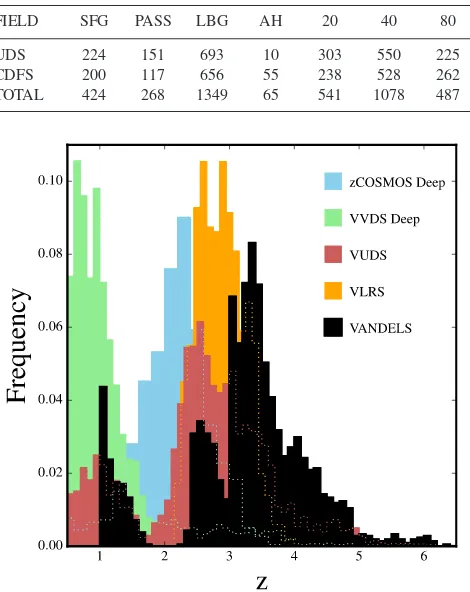
The overall result of the target selection process was a final sample of 2106 galaxies being allocated to spectroscopic slits. The distri-bution of the spectroscopic slits between the two survey fields, the different target classifications and the different amounts of required exposure time are detailed in Table2. The final spectroscopic sam-ples of bright star-forming galaxies and passive galaxies are random (approximately 1 in 4) subsamples drawn from the corresponding targets within the input parent spectroscopic sample. Likewise, the final spectroscopic sample of LBGs is a random (approximately 1 in 5) subsample of the Lyman-break targets within the parent spec-troscopic sample. In Fig.4, we compare the photometric-redshift distribution of the final VANDELS sample to the spectroscopic red-shift distributions of comparable large-scale spectroscopic surveys previously carried out using the VIMOS spectrograph.
5 O B S E RV I N G S T R AT E G Y
Table 2. The distribution of the 2106 spectroscopic slits targeted within the VANDELS survey between the two survey fields, the different target classifications and the different integration times. The first column lists the survey field. Column 2 lists the number of slits allocated to bright star-forming galaxies (SFG), column 3 lists the number of slits allocated to massive, passive galaxies (PASS), column 4 lists the number of slits allocated to fainter star-forming galaxies (LBG), and the fifth column lists the number of slits allocated to AGN candidates orHerschel-detected galaxies (AH). Note that all of the AGN candidates were selected in the CDFS field due to the availability of ultradeep X-ray data (Luo et al.2017).The final three columns list the number of slits allocated to objects which require 20, 40, and 80 h of on-source integration, respectively.
FIELD SFG PASS LBG AH 20 40 80
UDS 224 151 693 10 303 550 225
CDFS 200 117 656 55 238 528 262
TOTAL 424 268 1349 65 541 1078 487
Figure 4. A comparison of the redshift distributions of large-scale spectro-scopic surveys carried out with the VIMOS spectrograph. The deep com-ponent of the zCOSMOS survey (Lilly et al.2007) is shown in blue and the deep component of the VIMOS VLT Deep Survey (VVDS) is shown in green (Le F`evre et al.2013). The VIMOS Ultra Deep Survey (VUDS) is shown in red (Le F`evre et al.2015) and the VLT LBG Redshift Survey (VLRS) is shown in orange (Bielby et al.2013). The black histogram shows the photometric redshift distribution of the final sample of 2106 galaxies targeted by the VANDELS survey.
four overlapping pointings in CDFS. In both fields, the pointing centres were chosen to provide both contiguous coverage and to fully sample the central areas with deepHSTimaging. Fully cover-ing the deepHSTimaging was essential in order to allow access to a high surface density of faintz≥3 targets.
5.1 Signal-to-noise requirements
The VANDELS observing strategy was designed to provide consis-tently high-SNR continuum detections for the bright star-forming and passive galaxy subsamples. For those objects with i ≤ 24.5, the final 1D spectra are designed to have an SNR in the range 15–20 per resolution element, within the wavelength range
6000< λ <7400 Å, based on 20 or 40 h of on-source integration (where one resolution element is 4 pixels, or 10.2 Å). For the faintest objects in these subsamples (i25), the final spectra are designed to have SNR10, based on 80 h of integration. For the fainter (H
≤27i≤27.5) LBGs atz≥3, the VANDELS observing strategy is designed to provide SNR≥3 in the continuum, and a consistent Lyαemission-line detection limit of2×10−18erg s−1cm−2(5σ,
integrated over a line profile with FWHM=10 Å).
In order to achieve the desired SNR, targets were allocated 20, 40, or 80 h of on-source integration according to two different exposure time schemes. The bright star-forming and passive galaxies were allocated 20 h of integration time ifi2≤23.75, 40 h in the range
23.75 <i2 ≤24.25, and 80 h in the range 24.25< i2≤ 25.00
(wherei2is thei-band magnitude measured in a 2 arcsec diameter
circular aperture at ground-based resolution2). The LBGs, AGN
candidates,andHerschel-detected galaxies were allocated 20, 40, or 80 h of integration time within the following three magnitude ranges: 25.00<i2≤25.50, 25.50<i2≤26.00, and 26.00<i2 ≤27.50. The highest redshift LBG targets atz≥5.5 followed the same exposure time scheme as the main LBG subsample, except with thei-band magnitudes replaced withz-band magnitudes.
5.2 Nested slit allocation policy
To accommodate the required range of exposure times, the VAN-DELS survey employed a nested slit allocation strategy. Each of the eight VIMOS pointings was observed using four sets of masks, with each set receiving 20 h of on-source integration time. Consequently, objects which required 80 h of integration were retained on all four masks, those requiring 40 h were included on two masks, and those requiring 20 h only appeared on a single mask. As can be seen from Table2, approximately 75 per cent of the galaxies targeted by the VANDELS survey received 40+ h of on-source integration.
5.3 Observations
All of the VANDELS observations used the MR grism+GG475 or-der sorting filter, 1 arcsec slit widths and a minimum slit length of 7 arcsec. This set-up provides wavelength coverage of 480−1000 nm, with a dispersion of 0.255 nm pixel−1and a mean spectral resolution
ofR580. All of the slits were oriented E-W on the sky, as recom-mended for minimizing slit losses when pursuing long integrations of the UDS and CDFS fields from Paranal (S´anchez-Janssen et al.
2014). To ensure that the VIMOS slits were placed with maximum accuracy, shortR-band pre-images were obtained in service mode during P94, in order to properly account for VIMOS focal plane distortions and allocate 1–2 bright reference stars to each VIMOS mask.
All observations were obtained using observing blocks (OBs) designed to deliver a total of 1 h of on-source integration time. Each OB consisted of three integrations of 1200 s, obtained in a three-point dither pattern, with offsets of 0,−4 pixels, and +8 pix-els, corresponding to 0.0, −0.82, and +1.64 arcsec, respectively. One arc frame and one flat-field frame were obtained for calibration purposes after the execution of two consecutive OBs. A spectropho-tometric standard was observed at least once every seven nights and at least once per observing run. Further details of the VANDELS
2The typical offset betweeni
observations can be found in the data release paper (Pentericci et al.
2018).
6 DATA R E D U C T I O N A N D S P E C T R O S C O P I C R E D S H I F T M E A S U R E M E N T
The reduction of the VANDELS data set is performed with the fully automatedEASYLIFEpipeline, starting from the raw data and ending with the fully wavelength- and flux-calibrated 1D spectra. TheEASYLIFEpipeline (Garilli et al.2012) is an updated version of the originalVIPGIsystem (Scodeggio et al.2005). The originalVIPGI
system was used to reduce all the spectra from the VVDS (Le F`evre et al.2005; Garilli et al.2008), zCosmos (Lilly et al.2007), and VUDS surveys (Le F`evre et al.2015), while the updated system
EASYLIFE was used to reduce all of the spectra from the recently
completed VIPERS survey (Guzzo et al.2014). A detailed descrip-tion of the full data reducdescrip-tion process can be found in Pentericci et al. (2018).
In addition to the reduced spectra, it is a requirement of the ESO public survey agreement for VANDELS that the team provide spec-troscopic redshift measurements for each of the spectra released via the ESO data archive. The spectroscopic redshift measurements were made by a dedicated group of VANDELS team members using theEZsoftware package (Garilli et al.2010). The core algorithm
of EZis cross-correlation using galaxy templates that, for
VAN-DELS spectra, were predominantly derived from previous VIMOS surveys. The redshift for each galaxy was independently measured by two team members, who were subsequently required to reach agreement on the spectroscopic redshift measurement and the as-sociated quality flag. As a final check, the spectroscopic redshifts and associated quality flags for all spectra released in DR1 were independently checked by the two Co-PIs.
The quality of the spectroscopic redshift measurements was quan-tified using the system originally employed by the VVDS team (Le F`evre et al.2005), in which every galaxy is allocated a quality flag of 0, 1, 2, 3, 4, or 9. Galaxies for which it was not possible to mea-sure a spectroscopic redshift are allocated flag=0, while galaxies with spectroscopic redshift measurements that are believed to be 50 per cent or 75 per cent reliable are allocated flag=1 and flag=2, respectively. The galaxies with the most secure redshifts, based on multiple absorption/emission features, are allocated flag=3 or 4, depending on whether their redshift measurements are believed to be 95 per cent or 100 per cent reliable. Galaxies which have redshift measurements based on a single emission line, in most cases Ly–α, are allocated flag=9.
7 DATA R E L E A S E O N E
The first public data release for the VANDELS survey (DR1) was made by the ESO Science Archive Facility (archive.eso.org) on 2017 September 29, and features spectra obtained during the first VANDELS observing season from 2015 August until 2016 Febru-ary; ESO run numbers 194.A-2003(E-K). The data release includes fully flux- and calibrated 1D spectra, plus wavelength-calibrated 2D spectra, for all the VANDELS targets that received their total scheduled integration time during season one. In addi-tion, the data release also includes spectra for those targets that had received 50 per cent of their scheduled integration time by the end of season one.
In total, DR1 contains spectra for 879 galaxies, 415 from the CDFS pointings and 464 from the UDS pointings. In Fig.5,we show finding charts for the CDFS and UDS fields which show
the locations of the full VANDELS target list in blue, with the locations of those VANDELS targets featured in DR1 in white. In addition to the reduced spectra, DR1 also features an associated catalogue which provides coordinates, optical+nearIR photometry, photometric redshifts, spectroscopic redshifts, and spectroscopic redshift quality flags for each target. In Figs 6and 7, we show examples that illustrate the potential for using the DR1 data set to produce high-SNR stacked spectra.
8 TA R G E T S E L E C T I O N AC C U R AC Y
Based on the extensive testing described in Section 4.2, it was determined that the typical accuracy of the photometric redshifts adopted in the VANDELS target selection was σdz0.02, with
a catastrophic outlier rate of≤2 per cent. However, as is often the case, the samples of galaxies used to validate the photometric red-shifts havei-band magnitudes that are significantly brighter than those of the real VANDELS targets. Indeed, the median i-band magnitude of the galaxies used to validate the photometric redshifts is two magnitudes brighter than the mediani-band magnitude of the DR1 galaxies. Consequently, it is clearly of interest to use the DR1 galaxies to review the accuracy of the selection process based on real, on-sky data.
In the top panel of Fig.8,we show a plot ofzphot versuszspec
for the galaxies released in DR1 with spectroscopic redshift quality flags 3 and 4, which together comprise 55 per cent of the full DR1 sample. For these galaxies,σdz=0.026 with a catastrophic outlier
rate of only 0.8 per cent. The middle panel in Fig.8is the equivalent plot for those DR1 galaxies with spectroscopic redshift quality flags 1, 2, and 9, which haveσdz=0.036 and a catastrophic outlier rate of 3.6 per cent. Taken together, the full DR1 sample (i.e. flags 1–9) has an accuracy ofσdz=0.029 with a catastrophic outlier rate of
2.1 per cent.
It is worth noting that the fraction of catastrophic outliers is actu-ally significantly biased by the inclusion of a relatively small number of AGN candidates andHerschel-detected galaxies. If the statistics are restricted to the 97 per cent of objects drawn from the three principal classifications of VANDELS targets (see Section 4.5), the accuracy isσdz=0.028 and the catastrophic outlier rate is a re-markably low 1.2 per cent (flags 1–9). Given the relative faintness of the VANDELS targets, these figures provide a clear validation of the accuracy and robustness of the target selection procedure described in Section 4. Moreover, the low number of catastrophic outliers amongst those objects allocated spectroscopic quality flags 1 and 2 suggests that the VANDELS quality flags are somewhat conservative. In reality, for many of the flag 1 and 2 objects we can be very confident that the spectroscopic redshift lies within a rela-tively narrow range, but the spectral features simply do not allow competing redshift solutions to be reliably differentiated.
In the bottom panel of Fig.8, the redshift distribution of the galaxies released in DR1 is shown as the filled blue histogram, based on their measured spectroscopic redshifts. The histogram indicated by the thin grey line shows the redshift distribution of the VANDELS parent sample, based on the input photometric redshifts. A comparison of the two clearly indicates that the spectroscopic redshift distribution of the real VANDELS spectra is in very close agreement to the distribution predicted by the photometric-redshift selection procedure.
Figure 6. Median-stacked spectra of LBGs from VANDELS DR1. The top panel shows a stack of 105 LBGs from DR1 with robust redshifts in the range 3.0 ≤z≤4.0 (median redshiftz=3.5). The middle panel shows a stack of the 61/105 galaxies that display Lyαin emission. The bottom panel shows a stack of the 44/105 galaxies that display Lyαin absorption. In all three panels, common absorption (dotted lines) and emission (dot–dashed lines) features are highlighted.
explore how the accuracy of the VANDELS photometric redshifts varies as a function of target magnitude.
All but three of the VANDELS galaxies released in DR1 have i-band magnitudes in the range 22.25≤i≤27.50.3Consequently,
Fig.9shows a comparison between spectroscopic and photometric redshifts in three i-band magnitude ranges: 22.25 < i≤ 25.00,
3One passive galaxy hasi=22.1, and two further galaxies withi≥27.5 were selected asz≥5.5 LBGs based on theirz850-band magnitudes.
Figure 7. Median-stacked spectra of passive galaxies from VANDELS DR1. The top panel shows a stack of 65 passive galaxies from DR1 with robust redshifts in the range 1.0≤z≤2.5 (median redshiftz=1.2). The middle panel shows a stack of the 33/65 passive galaxies that display [OII] emission. The bottom panel shows a stack of the 32/65 passive galaxies without [OII] emission. Common absorption (dotted lines) and emission (dot–dashed lines) features are highlighted in each panel.
It is clear from Fig. 9 that in terms of bias and catastrophic outlier rate, the VANDELS photometric redshifts perform very well within the two brighter magnitude bins. Over the full mag-nitude range, there is a gradual decrease in the photometric red-shift accuracy, withσdzdropping from 0.025 to 0.036. However,
given the factor of 5 drop in brightness between the top and bottom panels, the decrease in accuracy is not particularly dra-matic. In contrast, it is clear from the bottom panel of Fig. 9
that the photometric redshifts for the faintest VANDELS targets withi> 25.75 (15 per cent of the DR1 objects) do show a no-table increase in both the fraction of catastrophic outliers and the bias.
Figure 8. The top panel shows a comparison between the input photomet-ric redshifts and measured spectroscopic redshifts for DR1 galaxies with redshift quality flags 3 and 4. The middle panel is the equivalent plot for DR1 galaxies with redshift quality flags 1, 2, and 9. Those galaxies falling outside the dashed lines are catastrophic outliers with|dz|>0.15. In both panels, candidate AGNs andHerschel-detected galaxies are plotted as open symbols. The bottom panel shows a comparison of the spectroscopic redshift distribution of the DR1 galaxies (solid blue histogram) and the photometric redshift distribution of the full VANDELS parent sample (open histogram).
Figure 9. The top panel shows a comparison between the input photomet-ric redshifts and measured spectroscopic redshifts for DR1 galaxies in the magnitude range 22.25<i≤25.00. The middle and bottom panels show the equivalent plots for DR1 galaxies in the magnitude ranges 25.00<i≤
[image:15.595.345.514.55.644.2]rate of 2.1 per cent compares favourably with the results from the spectroscopic validation sets (σdz=0.025 and 1.9 per cent
catas-trophic outliers), despite thei-band magnitudes of the VANDELS galaxies being two magnitudes fainter than the validation objects, on average. Interestingly, compared to the DR1 data, the overall systematic bias of the photometric redshifts is only 0.003±0.002. This is actually better than the expectation from the spectroscopic validation data (0.008±0.001), albeit only at the2.5σ level.
9 S U M M A RY A N D T I M E L I N E
In this paper, we have provided an overview of the VANDELS spectroscopic survey, focusing on the scientific motivation, survey design, and target selection. The original motivation for the VAN-DELS survey was to move beyond simple redshift determination and to provide the high-SNR spectra necessary to study the phys-ical properties of the high-redshift galaxy population. The spectra released in DR1 demonstrate that the original goals of the survey are within reach, and that the VIMOS spectrograph can be used to integrate for 20–80 h without the final SNR being dominated by systematic effects. Combined with the unparalleled ancillary data available within the CDFS and UDS survey fields, it is clear that the VANDELS survey has the potential to become a key legacy data set for studying the evolution of high-redshift galaxies for many years to come.
The observations for the VANDELS survey were fully completed in 2018 February. The second ESO public data release is currently scheduled for 2018 June and will feature all of the spectra com-pleted, or 50 per cent comcom-pleted, by the end of the second VAN-DELS observing season in 2017 February. The third ESO public data release is scheduled for 2019 June and will consist of the entire VANDELS spectroscopic data set.
A final data release is currently scheduled for 2020 June and will formally mark the end of the project. It is currently intended that the final data release will feature a re-reduction of the entire spectro-scopic data set, incorporating improvements in the data reduction process which have been implemented over the course of the sur-vey. In addition, the VANDELS team is committed to release two final catalogues to enhance the legacy value of the survey. The first catalogue will contain physical properties for each target (i.e. stellar masses, SFRs, dust attenuation, and rest-frame colours) based on SED fitting of the final data set. The second catalogue will provide measurements of the fluxes and equivalent widths of significant emission/absorption features identified in the VANDELS spectra, along with their corresponding uncertainties.
AC K N OW L E D G E M E N T S
Based on data products from observations made with ESO Tele-scopes at the La Silla Paranal Observatory under programme ID 194.A-2003(E-K). We thank the ESO staff for their continuous support for the VANDELS survey, particularly the Paranal staff, who helped us to conduct the observations, and the ESO user sup-port group in Garching. RJM, AM, EMQ, and DJM acknowledge funding from the European Research Council, via the award of an ERC Consolidator Grant (P.I. R. McLure). AC acknowledges grants PRIN-MIUR 2015 and ASI n.I/023/12/0. RA acknowledges support from the ERC Advanced Grant 695671 ‘QUENCH’. FB acknowledges the support by Fundac¸˜ao para a Ciˆencia e a Tecnolo-gia (FCT) via the postdoctoral fellowship SFRH/BPD/103958/2014 and through the research grant UID/FIS/04434/2013. PC
acknowl-edges support from CONICYT through the project FONDECYT regular 1150216.
R E F E R E N C E S
Arnouts S., Cristiani S., Moscardini L., Matarrese S., Lucchin F., Fontana A., Giallongo E., 1999,MNRAS, 310, 540
Ashby M. L. N. et al., 2015,ApJS, 218, 33 Balestra I. et al., 2010,A&A, 512, A12 Bertin E., Arnouts S., 1996,A&AS, 117, 393 Bielby R. et al., 2013,MNRAS, 430, 425
Bolzonella M., Miralles J.-M., Pell´o R., 2000, A&A, 363, 476 Bourne N. et al., 2017,MNRAS, 467, 1360
Bouwens R. J. et al., 2016,ApJ, 833, 72 Bowler R. A. A. et al., 2015,MNRAS, 452, 1817
Bowler R. A. A., Bourne N., Dunlop J. S., McLure R. M., McLeod D. J., 2018, preprint (arXiv:1802.05720)
Bradshaw E. J. et al., 2013,MNRAS, 433, 194
Brammer G. B., van Dokkum P. G., Coppi P., 2008,ApJ, 686, 1503 Brammer G. B. et al., 2012,ApJS, 200, 13
Bruce V. A. et al., 2012,MNRAS, 427, 1666 Bruzual G., Charlot S., 2003,MNRAS, 344, 1000
Burgasser A. J., 2014, in H.P. Singh, P. Prugniel and I. Vauglin, eds, in International Workshop on Stellar Spectral Libraries, ASI Conference Series 11, p. 7
Calzetti D., Armus L., Bohlin R. C., Kinney A. L., Koornneef J., Storchi-Bergmann T., 2000,ApJ, 533, 682
Capak P. L. et al., 2015,Nature, 522, 455 Cardamone C. N. et al., 2010,ApJS, 189, 270
Carnall A. C., McLure R. J., Dunlop J. S., Dav´e R., 2017, preprint (arXiv: 1712.04452)
Castellano M. et al., 2014,A&A, 566, A19 Chabrier G., 2003,PASP, 115, 763 Chang Y.-Y. et al., 2017,ApJS, 233, 19
Chevallard J., Charlot S., 2016,MNRAS, 462, 1415 Cimatti A. et al., 2013,ApJ, 779, L13
Cirasuolo M. et al., 2014, in Ramsay S. K., McLean I. S., Takami H., eds, Proc. SPIE Conf. Ser., Vol. 9147, Ground-based and Airborne Instru-mentation for Astronomy V. SPIE, Bellingham, p. 91470N
Conselice C. J., 2014,ARA&A, 52, 291 Cooper M. C. et al., 2012,MNRAS, 425, 2116
Cullen F., Cirasuolo M., McLure R. J., Dunlop J. S., Bowler R. A. A., 2014,
MNRAS, 440, 2300
Cullen F., Cirasuolo M., Kewley L. J., McLure R. J., Dunlop J. S., Bowler R. A. A., 2016,MNRAS, 460, 3002
Cullen F. et al., 2018, MNRAS, 476, 3218 Curtis-Lake E. et al., 2012,MNRAS, 422, 1425
de Barros S., Schaerer D., Stark D. P., 2014,A&A, 563, A81 de Barros S. et al., 2016,A&A, 585, A51
Daddi E., Cimatti A., Renzini A., Fontana A., Mignoli M., Pozzetti L., Tozzi P., Zamorani G., 2004,ApJ, 617, 746
Daddi E. et al., 2007,ApJ, 670, 156 Dahlen T. et al., 2013,ApJ, 775, 93 Davidzon I. et al., 2017,A&A, 605, A70
Dayal P., Ferrara A., Dunlop J. S., 2013,MNRAS, 430, 2891 De Barros S. et al., 2017,A&A, 608, A123
Dekel A. et al., 2009,Nature, 457, 451
Diamond-Stanic A. M., Moustakas J., Tremonti C. A., Coil A. L., Hickox R. C., Robaina A. R., Rudnick G. H., Sell P. H., 2012,ApJ, 755, L26 Dunlop J. S. et al., 2017,MNRAS, 466, 861
Elbaz D. et al., 2007,A&A, 468, 33
Eldridge J. J., Stanway E. R., 2016,MNRAS, 462, 3302 Fabian A. C., 2012,ARA&A, 50, 455
Feldmann R. et al., 2006,MNRAS, 372, 565 Finkelstein S. L., 2016,PASA, 33, e037