The Architecture of EssB, an Integral Membrane
Component of the Type VII Secretion System
Martin Zoltner,
1David G. Norman,
1Paul K. Fyfe,
1Hassane El Mkami,
1,2Tracy Palmer,
1and William N. Hunter
1,*
1College of Life Sciences, University of Dundee, Dow Street, Dundee DD1 5EH, UK 2School of Physics and Astronomy, University of St. Andrews, St. Andrews FE2 4KM, UK
*Correspondence:[email protected] http://dx.doi.org/10.1016/j.str.2013.02.007
SUMMARY
The membrane-bound EssB is an integral and
essen-tial component of the bacterial type VII secretion
system that can contribute to pathogenicity. The
architecture
of
Geobacillus thermodenitrificans
EssB has been investigated by combining
crystallo-graphic and EPR spectroscopic methods. The
protein forms a dimer that straddles the cytoplasmic
membrane. A helical fold is observed for the
C-terminal segment, which is positioned on the
exte-rior of the membrane. This segment contributes most
to dimer formation. The N-terminal segment displays
a structure related to the pseudokinase fold and may
contribute to function by recognizing substrates or
secretion system partners. The remaining part of
EssB may serve as an anchor point for the secretion
apparatus, which is embedded in the cytoplasmic
membrane with the C-terminal domain protruding
out to interact with partner proteins or components
of peptidoglycan.
INTRODUCTION
The Type VII or ESX1 secretion system (T7SS, ess) is key to the
virulence of important pathogens and to general aspects of
gram-positive bacterial fitness (
Abdallah et al., 2007
). Regarding
Mycobacterium tuberculosis
, the loss of T7SS genes contributes
to the attenuated phenotype of the vaccine strain
M. bovis
Bacille Calmette-Gue´rin (
Lewis et al., 2003
).
Staphylococcus
aureus
also depends on the T7SS to establish persistent
infec-tions in a murine pathogenicity model (
Burts et al., 2005
). Despite
the recognized importance of this secretion system to
pathogen-esis and recent studies to elucidate composition (
Houben et al.,
2012
), there is a paucity of data on the architecture and structure
of the T7SS.
T7SS gene clusters are widely distributed in gram-positive
bacteria of the phyla Actinobacteria and Firmicutes (
Pallen,
2002
). These clusters all share the presence of genes encoding
ESAT-6 (early secreted antigenic target of 6 kDa) family proteins,
the prototypic substrate for the T7SS, and an integral membrane
protein called EssC, which possesses FtsK/SpoIIIE-type ATPase
domains. All other genes in T7SS genomic loci, inclusive of those
reportedly essential for a functional secretion system (
Abdallah
et al., 2007
;
Burts et al., 2005
), appear to be phylum-specific.
At least four genes encode proteins essential for the secretion
of the ESAT-6-family proteins in
S. aureus
(
Chen et al., 2012
).
One of these is EssB, a 50-kDa bitopic integral membrane
protein that is conserved among T7SS gene clusters in
Firmicutes.
We targeted EssB from the thermophilic gram-positive
bacte-rium
Geobacillus thermodenitrificans
for characterization. Our
bioinformatics analyses predict two similar sized segments on
either side of the membrane (
Zoltner et al., 2013
).
Membrane-bound EssB and isolated soluble fragments were expressed,
purified, and crystallized (
Figure 1
A). The crystals of
detergent-solubilized dimeric EssB
Dwere poorly ordered, but structures
of the N- and C-terminal soluble fragments, 25 kDa EssB-N
and 19 kDa EssB-C
D, were determined by single-wavelength
anomalous diffraction (SAD) and refined to 1.7 A˚ and 2.4 A˚
reso-lution, respectively. EssB-N is dimeric in solution but crystallizes
as a monomer. It displays a fold related to that of protein kinases,
which is composed of two globular domains separated by a
cleft (
Zoltner et al., 2013
). The dimeric EssB-C
Ddisplays a helical
fold that extends over the cytoplasmic membrane, and the
struc-ture suggests that this segment contributes significantly to the
dimerization of EssB. The topside surface of EssB-C
D, with
a cradle-like structure, exhibits large grooves, formed between
helical bundles, well matched to interact with helical features
of binding partners.
We exploited pulsed electron double resonance (PELDOR)
spectroscopy (
Milov et al., 1981
;
Pannier et al., 2000
) to obtain
distances between pairs of single nitroxide paramagnetic spin
labels (
Jeschke et al., 2002
;
Schiemann and Prisner, 2007
) in
the detergent-solubilized EssB dimer. The crystal structures
provided information on positions for label placement, and the
PELDOR data, in combination with the X-ray structures, guided
construction of a model depicting the overall architecture of this
key, membrane-bound component of the T7SS.
RESULTS AND DISCUSSION
Overview
A recent study of recombinant
S. aureus
EssB reported that
the full-length protein was membrane bound but that soluble
aggregates formed in the cytoplasm (
Chen et al., 2012
). The
soluble material was investigated; surprisingly, no effort to
characterize the membrane-bound protein is described.
of 31 residues to provide EssB
Dwas designed to circumvent
disorder at the C terminus that might compromise crystal order
(growth). A determined crystallization effort produced crystals
of EssB
D, which although of good appearance and size up
to 80
m
m, only diffracted to 9 A˚ resolution at a synchrotron
microfocus beamline (European Synchrotron Radiation Facility
[ESRF], ID23-2). We were unable to index the poor quality
diffraction.
Three constructs encoding isolated fragments were prepared.
These are EssB-N, the N-terminal fragment with predicted
cytoplasmic localization; the C-terminal fragment EssB-C,
pre-dicted to reside on the
trans
-side of the membrane; and the
C-terminally truncated version EssB-C
D. The yields for each of
these were around 10 mg/l of bacterial culture.
We determined the crystal structure of EssB-N using a
construct comprising the entire predicted cytoplasmic fragment
(Ser2 to Asp214). For the extracytosolic fragment, two structures
were determined. First, a low-resolution structure of EssB-C
comprising residues Ala241 to Lys428 was obtained and
re-vealed that the C terminus is inherently flexible because it is
not resolved in the electron density (discussed later). This polar
C-terminal region is divergent, variable in length, or completely
absent in orthologs. A higher resolution structure of EssB-C
D,
residues Ala241 to Gln397, resulted when the flexible C terminus
was omitted from the recombinant polypeptide.
Structure of EssB-N
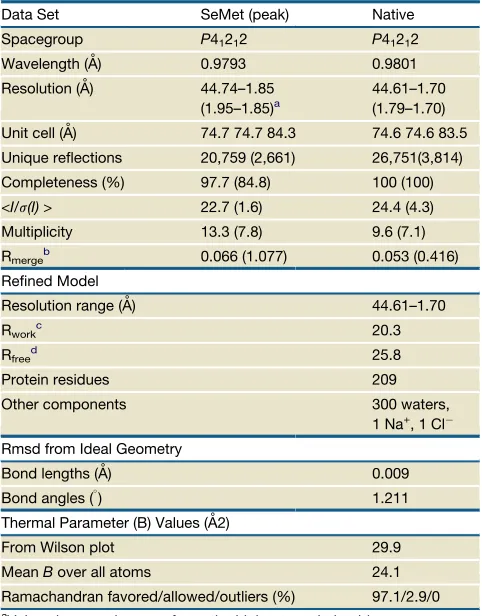
The structure of EssB-N was determined at 1.7 A˚ resolution (
Fig-ure 1
B;
Table 1
;
Figure S1
A available online). Initial phases were
derived from a SAD experiment using SeMet-substituted
protein. The asymmetric unit consists of a single polypeptide
folded into an elongated structure, approximately 55 A˚ long
and 35 A˚ wide, which consists of two domains. The N-terminal
domain is dominated by a four-stranded antiparallel
b
sheet.
The strand
b
4 leads into a loop connecting the domains. The
C-terminal domain consists of a helical bundle formed by two
antiparallel helix pairs,
a
4/
a
5 and
a
7/
a
8. A cleft, approximately
30 A˚ deep, is formed between the two domains, blocked at
one side by the interdomain connecting loop that links
b
4 to
b
5. A further interdomain contact is made by a loop interspersed
between
a
2 and
b
3.
The EssB-N segment resembles the bilobal structure of
ATP-dependent protein kinases, i.e., an N-terminal domain or
N-lobe with a
b
sheet packed against an intersecting
a
-helix,
and a predominantly
a
-helical C-terminal domain (C-lobe;
[image:2.603.95.518.98.370.2]Zoltner et al., 2013
). In protein kinases, the cleft formed between
the two lobes contains the catalytic machinery and is where
ATP and protein substrates bind. The most similar structural
EssB-N ortholog identified is the catalytic domain of the
mammalian Tyr kinase Abl in an inactive conformation (Protein
Data Bank [PDB] code 2G1T;
Levinson et al., 2006
), which
Figure 1. Structures of the Soluble N- and C-Terminal Fragments of EssB(A) Schematic of EssB, predicted domain borders. EssB is a 50-kDa integral membrane protein with a single predicted transmembrane segment (TM, gray cylinder) spanning Ile219 to Phe240. The constructs and the nomenclature used in this study are given.
(B) Cartoon representation of EssB-N. Helices are green, andbstrands are yellow. A sodium ion (bronze) and a chloride ion (gray) are shown as spheres. The loop connecting the N- and C-terminal domains is identified.
exhibits 9% sequence identity. An overlay provides a Z-score of
10.4 and a root-mean-square deviation (rmsd) of 4.4 A˚ for an
alignment of 173 C
a
-atoms. These values suggest a distant
evolutionary relationship but the catalytic residues are absent
from EssB-N. However, at the C-terminal inner surface of the
EssB cleft, as well as at the domain contact area, a remarkable
degree of structural similarity is evident (
Zoltner et al., 2013
).
This region of the protein kinase structures is key for substrate
recognition and binding (
Levinson et al., 2006
) and suggests
a function for EssB-N as a protein-protein interaction module
using the stable modular entity of the protein kinase fold.
EssB-N of
G. thermodenitrificans
and
S. aureus
(
Zoltner et al.,
2013
) share a sequence identity of approximately 20%. A
struc-tural alignment (
Figure S1
C) of 170 C
a
-atoms has a Z-score of
16.7 and an rmsd of 2.5 A˚. The
G. thermodenitrificans
EssB-N
structure is more complete with 209 residues, in contrast to
176 residues in the
S. aureus
protein. The extended model
serves to identify an additional strand,
b
1 of the N-terminal
domain
b
sheet, which is preceded by a short helix, and also
to extend the C-terminal helix toward the membrane. These
or-thologous fragments crystallize as a monomer despite forming
stable dimers in solution (discussed later). In both structures,
the contacts formed with symmetry-related molecules appear
unlikely to support the existence of thermodynamically stable
dimers in solution. In addition, there is no combination of
mole-cules with an orientation relevant to membrane association,
i.e., with the C-terminal sections directed in a similar way.
To analyze the influence of external conditions on the
quater-nary structure of EssB-N, we subjected the protein to size
exclusion chromatography in different buffer systems. EssB-N
elutes as a single species with a molecular weight that
corre-sponds to a dimer in various buffers (see
Experimental
Proce-dures
), which is consistent with its migration with an apparent
mass of 45 kDa in BN-PAGE (
Figure S2
A). However, in 0.1 M
citrate buffer pH 5.5, the buffer used in crystallization, more
than 10% of the eluted EssB-N is monomeric (
Figure S2
B). The
transition to a monomeric state appears to be influenced by
a combination of low pH and high ionic strength, which matches
the crystallization conditions used for EssB-N where we may
have been selecting out the monomer. The observed stability
of the EssB-N dimer suggests biological relevance. However,
conditions in the bacterial cytosol, in terms of ionic strength for
example, might allow a conditional association of the
cyto-plasmic domains in the EssB dimer responsive to the binding
of other factors.
The Extracellular EssB-C
The EssB-C polypeptide gave poorly ordered, highly anisotropic
tetragonal crystals. Nevertheless, a low-resolution crystal
struc-ture was obtained by SAD methods. The strucstruc-ture indicated
that the C terminus was disordered; hence, a truncated protein,
EssB-C
D, was targeted with the aim of improving diffraction
quality. This proved successful; more ordered monoclinic
crystals were obtained. SeMet SAD phasing was repeated and
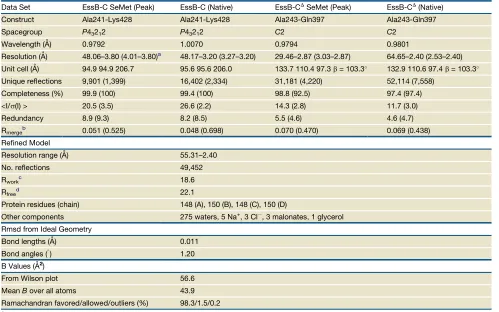
the native structure was refined to 2.4 A˚ resolution (
Table 2
).
Structure of EssB-C
DEssB-C
Ddisplays an all-helical architecture not previously
described and there is no example of this topology in the PDB.
Approximately 75% of residues are in
a
helices arranged into
a series of coiled-coil motifs that are predicted to extend across
the cytoplasmic membrane (
Figures 1
C and
S1
B). The structure
starts at
a
1, with Ala241 at the transmembrane border,
poten-tially the continuation of the helix that transcends the membrane
(
Figures 1
C and
S1
B). The antiparallel coiled-coil of
a
1 and
a
2 is
followed by a loop facing the membrane surface. This loop,
carrying a turn of 3
10-helix, connects to the next antiparallel
side-by-side helix pair (
a
3,
a
4). At the lower end of
a
4, a sodium:
malonate ion pair is bound. The four remaining helices,
a
5–
a
8,
form two sets of antiparallel coiled-coils.
[image:3.603.53.294.114.422.2]Size exclusion chromatography indicated that EssB, EssB-C,
and EssB-C
Dform dimers. The asymmetric unit of EssB-C
Dconsists of four molecules, which are labeled A to D. An average
rmsd value of 1.38 A˚ is obtained from the least-squares fit of the
C
a
positions of individual subunits with each other. This relatively
high value is strongly influenced by a few large differences, in
excess of 10 A˚, at the C-terminal segments but overall the
molecules are similar. To identify the relevant dimer, we sought
an interface common to each of the four molecules with the
important consideration that the dimeric association should be
Table 1. Crystallographic Statistics for EssB-NData Set SeMet (peak) Native
Spacegroup P41212 P41212
Wavelength (A˚) 0.9793 0.9801
Resolution (A˚) 44.74–1.85 (1.95–1.85)a
44.61–1.70 (1.79–1.70)
Unit cell (A˚) 74.7 74.7 84.3 74.6 74.6 83.5
Unique reflections 20,759 (2,661) 26,751(3,814)
Completeness (%) 97.7 (84.8) 100 (100)
<I/s(I)> 22.7 (1.6) 24.4 (4.3)
Multiplicity 13.3 (7.8) 9.6 (7.1)
Rmergeb 0.066 (1.077) 0.053 (0.416)
Refined Model
Resolution range (A˚) 44.61–1.70
Rworkc 20.3
Rfreed 25.8
Protein residues 209
Other components 300 waters,
1 Na+, 1 Cl
Rmsd from Ideal Geometry
Bond lengths (A˚) 0.009
Bond angles () 1.211
Thermal Parameter (B) Values (A˚2)
From Wilson plot 29.9
MeanBover all atoms 24.1
Ramachandran favored/allowed/outliers (%) 97.1/2.9/0
a
Values in parentheses refer to the highest resolution bin.
b
Rmerge=PhPijj(h,i)< I(h) >PhPiI(h,i). c
Rwork=PhkljjFojjFcjj/PjFoj,whereFois the observed structure-factor amplitude and theFcis the structure-factor amplitude calculated from the model.
dR
freeis the same as Rworkexcept only calculated using a subset, 5%, of
compatible with each molecule having the same orientation with
respect to the membrane. The relevant dimer is generated by
crystallographic symmetry operations
x+1/2, y
1/2,
z+1
and
x, y,
z (AB and DC pairings), respectively. The dimer is
primarily formed by interacting residues on
a
1,
a
2, and the
loop linking
a
4 to
a
5. The interaction surface uses only about
7% of the solvent-accessible surface, a low value compared
with dimers of similar sized polypeptides. However, with a
solva-tion free energy gain of
14 kcal/M (estimated using PISA;
Krissinel and Henrick, 2007
), the dimer is predicted to be
thermo-dynamically stable. Moreover, in the full-length protein, the
transmembrane helices would be expected to also contribute
to dimerization. One of the interface regions formed between
molecules in the asymmetric unit has a larger interaction surface
area of approximately 12%. However, with a solvation free
energy gain of only
5.1 kcal/M, it is predicted to be less stable
than the dimer depicted in
Figures 1
C,
S1
B, and
S2
C. The same
dimer identified in the monoclinic crystal structure is also evident
in the low-resolution tetragonal structure that contains two
EssB-C molecules in the asymmetric unit. It is generated by
the crystallographic symmetry operation
y
1/2, x
1/2, z
1/4.
The assignment of this as the physiologic dimer is further
corroborated by PELDOR spectroscopy (see below).
PELDOR Spectroscopy
We applied PELDOR spectroscopy to measure intermolecular
distances in the dimeric, membrane-bound EssB
Dto obtain
information about the overall architecture (
Table 3
;
Figure S2
D).
The structures were inspected for surface-exposed,
non-conserved residues within secondary structure elements at
which cysteines labeled with MTSSL might be placed without
disruption of the structures and that might usefully provide
information on orientation. Eight such positions were identified
and tested.
The three endogenous cysteines were first mutated to serine
to prevent labeling at those sites, then eight single-site mutations
were constructed, the encoded proteins purified and labeled.
One position was in the extracellular domain (Glu273) and the
rest in the intracellular domain (Asp54, Glu59, Arg86, Ser93,
Asn115, Glu139, and Glu197;
Figure 2
;
Movie S1
). These
mutated proteins eluted as a single species identical to the
wild-type dimer during size exclusion chromatography.
[image:4.603.59.558.114.426.2]The extracytosolic E273C showed a major distance
distribu-tion of 44 A˚, compared to the value of 43 A˚ derived from the
EssB-C
Dcrystal structure (
Figure S3
A), essentially confirming
the assigned dimer structure (
Figures 1
C and
S1
B) and ruling
out the physiologic relevance of the crystallographic dimer
Table 2. Crystallographic Statistics for EssB-C and EssB-CDData Set EssB-C SeMet (Peak) EssB-C (Native) EssB-CDSeMet (Peak) EssB-CD(Native)
Construct Ala241-Lys428 Ala241-Lys428 Ala243-Gln397 Ala243-Gln397
Spacegroup P43212 P43212 C2 C2
Wavelength (A˚) 0.9792 1.0070 0.9794 0.9801
Resolution (A˚) 48.06–3.80 (4.01–3.80)a 48.17–3.20 (3.27–3.20) 29.46–2.87 (3.03–2.87) 64.65–2.40 (2.53–2.40)
Unit cell (A˚) 94.9 94.9 206.7 95.6 95.6 206.0 133.7 110.4 97.3b= 103.3 132.9 110.6 97.4b= 103.3
Unique reflections 9,901 (1,399) 16,402 (2,334) 31,181 (4,220) 52,114 (7,558)
Completeness (%) 99.9 (100) 99.4 (100) 98.8 (92.5) 97.4 (97.4)
<I/s(I) > 20.5 (3.5) 26.6 (2.2) 14.3 (2.8) 11.7 (3.0)
Redundancy 8.9 (9.3) 8.2 (8.5) 5.5 (4.6) 4.6 (4.7)
Rmergeb 0.051 (0.525) 0.048 (0.698) 0.070 (0.470) 0.069 (0.438)
Refined Model
Resolution range (A˚) 55.31–2.40
No. reflections 49,452
Rworkc 18.6
Rfreed 22.1
Protein residues (chain) 148 (A), 150 (B), 148 (C), 150 (D)
Other components 275 waters, 5 Na+, 3 Cl, 3 malonates, 1 glycerol
Rmsd from Ideal Geometry
Bond lengths (A˚) 0.011
Bond angles () 1.20
B Values (A˚2)
From Wilson plot 56.6
MeanBover all atoms 43.9
Ramachandran favored/allowed/outliers (%) 98.3/1.5/0.2
aValues in parentheses refer to the highest resolution bin. bR
merge=PhPijj(h,i)< I(h) >PhPiI(h,i). c
Rwork=PhkljjFojjFcjj/PjFoj,whereFois the observed structure-factor amplitude and theFcis the structure-factor amplitude calculated from the model.
d
contained in the asymmetric unit (AD pairing) with a theoretical
interspin distance of 49 A˚.
The remaining positions were investigated in the context
of the whole, detergent-solubilized, EssB
Ddimer (
Figure S3
B)
and two (D54C and S93C) were additionally investigated as
the isolated intracellular fragment EssB-N. These two mutants
were analyzed by size exclusion chromatography before and
after MTSSL-labeling. While D54C eluted solely as a dimer,
for S93C a small fraction of EssB-N monomer could be
de-tected after labeling (data not shown). The large MTSSL-group
at position 93 appears to destabilize the dimer, a strong
indica-tion that Ser93 is indeed located on or near the dimer interface
(
Figure 2
B).
Of the seven intracellular positions investigated, four (D54C,
E59C, E139C, and E197C) provided PELDOR data showing clear
oscillations (
Figure S3
C). Position E139C, on
a
5, exhibits an
in-terspin distance of 58 A˚ (
Figure S3
B). The data are comparable
to those obtained for the E273C mutant but with a significantly
smaller oscillation depth that might indicate partial dimerization,
yet under the conditions used in SEC, this sample appeared only
to be a dimer. The D54C label, localized on
b
3, was investigated
in both solubilized EssB
Dand EssB-N. The distance distributions
are virtually identical with an interspin distance of 55 A˚ (
Fig-ure S3
B). PELDOR data from EssB-N show oscillations with
a much smaller oscillation depth than the solubilized EssB
sug-gesting that, under these conditions, not all the sample is in
a dimeric form. Such an observation is consistent with other
data on this isolated fragment. The mutant E59C provided
a separation of 66 A˚, and E197C, located on the C-terminal
a
8,
provided a distance of 38 A˚ (
Figure S3
B).
The PELDOR data derived on the remaining three positions
(R86C, S93C, and N115C) were devoid of oscillations (
Fig-ure S3
D), and Tikhonov regularization did not resolve clear
distance distributions. This may have been a consequence of
steric restrictions on the spin labels because they occur at
the interface (
Figure 2
B). The PELDOR data are consistent
with the dimerization of the membrane-bound protein, and
the extra- and intracellular domains. Well-defined distances
(
Table 3
;
Figures S2
D and
S3
E) informed the generation of
an EssB dimer model by docking the intracellular monomers
with restrained, rigid body, molecular dynamics in conjunction
with the fixed structure of the extracellular segment EssB-C
D(
Figure 2
;
Movie S1
).
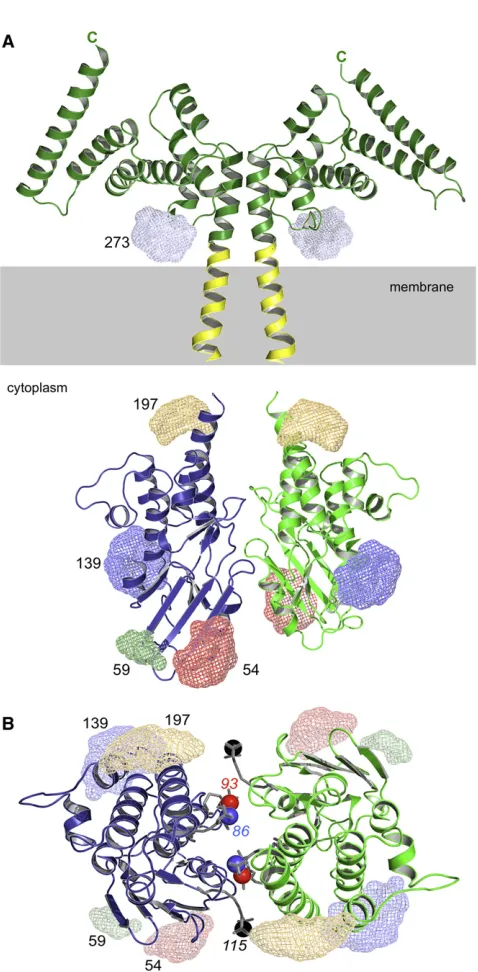
Figure 2. Predicted Architecture of EssB with Spin-Labeling Positions
(A) Schematic EssB model in cartoon representation showing positions of MTSSL-labels (see alsoMovie S1). Ensembles of possible MTSSL nitrogen positions on the five mutant positions are shown as color-coded mesh for clarity (D54C in red, E59C in green, E139C in dark blue, E197C in orange, and E273C in light blue). The model is assembled with the EssB-C dimer and modeled TM-segment (yellow) extended down through the membrane toward the docked cytoplasmic EssB-N fragments. The gray box denotes the cytoplasmic membrane. See alsoMovie S1.
[image:5.603.305.544.87.573.2](B) Topview of the EssB-N model. Three additional label positions, producing oscillation free data, are shown in sticks with the paramagnetic amine oxide drawn as color-coded sphere (R86C in blue, S93C in red, and N115C in black). Also seeFigure S2.
Table 3. Summary of PELDOR Results
Spin Label Site
Simulated Distance Distributions from Final Model
Experimental Distance Distributions
Modal Distances
Width at Half-Height
Modal Distances
Width at Half-Height
D54C 53 8.3 55 4.4
E59C 66 3.8 65 4.6
E139C 58 5.9 58 7.0
E197C 39 6.0 38 6.2
E273C 43 6.1 44 6.2
The Architecture of EssB and Functional Implications
EssB
Dand the extracellular segment, EssB-C
Dare stable
homo-dimers. The PELDOR distance measurements unambiguously
confirmed this for the intracellular domain both in the intact,
detergent-solubilized and isolated forms. EssB-N appears to
be a conditional dimer. Modeling, based on the structures and
incorporating PELDOR distance restraints, generated an EssB
dimer model consistent with the distance information and with
data from labels that appear to disrupt the dimer (
Figure 2
;
Movie
S1
). To emphasize this last point, the labeling at positions 86, 93,
and 115 did not provide distance information to assist with
modeling of the dimer. All three mutant/labels appear to
destabi-lize the dimer, and the model locates them at the interface,
perfectly positioned to disrupt the association (
Figure 2
B).
The extracellular segment dimer observed in the structure of
EssB-C
Dis retained, as previously detailed, and embedded in
the membrane by a predicted transmembrane helix. Based on
secondary structure predictions and sequence conservation
(
Zoltner et al., 2013
;
Figure S3
F), a similar topology and dimer
are predicted for orthologs. On the other side of the membrane,
a weaker dimeric association is formed by EssB-N. Here, the
contact interface uses
a
2,
a
4,
a
8, and three loop regions
(Asn115-Pro120, Val95-Leu103, and Glu44-Ile49;
Figure S3
G).
The interaction surface is primarily polar and composed of
alternating acidic and basic patches that exhibit a charge
complementarity between monomers. The middle section of
the EssB-N interface is more hydrophobic in nature and a basic
patch is positioned near
b
6, recessed in a groove.
[image:6.603.60.383.91.284.2]The N-terminal segment of EssB may not be a major
contrib-utor to the stability of the dimeric, intact protein. Interactions
involving the transmembrane helices and the C-terminal
segment appear to be more important in this context.
Neverthe-less, sequence alignments and secondary structure prediction
indicate that the helical regions and loops that appear to
partic-ipate in the dimerization of EssB-N are conserved (
Figure S3
H).
Our model and characterization of EssB offers clues to the
mode of action as part of the T7SS complex. The C-terminal
portion is directed out from the cytoplasmic membrane. If we
consider the flexible C-terminal tail, then this may extend
approximately 50 A˚ above the membrane. EssB is then
posi-tioned to interact with components of the T7SS, and/or with
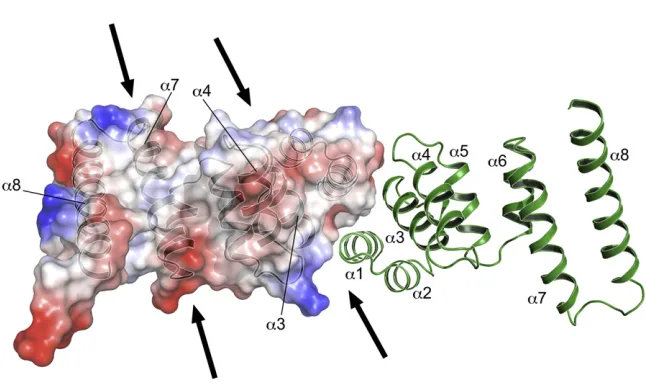
Figure 3. A van der Waals Surface Repre-sentation of the EssB-CDDimer
Topview of the EssB-CD dimer. One subunit is depicted with ribbon format and the other has the van der Waals surface shown and colored according to chemical properties: red, acidic; blue, basic; white, nonpolar. The arrows mark entrances to grooves on the surface of the protein. Also seeFigure S3.
components of the cell wall. The topside
surface exhibits two large grooves, one
formed between
a
4 and
a
8 and one
between the helix pair
a
3-
a
4, above the
dimer interface (
Figure 3
). A mixture of
polar and nonpolar groups lines the
grooves and might facilitate interactions
with partners. The C-terminal segment could therefore function
like a toggle-bolt to tether and localize EssB and relevant T7SS
complexes to the membrane.
The structural similarity of the cytoplasmic segment to Ser/Thr
protein kinases, fluxional behavior, and overall topology of
EssB is reminiscent of receptor protein kinases such as the
eukaryote-like Ser-Thr kinases found in
M. tuberculosis
, PknB,
and PknG (
Pereira et al., 2011
). Ligand binding to an extracellular
domain promotes conformational changes resulting in receptor
dimerization or stabilization of a loose dimer, which in turn allows
trans
-activation of the cytoplasmic kinase domains with the
over-all result that a signal transduces the membrane. The fluxional
behavior of EssB-N appears to be an intrinsic property that might
be exploited by a molecular partner, which could be a substrate
of T7SS or a component of the secretion apparatus itself.
It is intriguing that encoded on the T7SS gene cluster is EssC,
a large, membrane-bound ATPase. The ATPase activity resides
on the C-terminal part of the protein and can provide the motive
force for the T7SS. The N-terminal domain of EssC, predicted
to reside in the cytoplasm and for which a structure has been
determined (
Tanaka et al., 2007
), displays a combination of
two forkhead-associated (FHA) domains. FHA domains are
phosphopeptide, in particular phosphothreonine, recognition
motifs. They are widely dispersed from prokaryotes to higher
eukaryotes and are implicated in intracellular signal
transduc-tion, protein transport, and protein degradation (
Liang and Van
Doren, 2008
). Most recently, they have also been implicated in
the function of the type III secretion system (
McDowell et al.,
2011
). The FHA domains of EssC may interact with other proteins
in the ESX-1 secretion system, with substrates or regulators for
example. It is intriguing to find a phosphothreonine-type peptide
recognition module in one component of the T7SS and a Ser/Thr
kinase protein recognition fold on another component, with both
being membrane localized. It will be of interest to confirm if and
how these domains interact.
EXPERIMENTAL PROCEDURES
Cloning and Mutagenesis
EssBD, a construct encoding a product truncated by 31 C-terminal residues, were cloned into theSal1/Xho1site of a modified pET27b vector (Novagen). Constructs to produce the predicted cytoplasmic fragment EssB-N (Figure 1A) and the two fragments predicted to reside transof the cyto-plasmic membrane (Figure 1A), EssB-C (residues 241–428) and EssB-CD (residues 241–397), were generated accordingly. All primers are listed in
Table S1A. The plasmids produce an N-terminal hexahistidine-tagged protein with a tobacco etch virus (TEV) protease cleavage site. Site-directed mutants D54C, E59C, R86C, S93C, N115C, E139C, E197C, and E273C were generated using the Quikchange protocol (Stratagene) after first preparing a template where three endogenous cysteine residues (at posi-tions 48, 108, and 171) were changed to serines. Mutagenesis primers are detailed inTable S1B. The integrity of all constructs was verified by sequencing.
Recombinant Protein Production
For isolation of EssB-N, EssB-C, and EssB-CD, freshly transformedE. coli BL21(DE3) pLysS cells were cultivated at 37C in 10 ml Luria-Bertani (LB) broth containing 50mg/ml kanamycin and 15mg/ml chloramphenicol, which was used as inoculum of the 1 l main culture (grown at 37C in selective LB contain-ing 1 mM MgCl2and 0.5 mM CaCl2in baffled 5 l Erlenmeyer flasks). The temperature was lowered to 25C when the cells had reached an optical density of 0.6 atl= 600 nm and expression was induced with 1 mM iso-propyl-b-D-thiogalactopyranoside (IPTG).
Cells were harvested after 14 hr, resuspended in buffer A (50 mM sodium phosphate pH 8.0, 300 mM NaCl, 1 mM dithiothreitol, 10% [w/v] glycerol) with the addition of protease inhibitors (Roche), and the homogenates were centrifuged at 150,000 g for 60 min at 4C. The resulting supernatants were passed through a 0.45-mm filter, imidazole was added to a concentra-tion of 25 mM, and the sample was loaded on a 5-ml HisTrap HP column (GE Healthcare). After a four-column volume (CV) washing step in the same buffer, the recombinant proteins were eluted applying a linear imid-azole gradient (25–250 mM over 18 CV). The buffer was exchanged using a spin concentrator (Sartorius) to buffer B (50 mM Tris-HCl pH 7.8, 2 mM dithiothreitol, 10% [w/v] glycerol). After a 14-hr incubation with His-tagged TEV protease (4C, molar ratio of 1:20 TEV:recombinant proteins), the samples were passed through a HisTrap HP column equilibrated with buffer A to remove the protease, cleaved peptide, and noncleaved material. The cleaved products retain a Gly-Ala-Ser sequence at the N terminus. Fractions containing the target protein were collected, concentrated, and passed through a size exclusion chromatography column (HR 16/60, Superdex75 prep grade, GE Healthcare, CV = 120 ml) equilibrated with buffer C (10 mM sodium phosphate pH 7.8, 20 mM NaCl, 0.5 mMtris [2-carbox-yethyl]phosphine hydrochloride). The size exclusion chromatography columns had previously been calibrated with molecular mass standards (thyroglobulin, 670 kDa;g-globulin, 158 kDa; serum albumin, 67 kDa; oval-bumin, 44 kDa; myoglobin, 17 kDa; vitamin B12, 1 kDa). SeMet-substituted proteins were obtained using a metabolic inhibition protocol and purified following the protocols just outlined. The mass of the recombinant proteins and the incorporation of SeMet were monitored by matrix-assisted laser-desorption/ionization time-of-flight mass spectrometry (MALDI-TOF-MS) analysis performed at the University of Dundee ‘‘Fingerprints’’ Proteomics Facility using an Applied Biosystems Voyager DE-STR spectrometer.
Preparation of the membrane-bound EssB and EssBDfollowed the same protocol except that LEMO21(DE3) cells (Wagner et al., 2008) were used, the culture medium contained 100mM L-rhamnose, and gene expression was induced with 400mM IPTG. Membranes were isolated by centrifuga-tion at 150,000 g for 60 min at 4C, resuspended in buffer A, and solubi-lized withn-dodecyl-b-D-maltoside (DDM) at a protein-to-detergent mass ratio of 1:3 for 2 hr at 20C. Nonsolubilized material was removed by centrifugation and the resulting supernatant was purified essentially as described above except that all buffers were supplemented with 0.02% (w/V) DDM and 1mg/ml 1,2-dioleoyl-sn-glycero-3-phosphocholine (DOPC; a kind gift from Lipoid AG, Steinhausen, Switzerland), and an HR 30/100 GL Superdex200 column (CV = 24 ml, GE Healthcare) was used for size exclusion chromatography. Where applicable, DDM was exchanged for 0.1% (w/V) DHPC (1,2-diheptanoyl-sn-glycero-3-phosphocholine) during gel filtration.
Blue Native Gel Electrophoresis and Analytical Size Exclusion Chromatography of EssB-N
Linear 4%–16% gradient Native Bis-Tris gels (Novex, Life Technologies) were run and destained according to the manufacturer’s protocol. Samples comprising 3mg of purified EssN were loaded. Apoferritin (480 kDa), B-phycoerythrin (242 kDa), lactate dehydrogenase (146 kDa), BSA (66 kDa), and soya bean trypsin inhibitor (20 kDa) were used as standard proteins.
To analyze the stability of the EssB-N dimer by size exclusion chromatog-raphy in different buffer systems, EssB-N (2 mg) was buffer exchanged to the test buffer containing 0.5% TCEP and 10% (w/v) glycerol ([a] 10 mM Tris-HCl pH 7.8, 20 mM NaCl; [b] 10 mM Tris-HCl pH 7.8, 20 mM NaCl, 5 mM ethylenediaminetetraacetic acid (EDTA); [c] 100 mM citrate pH 5.5, 300 mM NaCl; [d] 100 mM phosphate pH 7.8, 300 mM NaCl; and [e] 50 mM Bis-Tris pH 5.5, 300 mM NaCl) using a spin concentrator. After incubating the samples for 30 min at room temperature, they were loaded onto a size exclusion chromatography column (HR 30/100 GL, Superdex75 prep grade, GE Healthcare) equilibrated with the same buffer.
Crystallization and Structure Determination
Crystals of EssB-N were grown by hanging-drop vapor diffusion at 20C in 3ml drops of a 1:1 ratio of protein solution (25 mg/ml EssB-N in 20 mM sodium phosphate pH 7.8, 50 mM NaCl, 0.5 mM TCEP) with the reservoir (0.1 M tri-sodium citrate pH 5.5, 20% [w/v] PEG 3000). Bipyramidal crystals of maximum dimensions 100–200mm appeared after 4 days. The crystals were picked up in LV-oil (MiTeGen, NY, USA), cooled in a stream of gaseous nitrogen at173C, then characterized in-house using a Rigaku 007HF rotating anode X-ray generator coupled to a RAXIS IV2+image plate detector. The crystals display space groupP41212 with a single molecule in the asymmetric unit.
EssB-C crystals grew in sitting drops of a vapor diffusion setup at 20C with 1-ml protein stock solution (20 mg/ml EssB-C in 20 mM sodium phosphate pH 7.8, 50 mM NaCl, 0.5 mM TCEP) and 1-ml reservoir (2.1 M malate pH 7.0). The crystals are tetragonal bipyramidal prisms, of maximum dimensions 300mM, and diffracted to about 3.2 A˚ resolution. Two molecules constitute the asymmetric unit with a solvent content of approximately 80%. The combi-nation of a large tetragonal unit cell (Table 1), high solvent content, and a flex-ible C terminus likely explains the poor order. EssB-CDproduced crystals using sitting drop vapor diffusion at 20C with 1ml protein stock solution (20 mg/ml EssB-CDin 20 mM sodium phosphate pH 7.8, 50 mM NaCl, 0.5 mM TCEP), and 1ml reservoir (3.0 M malonate pH 7.0, 10 mM ZnCl2). The crystals formed clusters of diamond-like plates. Single fragments were isolated using microtools, plunged in liquid nitrogen, then tested in-house. They belong to space groupC2 with four molecules in the asymmetric unit and a solvent content of approximately 75%.
EssB-N and EssB-C X-ray data were collected on ID29 at the European Synchrotron Radiation Facility (ESRF, Grenoble, France) and EssB-CDdata at beam line I02 at Diamond Light Source (DLS, Didcot, UK), all with an ADSC Q315r Charged Couple Device detector. The data were processed using XDS (Kabsch, 2010) except for EssB-N native data, which were pro-cessed using Mosflm (Battye et al., 2011).
The crystal structures were solved by SAD using CRANK (Ness et al., 2004), as implemented in the CCP4 suite of programs (Winn et al., 2011). EssB-N presents a single molecule per asymmetric unit and the three expected Se sites were located. Later examination revealed a distinct anomalous signal from a chloride ion (interacting with Arg203 and His207) that was not used for phasing. The initial figure-of-merit (FOM) of 0.34–1.85 A˚ increased to 0.79 after density modification. A model consisting of residues 36–96 and 110–142 was built using ARP/wARP (Perrakis et al., 1999) and resulted in Rwork and Rfreeof 0.249 and 0.293, respectively. This model was extended to residues 2–210 in the graphics program COOT (Emsley and Cowtan, 2004) and refined with Refmac5 (Murshudov et al., 2011).
overall FOM of 0.57 (after density modification). A model (chain A residues 251–379, chain B residues 258–382) was built into the electron density map followed by several rounds of refinement. This provided a model to establish the phases of a native data set to 3.2 A˚ by molecular replacement. Refinement following inspection in COOT gave Rworkand Rfreevalues of 0.443 and 0.466, respectively; however, although the core of the structure was well defined, it was not possible to extend the model. However, the lack of ordered structure at the C terminus of this EssB-C model suggested that a truncation might improve the diffraction order; hence, EssB-CDwas prepared. This change did indeed result in improved diffraction and a Se-SAD phasing experiment produced an excellent electron density map to 2.9 A˚ based on 12 Se positions with a FOM of 0.47 (that increased to 0.66 after density modification). All four polypeptides in the asymmetric unit were constructed using BUCCANEER (Cowtan, 2006) and served as a search model to phase native data to 2.4 A˚ by molecular replacement with PHASER. Rounds of model adjustment using COOT, interspersed with Refmac5 calculations, the addition and refinement of water molecules and components of the crystallization mixture (sodium ions, malonate and glycerol), and inclusion of multiple conformers completed the refinement.
MOLPROBITY (Lovell et al., 2003) was used to monitor model geometry and included a Ramachandran plot analysis during refinements along with the vali-dation tools within COOT. Figures were prepared using PyMOL (Delano, 2002). The DALI server was used to search the PDB for structural homologs and structural superpositions were performed using DALILITE (Holm and Park, 2000). Multiple sequence alignments were calculated using CLUSTALW2 (Larkin et al., 2007) and edited using ALINE (Bond and Schu¨ttelkopf, 2009). The conservation of amino acid sequence was investigated using CONSURF (Landau et al., 2005), noting that EssB-ortholog sequences with identities less than 20% were excluded.
Computational Structure Prediction
The EssB TM-segment was predicted using TMHMM v2.0 (Krogh et al., 2001). Constructs were generated, in part guided by thePhyrefold recognition server (Kelley and Sternberg, 2009).
Spin-Labeling and EPR Sample Preparation
The cysteine EssB-N and EssBDmutant proteins were purified as described above, but with the omission of the thiol-reducing agent TCEP in buffer C. Samples were spectrophotometrically quantified at l= 280 nm and immediately mixed with a 10-fold molar excess of (1-oxyl-2,2,5,5-tetramethyl-pyrroline-3-methyl) methanethiosulfonate (MTSSL) from a 10 mg/ml stock solution in dimethylformamide and incubated for 14 hr at 8C. Labeling was verified by monitoring the 186-Da mass-shift by MALDI-TOF MS analysis.
The spin-labeled samples were buffer exchanged into 20 mM Tris-HCl pH 7.8, 100 mM NaCl (for EssBD supplemented with 0.04% DDM and 2mg/ml DOPC) in D2O, and then were diluted with an equal volume of D8 glycerol to generate a 100-ml PELDOR sample at a concentration of 200mM. The samples were transferred into clear, fused quartz EPR tubes and stored at20C, and cooled in liquid nitrogen immediately prior to use.
EPR Data Collection and Data Analysis
PELDOR experiments were carried out using a Bruker ELEXSYS E580 spec-trometer operating at X-band with a dielectric ring resonator and a Bruker 400U second microwave source unit. Measurements were made on samples at233C with an overcoupled resonator giving a Q-factor of approximately 100. The video bandwidth was set to 20 MHz. A four pulse, dead-time free PELDOR sequence was used, with the pump pulse frequency positioned at the center of the nitroxide spectrum. The frequency of the observer pulses was increased by 80 MHz relative to the pump position. The observer sequence used a 32-nsp-pulse; the pumpp-pulse was typically 16 ns. The experiment shot repetition time was 4 ms, and the shots per point were 50. The number of data points and scans used varied for each sample to provide a suitable signal-to-noise ratio. PELDOR data were analyzed using the DeerAnalysis 2011 package (Jeschke et al., 2006). In brief, the time traces of the dipolar coupling evolution data were corrected for background echo decay using a homogeneous three-dimensional spin distribution. The starting time (which corresponds to the zero time of the dipolar evolution data) was optimized to give the best-fit Pake pattern in the Fourier transformed data
and the lowest rmsd background fit. Tikhonov regularization was then used to simulate time trace data that gave rise to distance distributions, P(r), of peak width depending on the regularization factor, alpha. The alpha term used was judged by reference to a calculated L-curve. The L-curve is a para-metric plot that compares smoothness of the distance distribution to the mean-square-deviation.
Docking Using Restrained Molecular Dynamics
Spin label positions and conformer distributions were calculated using MtsslWizard (Hagelueken et al., 2012). Multiple nitroxide positions and distri-butions were incorporated into the monomer structure and the dimer models were refined by rigid body dynamics using Xplor-NIH (Schwieters et al., 2003) at 227C, with restraints taken from PELDOR-derived distance distribu-tions. Multiple rounds of refinement were carried out with starting structures in which pairs of monomers, with random orientations, were separated by approximately 50 A˚. Final structures were selected at the lowest distance violation. Distance distributions for the final model were calculated using MtsslWizard running within PyMOL.
ACCESSION NUMBERS
The coordinates and structure-factor data for EssB-N and EssB-CDare depos-ited with the PDB under the accession codes 4ANO and 2YNQ, respectively.
SUPPLEMENTAL INFORMATION
Supplemental Information includes three figures, one movie, and one table and can be found with this article online athttp://dx.doi.org/10.1016/j.str. 2013.02.007.
ACKNOWLEDGMENTS
Supported by the Biotechnology and Biological Sciences Research Council (H007571), the Medical Research Council (UK) (G117/519), and the Wellcome Trust (grants 082596, 083481, 094090, and 099149). We acknowledge the DLS and ESRF for synchrotron beam time and excellent staff support.
Received: November 22, 2012 Revised: February 3, 2013 Accepted: February 5, 2013 Published: March 14, 2013
REFERENCES
Abdallah, A.M., Gey van Pittius, N.C., Champion, P.A.D., Cox, J., Luirink, J., Vandenbroucke-Grauls, C.M.J.E., Appelmelk, B.J., and Bitter, W. (2007). Type VII secretion—mycobacteria show the way. Nat. Rev. Microbiol. 5, 883–891.
Battye, T.G., Kontogiannis, L., Johnson, O., Powell, H.R., and Leslie, A.G. (2011). iMOSFLM: a new graphical interface for diffraction-image processing with MOSFLM. Acta Crystallogr. D Biol. Crystallogr.67, 271–281.
Bond, C.S., and Schu¨ttelkopf, A.W. (2009). ALINE: a WYSIWYG protein-sequence alignment editor for publication-quality alignments. Acta Crystallogr. D Biol. Crystallogr.65, 510–512.
Burts, M.L., Williams, W.A., DeBord, K., and Missiakas, D.M. (2005). EsxA and EsxB are secreted by an ESAT-6-like system that is required for the pathogen-esis ofStaphylococcus aureusinfections. Proc. Natl. Acad. Sci. USA102, 1169–1174.
Chen, Y.H., Anderson, M., Hendrickx, A.P., and Missiakas, D. (2012). Characterization of EssB, a protein required for secretion of ESAT-6 like proteins inStaphylococcus aureus. BMC Microbiol.12, 219.
Cowtan, K. (2006). The Buccaneer software for automated model building. 1. Tracing protein chains. Acta Crystallogr. D Biol. Crystallogr.62, 1002–1011.
Emsley, P., and Cowtan, K. (2004). Coot: model-building tools for molecular graphics. Acta Crystallogr. D Biol. Crystallogr.60, 2126–2132.
Evans, P. (2006). Scaling and assessment of data quality. Acta Crystallogr. D Biol. Crystallogr.62, 72–82.
Hagelueken, G., Ward, R., Naismith, J.H., and Schiemann, O. (2012). MtsslWizard: in silico spin-Labeling and generation of distance distributions in PyMOL. Appl. Magn. Reson.42, 377–391.
Holm, L., and Park, J. (2000). DaliLite workbench for protein structure compar-ison. Bioinformatics16, 566–567.
Houben, E.N., Bestebroer, J., Ummels, R., Wilson, L., Piersma, S.R., Jime´nez, C.R., Ottenhoff, T.H., Luirink, J., and Bitter, W. (2012). Composition of the type VII secretion system membrane complex. Mol. Microbiol.86, 472–484.
Jeschke, G., Koch, A., Jonas, U., and Godt, A. (2002). Direct conversion of EPR dipolar time evolution data to distance distributions. J. Magn. Reson.155, 72–82.
Jeschke, G., Chechik, V., Ionita, P., and Godt, A. (2006). DeerAnalysis2006 - A comprehensive software package for analyzing pulsed ELDOR data. Appl. Magn. Reson.30, 473–498.
Kabsch, W. (2010). XDS. Acta Crystallogr. D Biol. Crystallogr.66, 125–132.
Kelley, L.A., and Sternberg, M.J.E. (2009). Protein structure prediction on the Web: a case study using the Phyre server. Nat. Protoc.4, 363–371.
Krissinel, E., and Henrick, K. (2007). Inference of macromolecular assemblies from crystalline state. J. Mol. Biol.372, 774–797.
Krogh, A., Larsson, B., von Heijne, G., and Sonnhammer, E.L. (2001). Predicting transmembrane protein topology with a hidden Markov model: application to complete genomes. J. Mol. Biol.305, 567–580.
Landau, M., Mayrose, I., Rosenberg, Y., Glaser, F., Martz, E., Pupko, T., and Ben-Tal, N. (2005). ConSurf 2005: the projection of evolutionary conservation scores of residues on protein structures. Nucleic Acids Res.33(Web Server issue), W299-302.
Larkin, M.A., Blackshields, G., Brown, N.P., Chenna, R., McGettigan, P.A., McWilliam, H., Valentin, F., Wallace, I.M., Wilm, A., Lopez, R., et al. (2007). Clustal W and Clustal X version 2.0. Bioinformatics23, 2947–2948.
Levinson, N.M., Kuchment, O., Shen, K., Young, M.A., Koldobskiy, M., Karplus, M., Cole, P.A., and Kuriyan, J. (2006). A Src-like inactive conformation in the abl tyrosine kinase domain. PLoS Biol.4, e144.
Lewis, K.N., Liao, R., Guinn, K.M., Hickey, M.J., Smith, S., Behr, M.A., and Sherman, D.R. (2003). Deletion of RD1 fromMycobacterium tuberculosis mimics bacille Calmette-Gue´rin attenuation. J. Infect. Dis.187, 117–123.
Liang, X., and Van Doren, S.R. (2008). Mechanistic insights into phosphopro-tein-binding FHA domains. Acc. Chem. Res.41, 991–999.
Lovell, S.C., Davis, I.W., Arendall, W.B., 3rd, de Bakker, P.I.W., Word, J.M., Prisant, M.G., Richardson, J.S., and Richardson, D.C. (2003). Structure valida-tion by Calpha geometry: phi,psi and Cbeta deviavalida-tion. Proteins50, 437–450.
McCoy, A.J., Grosse-Kunstleve, R.W., Adams, P.D., Winn, M.D., Storoni, L.C., and Read, R.J. (2007). Phaser crystallographic software. J. Appl. Cryst.40, 658–674.
McDowell, M.A., Johnson, S., Deane, J.E., Cheung, M., Roehrich, A.D., Blocker, A.J., McDonnell, J.M., and Lea, S.M. (2011). Structural and functional studies on the N-terminal domain of theShigellatype III secretion protein MxiG. J. Biol. Chem.286, 30606–30614.
Milov, A.D., Salikhov, K., and Shirov, M. (1981). Use of the double resonance in electron spin echo method for the study of paramagnetic center spatial distri-bution in solids. Fizika Tverdogo Tela23, 975–982.
Murshudov, G.N., Skuba´k, P., Lebedev, A.A., Pannu, N.S., Steiner, R.A., Nicholls, R.A., Winn, M.D., Long, F., and Vagin, A.A. (2011). REFMAC5 for the refinement of macromolecular crystal structures. Acta Crystallogr. D Biol. Crystallogr.67, 355–367.
Ness, S.R., de Graaff, R.A., Abrahams, J.P., and Pannu, N.S. (2004). CRANK: new methods for automated macromolecular crystal structure solution. Structure12, 1753–1761.
Pallen, M.J. (2002). The ESAT-6/WXG100 superfamily — and a new Gram-positive secretion system? Trends Microbiol.10, 209–212.
Pannier, M., Veit, S., Godt, A., Jeschke, G., and Spiess, H.W. (2000). Dead-time free measurement of dipole-dipole interactions between electron spins. J. Magn. Reson.142, 331–340.
Pereira, S.F.F., Goss, L., and Dworkin, J. (2011). Eukaryote-like serine/threo-nine kinases and phosphatases in bacteria. Microbiol. Mol. Biol. Rev.75, 192–212.
Perrakis, A., Morris, R., and Lamzin, V.S. (1999). Automated protein model building combined with iterative structure refinement. Nat. Struct. Biol.6, 458–463.
Schiemann, O., and Prisner, T.F. (2007). Long-range distance determinations in biomacromolecules by EPR spectroscopy. Q. Rev. Biophys.40, 1–53.
Schwieters, C.D., Kuszewski, J.J., Tjandra, N., and Clore, G.M. (2003). The Xplor-NIH NMR molecular structure determination package. J. Magn. Reson.160, 65–73.
Tanaka, Y., Kuroda, M., Yasutake, Y., Yao, M., Tsumoto, K., Watanabe, N., Ohta, T., and Tanaka, I. (2007). Crystal structure analysis reveals a novel forkhead-associated domain of ESAT-6 secretion system C protein in Staphylococcus aureus. Proteins69, 659–664.
Wagner, S., Klepsch, M.M., Schlegel, S., Appel, A., Draheim, R., Tarry, M., Ho¨gbom, M., van Wijk, K.J., Slotboom, D.J., Persson, J.O., and de Gier, J.W. (2008). TuningEscherichia colifor membrane protein overexpression. Proc. Natl. Acad. Sci. USA105, 14371–14376.
Winn, M.D., Ballard, C.C., Cowtan, K.D., Dodson, E.J., Emsley, P., Evans, P.R., Keegan, R.M., Krissinel, E.B., Leslie, A.G.W., McCoy, A., et al. (2011). Overview of the CCP4 suite and current developments. Acta Crystallogr. D Biol. Crystallogr.67, 235–242.