University of Warwick institutional repository: http://go.warwick.ac.uk/wrap
This paper is made available online in accordance with
publisher policies. Please scroll down to view the document
itself. Please refer to the repository record for this item and our
policy information available from the repository home page for
further information.
To see the final version of this paper please visit the publisher’s website.
Access to the published version may require a subscription.
Author(s): Neil S Graham Martin R Broadley, John P Hammond, Philip J
White and Sean T May
Article Title: Optimising the analysis of transcript data using high density
oligonucleotide arrays and genomic DNA-based probe selection
Year of publication: 2007
Open Access
Research article
Optimising the analysis of transcript data using high density
oligonucleotide arrays and genomic DNA-based probe selection
Neil S Graham
1, Martin R Broadley
1, John P Hammond
2, Philip J White
3and
Sean T May*
1Address: 1Plant Science Division, School of Biosciences, University of Nottingham, Sutton Bonington Campus, Loughborough, LE12 5RD, UK,
2Warwick HRI, University of Warwick, Wellesbourne, Warwick, CV35 9EF, UK and 3The Scottish Crop Research Institute, Invergowrie, Dundee,
DD2 5DA, UK
Email: Neil S Graham - [email protected]; Martin R Broadley - [email protected];
John P Hammond - [email protected]; Philip J White - [email protected]; Sean T May* - [email protected] * Corresponding author
Abstract
Background: Affymetrix GeneChip arrays are widely used for transcriptomic studies in a diverse
range of species. Each gene is represented on a GeneChip array by a probe-set, consisting of up to 16 probe-pairs. Signal intensities across probe-pairs within a probe-set vary in part due to different physical hybridisation characteristics of individual probes with their target labelled transcripts. We have previously developed a technique to study the transcriptomes of heterologous species based on hybridising genomic DNA (gDNA) to a GeneChip array designed for a different species, and subsequently using only those probes with good homology.
Results: Here we have investigated the effects of hybridising homologous species gDNA to study
the transcriptomes of species for which the arrays have been designed. Genomic DNA from
Arabidopsis thaliana and rice (Oryza sativa) were hybridised to the Affymetrix Arabidopsis ATH1 and Rice Genome GeneChip arrays respectively. Probe selection based on gDNA hybridisation intensity increased the number of genes identified as significantly differentially expressed in two published studies of Arabidopsis development, and optimised the analysis of technical replicates obtained from pooled samples of RNA from rice.
Conclusion: This mixed physical and bioinformatics approach can be used to optimise estimates
of gene expression when using GeneChip arrays.
Background
The use of microarrays to determine global transcriptional profiles is a valuable and widely-used tool for understand-ing the regulation of biological systems [1,2]. Several microarray platforms are used for these studies, including spotted arrays (using cDNAs, PCR products or oligonucle-otides) and in situ synthesised arrays including Agilent SurePrint and Affymetrix GeneChip arrays. GeneChip
arrays have a number of advantages over other arrays. For example, the uniformity and reproducibility of data from GeneChip arrays facilitates the curation of large data sets and subsequent inter-experimental comparisons [1-5]. Each gene depicted on a GeneChip array is represented by up to 16 probe-pairs, with each probe-pair consisting of a 25 base oligo perfect-match (PM) probe, designed to bind perfectly to the gene sequence, and a 25 base oligo
mis-Published: 1 October 2007
BMC Genomics 2007, 8:344 doi:10.1186/1471-2164-8-344
Received: 13 February 2007 Accepted: 1 October 2007
This article is available from: http://www.biomedcentral.com/1471-2164/8/344 © 2007 Graham et al.; licensee BioMed Central Ltd.
BMC Genomics 2007, 8:344 http://www.biomedcentral.com/1471-2164/8/344
match (MM) probe, which contains a mis-match base at the 13th base position, designed to measure non-specific binding [1]. This contrasts with the single cDNA or oligo probe used to assay a gene on most other arrays. However, since several signal values are generated for each gene, it is more complex to produce a single expression value for each gene, as probes within a probe-set may not have sim-ilar signal intensity due in part to the different physical hybridisation characteristics of individual probes [6]. Sev-eral normalisation algorithms are used to amalgamate probe signal values and generate a single expression value for each gene [7]. The Affymetrix system typically uses the Microarray suite (MAS) or its successor GeneChip Operat-ing system (GCOS) to generate the gene signal values. The expression value is calculated using the "One-step Tukey's biweight algorithm", which weights the signal intensities from individual probes based on their distance from the median signal intensity of the probe-set [8]. Other nor-malisation algorithms have been developed that use the signal intensities from all the arrays in an experiment to determine gene expression values. These include "Model-Based Expression Indexes" [9,10] and the "Robust Multi-array Average" (RMA) algorithms [11]. With these meth-ods, the probe response pattern across all genes is fitted across all the arrays used in an experiment and a robust estimate of the background signal is modelled and the data adjusted accordingly. These models have been devel-oped further to account for the physical binding proper-ties of the probes. Examples of these models are "Positional-Dependent-Nearest-Neighbour model" [12] and GC-RMA [13].
The design of Affymetrix GeneChip arrays also enables the transcriptional profiling of species for which the arrays were not designed [14-23]. For example, Hammond et al. [22,23] used a mixed physical and bioinformatic method, which involved hybridising genomic DNA (gDNA) from a species onto a GeneChip array of a heterologous species. A parser script, written in Perl, was developed to generate probe-masking files by removing probe-pairs whose PM probe signal intensity value was below a user-defined gDNA hybridisation intensity threshold. These probe-masking files, containing the retained probe-pairs, were then used for analysis of transcriptional data. Using this technique increased the sensitivity of using an Arabidopsis ATH1 array to study transcriptional responses of Brassica oleracea to phosphorus stress [22]. This technique also allowed the shoot transcriptional profiles of two closely related Brassicaceae species, Thlaspi caerulescens and T. arvense to be compared more satisfactorily [23]. The tech-nique has also been used with human chips to analyse several heterologous animal species such as horse, sheep and guinea pig (data not shown).
The aim of this study was to determine if gDNA-based probe selection can improve estimates of gene expression in homologous species transcriptome analyses. We hybridised gDNA from Arabidopsis thaliana and rice (Oryza sativa) to the Affymetrix Arabidopsis ATH1 and Rice Genome GeneChip arrays respectively. Only those probe-pairs whose PM probe hybridised to gDNA above defined signal intensity thresholds were retained and these were used to reanalyse previously published transcriptome data sets. Two published studies of Arabidopsis shoot develop-ment from the AtGenExpress project [24], and six techni-cal replicates of pooled rice RNA spiked with two different concentrations of bacterial control genes (PlexDB, acces-sion number OS1 [25,26]) were reanalysed using this approach. Probe selection based on gDNA hybridisation was also compared to the random removal of probe-pairs. Probe selection increased the number, and altered the identity of genes identified as significantly differentially expressed in the Arabidopsis study and optimised the analysis of pooled rice RNA.
This mixed physical and bioinformatics approach can be applied post-experiment and is applicable to all species for which Affymetrix GeneChip arrays have been devel-oped including human chips.
Results and discussion
Genomic DNA hybridisations and probe selection
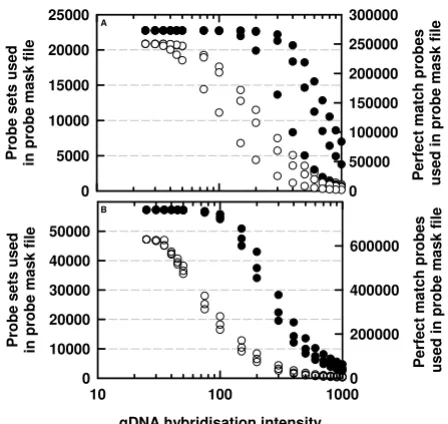
The aim of the study was to investigate the effects of using a mixed physical and bioinformatics probe-masking approach on the study of the transcriptomes of two spe-cies. Arabidopsis thaliana and rice gDNA was hybridised to the Affymetrix Arabidopsis ATH1 and Rice Genome Gene-Chip arrays respectively. A probe-pair was selected if its perfect-match (PM) gDNA hybridisation signal intensity was greater than a series of defined thresholds (ranging from 0 [no probe selection] to 1000), using a .cel file parser script written in Perl [22]. The probe-pairs retained in the .cdf files had good homology to the gDNA as defined by their gDNA signal intensities, and were used to analyse published transcriptome data at the defined thresholds.
reten-tion of probe-pairs at higher gDNA hybridisareten-tion inten-sity thresholds was lower in one of the three Arabidopsis replicates. This may be due to technical rather than bio-logical variation since gDNA should be consistent when isolated from the same plant genotype. Notably, the three Arabidopsis replicates had a Spearman's similarity meas-ure of 1, as calculated by the condition tree function in GeneSpring GX (Agilent Technologies, Palo Alto, CA, USA; data not shown). Whilst it may be feasible to use model-based normalisation strategies to adjust for probe-level differences in gDNA hybridisation intensities between biological replicates, we have adopted a more conservative probe-masking strategy. This strategy was based on retaining only those probe-pairs whose PM gDNA hybridisation intensity was sufficiently high in all three biological replicates.
The Affymetrix Rice Genome array is designed to analyse 48,564 Oryza sativa cv. japonica and 1,260 O. sativa cv. indica transcripts [26]. Genomic DNA was extracted from one japonica (Sharbati) and two indica varieties (385 and Super). As with Arabidopsis, the rice gDNA hybridised well to the array. The retention of pairs and
probe-sets decline at higher gDNA hybridisation intensity thresholds (Figure 1B). The three replicate rice gDNA hybridisations produced similar results across the range of gDNA hybridisation intensity thresholds.
These data show that in both Arabidopsis and rice, hybrid-isation efficiencies between individual PM probes and their target transcript vary within and between probe-sets. Variation in hybridisation efficiencies could be due to the physical binding properties of probes and the number of targets within the genome. For example, hybridisation efficiency is reduced when probes and their targets form secondary structures, when probes have unresponsive binding affinities, when interactions with fluorescent labels are unfavourable, and when non-specific binding occurs [6,27].
Analysis of data sets from the AtGenExpress project The AtGenExpress project has produced a large quantity of high-quality gene expression data for the model plant Ara-bidopsis [24]. It includes GeneChip array data from devel-opmental time-course experiments and experiments in which plants were subjected to hormones, abiotic or biotic stresses. Two shoot developmental time-course experiments from the AtGenExpress project were reana-lysed here using a gDNA based probe selection: Data Set A, in which different aged rosette leaves (number 2, 4, 6, 8, 10 and 12) were taken from 17 day old plants, and Data Set B, in which pooled rosette leaves were taken from 7, 14 and 21 day old plants. All conditions comprised three biological replicates. Data Sets A and B were filtered for genes that were differentially expressed between one or more conditions within each experiment using probe-mask files generated at different gDNA hybridisation intensity thresholds.
For Data Set A, the number of genes identified as signifi-cantly differentially expressed increased slightly, and then decreased, as a function of the gDNA hybridisation inten-sity threshold used in the probe-mask file (Figure 2A). This observation is consistent with transcriptome analysis of other Brassicaceae species using the ATH1 GeneChip array, when probe-mask files based on the hybridisation of heterologous species gDNA to the ATH1 GeneChip array were used [22,23]. A similar pattern was observed when Data Set B was analysed (Figure 2B).
In addition to affecting the number of genes identified as significantly differentially expressed, gDNA-based probe-masks also affected the identity of genes significantly dif-ferentially expressed between treatment conditions in the Arabidopsis Data Sets A and B (Figure 2C). Thus, the number of genes identified as differentially expressed (p < 0.05) in the absence of a probe-mask were expressed as a proportion of the sum of all genes differentially expressed
Number of (A) Arabidopsis thaliana and (B) Oryza sativa
[image:4.612.62.286.94.306.2]probe-pairs and probe-sets used to study the transcriptome of A. thaliana and O. sativa respectively, as a function of the gDNA hybridisation intensity thresholds used to generate the probe-mask files
Figure 1
Number of (A) Arabidopsis thaliana and (B) Oryza sativa
probe-pairs and probe-sets used to study the transcriptome of A. thaliana and O. sativa respectively, as a function of the gDNA hybridisation intensity thresholds used to generate the probe-mask files. Filled circles are scaled to the left-hand
y-axis (i.e. probe-sets retained within probe-mask files) and unfilled circles are scaled to the right-hand y-axis (i.e. probe-pairs retained within probe-mask files). Three gDNA hybridi-sations were performed for each species.
Perfec
t m
a
tch probes
used in probe m
a
sk file
0 50000 100000 150000 200000 250000 300000
Probe sets used in pro
b
e m
a
sk file
0 5000 10000 15000 20000 25000
gDNA hybridisation intensity
10 100 1000
Probe sets used in probe m
a
sk file
0 10000 20000 30000 40000 50000
Perfect match probes used in probe m
a
sk f
ile
0 200000 400000 600000
A
BMC Genomics 2007, 8:344 http://www.biomedcentral.com/1471-2164/8/344
(p < 0.05) both with and without probe-masks. At low gDNA hybridisation intensity thresholds, and for both Data Sets A and B, genes significantly (p < 0.05) differen-tially expressed in the absence of a probe-mask declined markedly as a proportion of the sum of all genes signifi-cantly differentially expressed (p < 0.05) both with and without probe-masks, before returning to unity at gDNA hybridisation intensity thresholds >200 (Figure 2C). This decline in the proportion of genes represented in the anal-ysis of data without probe-masking corresponds to slight increases in the total number of genes differentially expressed when probe-masking was used (Figure 2A, B). Therefore, gDNA based probe selection affects both the number and the identity of genes which are identified as significantly differentially expressed in these two Arabi-dopsis experiments.
The effects of gDNA-based probe removal on estimates of gene expression differences was compared to the effects of random removal of probe-pairs using Arabidopsis Data Set B. Software to simulate random probe-pair removal (Xspecies Version 2.0) has been developed and is freely available [31]. Random probe-pair removal of 1, 2, 5, 10, 20, 50, 75 and 90% of probe-pairs was repeated three times on one of the Arabidopsis gDNA .cel files. Thus, the random removal of, for example, 50% of the probe-pairs (i.e. 125,103 probe-pairs) from Arabidopsis ATH1 Gene-Chip should remove an average of 11 probe-sets (i.e. 0.511 * 22,746 = 11.1). Here, in three random simulations of 50% probe-pair removal, 127,583, 127,951 and 127,882 probe-pairs were removed ( = 127,805 ± 113 SEM) and the corresponding probe-set removal was 12, 14 and 15.
Unsurprisingly, random probe-pair removal also affected probe-set expression estimates. Random probe-pair removal increased the number of genes identified as sig-nificantly differentially expressed (P < 0.05) compared to corresponding gDNA-based probe-masks, especially when a large proportion of the probe-pairs were removed from the analysis (Figure 3A). However, based on the assumption that gDNA hybridisation will tend to remove less-informative probe-pairs compared to a random probe selection strategy, due to differences in probe-level hybridisation efficiencies, we can hypothesise that gDNA based probe-masking is a more appropriate analysis step. Consistent with this hypothesis, random probe-removal of <40% of all probe-pairs decreased the number of genes identified as significantly differentially expressed (P < 0.05) by > ± 2-fold between the 7 and 14-d old rosette leaves in Data Set B compared to corresponding gDNA-based probe-masks (Figure 3B). Furthermore, probe-sets identified as significantly differentially expressed using a gDNA-based probe-mask were more similar to the
iden-x
(A, B) Genes identified as significantly differentially expressed (p < 0.05) in Arabidopsis thaliana, as a function of the gDNA hybridisation intensity threshold used to generate probe-mask files, for two AtGenExpress experiments [24]
Figure 2
(A, B) Genes identified as significantly differentially expressed (p < 0.05) in Arabidopsis thaliana, as a function of the gDNA hybridisation intensity threshold used to generate probe-mask files, for two AtGenExpress experiments [24]. (A) RNA was extracted from leaves 2, 4, 6, 8, 10 and 12, sampled from 17 d old plants (n = 3), labelled and hybridised to the A. thaliana ATH1-121501 GeneChip array, and data were nor-malised to the median expression value of each gene across all leaves. The number of genes identified as differentially expressed in one, two, three and four of the six conditions are represented by filled circles, squares, triangles and dia-monds respectively. (B) RNA was extracted from whole rosettes of 7, 14, and 21 d old plants (n = 3), labelled and hybridised to the A. thaliana ATH1-121501 GeneChip array, and normalised to the median expression value of each gene across all time points. (C) Genes identified as significantly dif-ferentially expressed (p < 0.05) in the absence of a probe-mask, as a proportion of the sum of all genes significantly dif-ferentially expressed (p < 0.05) when analyses were con-ducted with and without a corresponding probe-mask. Filled circles represent Data Set A, open circles represent Data Set B.
Pr
ob
e sets
di
ffer
ent
iall
y
expr
essed
0 500 1000 1500 2000 2500 3000 3500
Pr
ob
e set
s d
iff
eren
tial
ly
exp
ressed
1 10 100 1000 10000
0
gDNA hybridization intensity
10 100 1000
Prob
e s
ets d
iff
eren
tial
ly
exp
ressed
(
P
<0.
05)
w
ith
ou
t p
ro
be mask /
Pro
be sets dif
feren
tially
ex
pre
ssed
(
P
<0.05)
w
ith
an
d w
ith
ou
t pr
ob
e ma
sk
0.0 0.6 0.8 1.0
A
B
tity of probe-sets significantly differentially expressed in the absence of a probe-mask, than were those probe-sets identified using a corresponding random probe-removal
mask (Figure 3C). The hypothesis that targeted gDNA-based probe-masking is an appropriate analysis procedure should now be tested for further ecotypes and for other species using the software developed in this study [31].
An alternative to gDNA based probe selection is to filter out probes based on poor RNA hybridisation intensities [28]. Thus, when data from the human HG-U133A Gene-Chip array was analysed using a probe-mask file based on RNA hybridisation intensity, the number of probe-sets called 'present' by the MAS 5.0 algorithm increased 1.5-fold [6]. However, in contrast to gDNA-based probe selec-tion strategies, selecselec-tion of probes based on the RNA hybridisation signal will bias the anlaysis towards those transcripts which are most abundant in the sample used.
Analysis of Arabidopsis thaliana reference genes from AtGenExpress project
A set of references genes whose expression varied little between tissue types and during development has been reported for the AtGenExpress data [29]. These genes were identified by calculating the percentage coefficient of var-iation (% CV) of all genes across all samples; genes with the lowest % CV and with low expression values were selected and confirmed by real-time PCR [29]. The % CV of five of these reference genes (At4g3380, At4g34270, At1g59830, At2g 28390 and At1g13320), whose %CV were the lowest across the AtGenExpress developmental series [29], were calculated across the range of gDNA hybridisation intensity thresholds for Data Sets A and B. In general, the % CV was lowest when a gDNA hybridisa-tion intensity threshold of 30 to 50 was used (Figure 4A, B). The expression values for the five genes also varied when the gDNA probe-selection method was applied. For example, with Data Set A (leaf number 2), At1g13220 expression value decreases from 404.4 (no probe selec-tion) to 356.1 (threshold of 40) before increasing again to 535.4 (at a threshold of 200). The expression values of this gene in all the leaf samples of this data set follow the same pattern, with the value first decreasing then increas-ing. In contrast a different pattern is seen with Data Set B. The expression value (7 d old rosette leaves) increases as the gDNA hybridisation intensity threshold increases, from 502.9 (no probe selection) to 1015 (at a gDNA hybridisation intensity threshold of 200). These results demonstrate that the probe-selection method can have a profound effect on the expression value obtained for indi-vidual genes and illustrates how the identity of genes identified as significantly differentially expressed will dif-fer when a probe-selection method is applied.
Analysis of a rice data set
To further investigate whether transcriptome analysis can be optimised by selecting probe-pairs on a GeneChip array that hybridise well to gDNA from a homologous
Genes (A) differentially (p < 0.05) or (B) ± 2-fold differen-tially (p < 0.05) expressed in one or more of the three treat-ment conditions in Arabidopsis thaliana in which RNA was extracted from whole rosettes of 7, 14, and 21 d old plants, labelled and hybridised to the A. thaliana ATH1-121501 GeneChip array ([24]; n = 3) and normalised to the median expression value of each gene across all time points
Figure 3
Genes (A) differentially (p < 0.05) or (B) ± 2-fold differen-tially (p < 0.05) expressed in one or more of the three treat-ment conditions in Arabidopsis thaliana in which RNA was extracted from whole rosettes of 7, 14, and 21 d old plants, labelled and hybridised to the A. thaliana ATH1-121501 GeneChip array ([24]; n = 3) and normalised to the median expression value of each gene across all time points. Filled circles represent probe-pairs removed from the analysis using gDNA hybridisation intensity thresholds. Open circles represent random removal of 1, 2, 5, 10, 20, 50, 75 and 90% of probe-pairs from an Arabidopsis gDNA .cel files. Random probe removal was repeated on three occasions (error bars represent ± S.E.M). (C) Genes identified as significantly differ-entially expressed (p < 0.05) in the absence of a probe-mask, as a proportion of the sum of all genes significantly differen-tially expressed (p < 0.05) when analyses were conducted with and without a corresponding probe-mask. All panels are expressed as a function of the percentage of probe-pairs removed from the analysis either by random simulation, or by gDNA hybridisation.
Pr
obe sets diff
er entiall y expr essed ( P <0. 05 ) 0 500 1000 1500 2000 2500 3000 3500 Pr ob e sets expr essed + /- 2-fold ( P <0. 05 ) 0 100 200 300 400
Proportion of probe pairs removed from analysis
0 20 40 60 80 100
Pr obe s et s dif fer ent ia lly expr essed ( P <0. 05) w ithou t pr ob e m ask / Pr obe set s dif fer ent ia lly expr es sed ( P <0.05) w
ith and w
BMC Genomics 2007, 8:344 http://www.biomedcentral.com/1471-2164/8/344
species, a Rice Genome GeneChip array data set was rean-alysed. The data set was obtained from the PLEXdb data-base (accession number OS1, submitted by T Close) [25,26,30]. This data set consists of six hybridisations of the same pooled RNA sample, with three of the samples spiked with bacterial control transcripts at a concentration of 1.8 pM and three samples spiked with bacterial control transcripts at a concentration of 3.6 pM. In total, four bac-terial transcripts, represented by nine probe-sets, were present in the spike mixture. Since there are three
genera-tions of the probe-sets (designed to different criteria) present on the array, a total of 27 probe-sets were used in the analysis. The data was analysed by calculating the ratio of the bacterial control genes between GeneChip arrays spiked with 1.8 pM bacterial control transcripts and Gene-Chip arrays spiked with 3.6 pM bacterial control tran-scripts at a range of gDNA hybridisation intensity thresholds. As the gDNA hybridisation intensity threshold increased, the ratio of the control genes from the two pools of differentially-spiked samples increased to the expected value of 2 at a gDNA hybridisation threshold of 300, before declining again as the gDNA hybridisation intensity threshold was increased still further (Figure 5). Similarly, the intercept of the linear regression increased towards the expected value of 0, before decreasing again as the gDNA hybridisation intensity threshold increased (Figure 5).
The relative expression of bacterial control transcripts (n = 27) in Oryza sativa RNA samples as a function of the genomic DNA (gDNA) hybridisation intensity thresholds used to make a probe-mask file
Figure 5
The relative expression of bacterial control transcripts (n = 27) in Oryza sativa RNA samples as a function of the genomic DNA (gDNA) hybridisation intensity thresholds used to make a probe-mask file. RNA was extracted from O. sativa, labelled and hybridised to rice genome GeneChip arrays. Samples were spiked with bacterial control transcripts at either 1.8 pM or 3.6 pM (n = 3). Data were obtained from the PLEXdb database ([25, 30]; accession number OS1, sub-mitted by T Close). Data were normalised to the median expression value of each gene across all six samples. Filled circles are scaled to the left-hand y-axis, and represent the ratio of bacterial control transcript mean signals in samples spiked at 3.6 pM and 1.8 pM, i.e. this number defines the slope of a linear regression with an expected value of 2. Unfilled circles are scaled to the right-hand y-axis and repre-sent the bacterial control transcript mean signals in samples spiked at 3.6 pM, when the corresponding mean signal in samples spiked at 1.8 pM equals zero, i.e. this number defines the y-intercept term of a linear regression with an expected value of 0.
gDNA hybridization intensity
0 200 400 600 800 1000
2x : 1x sp
iked p rob e se t ra w sign al 1.75 1.80 1.85 1.90 1.95 2.00 2.05 Prob e se t s ig n a l o f 2 x sp ik e w h en 1x sp ike = 0 ( i.e. int e rcep t) -12 -10 -8 -6 -4 -2 0
The percentage coefficient of variation (% CV) for five Arabi-dopsis thaliana reference genes, from two AtGenExpress experiments [24]
Figure 4
The percentage coefficient of variation (% CV) for five Arabi-dopsis thaliana reference genes, from two AtGenExpress experiments [24]. (A) RNA was extracted from leaves 2, 4, 6, 8, 10 and 12, sampled from 17 d old plants (n = 3), labelled and hybridised to the A. thaliana ATH1-121501 GeneChip array, and data were normalised to the median expression value of each gene across all leaves. (B) RNA was extracted from whole rosettes of 7, 14, and 21 d old plants (n = 3), labelled and hybridised to the A. thaliana ATH1-121501 GeneChip array, and normalised to the median expression value of each gene across all time points.
Co e ffi ci en t o f v a ri a ti o n ( % ) 0 2 4 6 8 10 12 at4g33380 at4g34270 at1g59830 at2g28390 at1g13320
gDNA hybridization intensity
0 20 40 60 80 100 120 140
Coeffic
ient of v
Conclusion
The results presented here demonstrate that a probe-selec-tion method can be used to optimise transcriptome anal-yses. Genomic DNA from a homologous species can be hybridised to its respective GeneChip array, and a subset of probe-pairs can be selected based on the hybridisation efficiency between the PM probe and its target sequence. This subset of probe-pairs can then be used in the subse-quent transcriptome analysis. The change in apparent expression levels can lead to differences in the number and identity of genes identified as significantly differen-tially expressed between experimental conditions. The method can alter the apparent expression level of individ-ual genes although the effect is not consistent across all genes. The approach can be applied post-experiment and is applicable to all species for which Affymetrix GeneChip arrays have been developed.
Methods
Genomic DNA extractions
Three replicate samples of gDNA were extracted from Ara-bidopsis thaliana (Columbia-0, Nottingham Arabidopsis Stock Centre, N1902)leaf tissue using a Qiagen DNeasy plant mini kit according to the manufacturer's instruc-tions (Qiagen Ltd., Crawley, UK). Rice grains from three varieties (Basmati 385, Basmati Super, Sharbati) were ground in liquid nitrogen to a fine powder using a pestle and mortar and 100 mg of ground tissue was transferred to a 2.0 ml eppendorf tube. To this, 750 µl extraction buffer (100 mM Tris pH 8.0, 50 mM EDTA pH 8.0, 0.5 M NaCl, 10 mM β-mercaptoethanol) and 50 µl 10% SDS were added. Following incubation at 70°C for 10 min, 250 µl of 5 M potassium acetate was added and the sam-ple incubated on ice for 20 min. The samsam-ple was then cen-trifuged at 11,600 g for 15 min; the supernatant was removed and added to a 2.0 ml eppendorf tube contain-ing 500 µl isopropanol and incubated at -20°C for 20 min. The sample was centrifuged at 11,600 g for 15 min to pellet the DNA. The supernatant was removed and the DNA pellet washed with 70% ethanol. After washing, the pellet was air dried for 30 min then dissolved in 50 µl ultra-pure water.
Genomic DNA hybridisations and probe selection
All six samples of gDNA (500 ng) were labelled using the Bioprime DNA labelling system according to the manu-facturer's instructions (Invitrogen, Paisley, UK) and hybridised to the Affymetrix Arabidopsis ATH1-121501 or Rice Genome GeneChip arrays for 16 h at 45°C using standard Affymetrix hybridisation protocols (Affymetrix, Santa Clara, CA, USA). The GeneChip arrays were scanned using an Affymetrix 3000 GeneArray scanner and gDNA cell intensity files (.cel files) were generated using the Microarray Analysis Suite (MAS Version 5, Affymetrix). Probe-pairs from the gDNA .cel files were selected using a
.cel file parser script [31] which produces a probe-mask file (.cdf) compatible with a range of microarray analysis packages and containing only probe-pairs in which the perfect-match probe has a gDNA hybridisation intensity greater than the user defined gDNA hybridisation thresh-old [22]. The probe-mask files were produced using the following gDNA hybridisation intensity thresholds: 25, 30, 35, 40, 45, 50, 75, 100, 150, 200, 300... 1000. A probe-set was removed from the analysis once the gDNA hybrid-isation intensity for all 11 of its probe-pairs fell below the designated threshold.
Re-analysis of transcriptome data
At each gDNA hybridisation intensity threshold a single .cdf probe-mask file was created for both Arabidopsis and rice, based on the three replicate gDNA hybridisations. This was achieved by an iterative process using the .cel file parser script. Initially, the script was run with using the gDNA .cel file from replicate one and the ATH1-121501 or Rice Genome .cdf file [32]. This generated a new .cdf file, 'Rep1.cdf', containing probe-pairs in which the per-fect-match probe had a gDNA hybridisation intensity greater than the user defined gDNA hybridisation thresh-old, based on replicate one. This process was repeated using the gDNA .cel file from replicate two and the 'Rep1.cdf'. This generated a second .cdf file, 'Rep12.cdf', containing probe-pairs in which the perfect-match probe had a gDNA hybridisation intensity greater than the user defined gDNA hybridisation threshold, based on repli-cates one and two. Finally, the process was repeated using the gDNA cel file from replicate three and the 'Rep12.cdf'. This generated the final .cdf file, 'Rep123.cdf', containing probe-pairs in which the perfect-match probe had a gDNA hybridisation intensity greater than the user defined gDNA hybridisation threshold, based on replicates one, two and three. This .cdf file was used for analysing the transcriptional data sets.
BMC Genomics 2007, 8:344 http://www.biomedcentral.com/1471-2164/8/344
used in the analysis were: 3_at, AFFX-BioB-5_at, AFFX-BioB-M_at, AFFX-BioC-3_at, AFFX-BioC-AFFX-BioB-5_at, AFFX-BioDn-3_at, AFFX-BioDn-5_at, AFFX-CreX-3_at, AFFX-CreX-5_at, 3_at, AFFX-r2-Ec-bioB-5_at, AFFX-r2-Ec-bioB-M_at, AFFX-r2-Ec-bioC-3_at, Ec-bioC-5_at, Ec-bioD-3_at, AFFX-r2-Ec-bioD-5_at, AFFX-r2-P1-cre-3_at, AFFX-r2-P1-cre-5_at, AFFX-Os-r2-Ec-bioB-3_at, AFFX-Os-r2-Ec-bioB-5_at, AFFX-Os-r2-Ec-bioB-M_at, AFFX-Os-r2-Ec-bioC-3_at, AFFX-Os-r2-Ec-bioC-5_at, AFFX-Os-r2-Ec-bioD-3_at, AFFX-Os-r2-Ec-bioD-5_at, AFFX-Os-r2-P1-cre-3_s_at, AFFX-Os-r2-P1-cre-5_s_at
Initially, the RNA .cel files were loaded into GeneSpring GX (Agilent Technologies, Palo Alto, CA, USA) using the RMA normalisation algorithm [11]. The ATH1-121501 or Rice Genome .cdf files (obtained from Affymetrix [32]), representing analysis without gDNA based probe selec-tion files, was then used to normalise the RNA .cel files. These RNA .cel files were then reanalysed using the gDNA .cdf files ('Rep123.cdf') generated at a range of gDNA hybridisations thresholds from 25 to 1000 (see above). This generated 18 data sets within each experiment. Within each data set a further normalisation was per-formed to standardise the expression data to the median expression value for each probe-set across all replicates (i.e. n = 3, as defined by the original experimenters). Within each data set, genes whose expression differed sig-nificantly between one or more condition (p < 0.05) were identified using a Welch's t-test and the Benjamini-Hoch-berg False Discovery Rate (FDR) multiple testing correc-tion. For Arabidopsis Data Set A, data were filtered to identify genes whose expression differed significantly in at least 1, 2, 3 or 4 of the 6 conditions.
Abbreviations
GCOS – GeneChip Operating system
gDNA – Genomic DNA
MAS – Microarray suite
MM – Mis-match probe
PM – Perfect match probe
Authors' contributions
NSG and MRB contributed to the conception and design of the study, to data analysis, and to the drafting and edit-ing of the manuscript. PJW and JPH contributed to the conception and design of the study, and to the drafting and editing of the manuscript. STM contributed to the conception and design of the study, to the drafting and editing of the manuscript and developed the perl scripts. All authors read and approved the final manuscript.
Acknowledgements
We thank Timothy Close, Harkamal Walia, Clyde Wilson, Abdel Ismail, Linghe Zhang (University of California Riverside) who generated the Rice data set and Gene Tanimoto (Affymetrix Inc.) for advice on the bacterial control genes on the Rice Genome array. This work was supported by the BBSRC (NSG, STM), Scottish Executive, Environment and Rural Affairs Department (PJW) and the UK Department for Environment, Food and Rural Affairs (grants – HH3501SFV, HH3504SFV, [JPH, MRB, PJW]). All the Xspecies scripts and DNA .cel files used in this study are available at the NASC Xspecies site [31].
References
1. Lipschutz RJ, Fodor SPA, Gingeras TR, Lockhart DJ: High density
synthetic oligonucleotide arrays. Nature Genetics 1999,
21:20-24.
2. Henning L, Menges M, Murray JA, Gruissem W: Arabidopsis
tran-script profiling on Affymetrix GeneChip arrays. Plant Molecular
Biology 2003, 53:457-465.
3. Zhu T, Wang X: Large scale profiling of the Arabidopsis
tran-scriptome. Plant Physiology 2000, 124:1472-1476.
4. Craigon DJ, James N, Okyere J, Higgins J, Jotham J, May S: NASCAr-rays: A repository for microarray data generated by NASC's
transcriptomics service. Nucleic Acids Research 2004,
32:D575-D577.
5. Redman RD, Schwartz C, Morel JL, Edmondson J: Development
and evaluation of an Arabidopsis whole genome Affymetrix
probe array. Plant Journal 2004, 38:545-561.
6. Grigoryev DM, Ma S-F, Simon BA, Irizarrt RA, Ye SQ, Garcia JGN: In
vitro identification and in silico utilization of interspecies
sequence similarities using GeneChip® technology. BMC
Genomics 2005, 6:62.
7. Seo J, Hoffman EP: Probe-set algorithms: Is there a rational
best bet? BMC Bioinformatics 2006, 7:395.
8. Affymetrix Microarray Suite User Guide [http://www.affyme
trix.com/support/technical/manuals.affx]
9. Li C, Wong WH: Model-based analysis of oligonucleotide arrays: expression index computation and outlier detection.
Proceedings of the National Academy of Sciences of the United States of America 2001, 98:31-36.
10. Li C, Wong WH: Model-based analysis of oligonucleotide
arrays: design issues and standard error application. Genome
Biology 2001, 2:0032.1-0032.11.
11. Irizarry RA, Hobbs B, Collin F, Beazer-Barclay YD, Antonellis KJ, Scherf U, Speed TB: Exploration, normalization, and summa-ries of high density oligonucleotide array probe level data.
Biostatistics 2003, 4:249-264.
12. Zhang L, Miles MF, Aldape KD: A model of molecular
interac-tions on short oligonucleotide microarrays. Nature
Biotechnol-ogy 2003, 21:818-821.
13. Wu Z, Irizarry RA: Reprocessing of oligonucleotide array data.
Nature Biotechnology 2004, 22:656-658.
14. Chismar JD, Mondala T, Fox HS, Roberts E, Langford D, Masliah E, Salomon DR, Head SR: Analysis of results variability from high-density oligonucleotide arrays comparing same-species and
cross-species hybridisations. Biotechniques 2002, 33:516-524.
15. Enard W, Khaitovich P, Klose J, Zollner S, Heissig F, Giavalisco P, Nieslt-Struwe K, Muchmore E, Varki A, Ravid R, Doxiadis GM, Bon-trop RE, Paabo S: Intra- and interspecific variation in primate
gene expression patterns. Science 2002, 296:340-343.
16. Caceres M, Lachuer J, Zapala MA, Redmond JC, Kudo L, Geschwind DH, Lockhart DJ, Preuss TM, Barlow C: Elevated gene expression levels distinguish human from non-human primate brains.
Proceedings of the National Academy of Sciences of the United States of America 2003, 100:13030-13035.
17. Higgins MA, Berridge BR, Mills BJ, Schultze AE, Gao H, Searfoss GH, Baker TK, Ryan TP: Gene expression analysis of the acute
phase response using a canine microarray. Toxicological Sciences
2003, 74:470-484.
18. Becher M, Talke IN, Krall L, Krämer U: Cross-species microarray transcript profiling reveals high constitutive expression of metal homeostasis genes in shoots of the zinc
Publish with BioMed Central and every scientist can read your work free of charge "BioMed Central will be the most significant development for disseminating the results of biomedical researc h in our lifetime."
Sir Paul Nurse, Cancer Research UK
Your research papers will be:
available free of charge to the entire biomedical community
peer reviewed and published immediately upon acceptance
cited in PubMed and archived on PubMed Central
yours — you keep the copyright
Submit your manuscript here:
http://www.biomedcentral.com/info/publishing_adv.asp
BioMedcentral
19. Khaitovich P, Weiss G, Lachmann M, Hellman I, Enard W, Muetzel B, Wirkner U, Ansorge W, Paabo S: A neutral model of
transcrip-tome evolution. Public Library of Science Biology 2004, 2:682-689.
20. Uddin M, Wildman DE, Liu GZ, Xu WB, Johnson RM, Hof PR, Kapa-tos G, Grossman LI, Goodman M: Sister grouping of chimpan-zees and humans as revealed by genome-wide phylogenetic
analysis of brain gene expression profiles. Proceedings of the
National Academy of Sciences of the United States of America 2004,
101:2957-2962.
21. Weber M, Harada E, Vess C, van Roepenack-Lahaye E, Clemens S:
Comparitive microarray analysis of Arabidopsis thaliana and
Arabidopsis halleri roots identifies nicotinamine synthase, a
ZIP transporter and other genes as potential metal
hyperac-cumulation factors. Plant Journal 2004, 37:269-281.
22. Hammond JP, Broadley MR, Craigon DJ, Higgins J, Emmerson ZF, Townsend HJ, White PJ, May ST: Using genomic DNA-based probe-selection to improve the sensitivity of high-density oli-gonucleotide arrays when applied to heterologous species.
Plant Methods 2005, 1:10.
23. Hammond JP, Bowen HC, White PJ, Mills V, Pyke KA, Baker AJM, Whiting SN, May ST, Broadley MR: A comparison of the Thlaspi
caerulescens and Thlaspi arvense shoot transcriptomes. New
Phytologist 2006, 170:239-260.
24. Schmid M, Davison TS, Henz SR, Pape UJ, Demar M, Vingron M, Schölkopf B, Weigel D, Lohmann J: A gene expression map of
Arabidopsis development. Nature Genetics 2005, 37:501-506.
25. PlexDb database [http://www.plexdb.org]
26. Walia H, Wilson C, Condamine P, Liu X, Ismail AM, Zeng L, Wana-maker SI, Mandal J, Xu J, Cui X, Close TJ: Comparative transcrip-tional profiling of two contrasting rice genotypes under
salinity stress during vegetative growth stage. Plant Physiology
2005, 139:822-835.
27. Mei R, Hubbell E, Bekiranov S, Mittmann M, Christians FC, Shen MM, Lu G, Fang J, Liu WM, Ryder T, Kaplan P, Kulp D, Webster TA:
Probe selection for high-density oligonucleotide arrays.
Pro-ceedings of the National Academy of Sciences of the United States of Amer-ica 2003, 100:11237-11242.
28. Ji W, Zhou WL, Gregg K, Yu N, Davis S, Davis S: A method for cross-species gene expression analysis with high-density
oli-gonucleotide arrays. Nucleic Acids Research 2004, 32:e93.
29. Czechowski T, Stitt M, Altmann T, Udvardi MK, Scheible W-R:
Genome-wide identification of superior reference genes for
transcript normalisation in Arabidopsis. Plant Physiology 2005,
139:5-17.
30. Shen L, Gong J, Caldo RA, Nettleton D, Cook D, Wise RP, Dickerson
JA: BarleyBase – An expression profiling database for plant
genomics. Nucleic Acids Research 2005, 33:D614-D618.
31. Xspecies .cel file parser Version 1.1.and Version 2 [http://
affymetrix.arabidopsis.info/xspecies/]
32. Affymetrix [http://www.affymetrix.com]