http://wrap.warwick.ac.uk/
Original citation:Proceedings of the third program visualization workshop. University of Warwick.
Department of Computer Science. (Department of Computer Science Research Report). CS-RR-407
Permanent WRAP url:
http://wrap.warwick.ac.uk/61322
Copyright and reuse:
The Warwick Research Archive Portal (WRAP) makes this work by researchers of the University of Warwick available open access under the following conditions. Copyright © and all moral rights to the version of the paper presented here belong to the individual author(s) and/or other copyright owners. To the extent reasonable and practicable the material made available in WRAP has been checked for eligibility before being made available.
Copies of full items can be used for personal research or study, educational, or not-for-profit purposes without prior permission or charge. Provided that the authors, title and full bibliographic details are credited, a hyperlink and/or URL is given for the original metadata page and the content is not changed in any way.
A note on versions:
Program Visualization Workshop
The University of Warwick, UK, July 1–2, 2004
Ari Korhonen, editor
Research Report CS-RR-407 Department of Computer Science
The University of Warwick Coventry CV4 7AL
The articles are c2004 by the individual authors.
Distribution:
University of Warwick
Department of Computer Science Coventry CV4 7AL
UK
Tel: +44 24 7652 3193 Fax: +44 24 7657 3024
Email: [email protected] URL: http://www.dcs.warwick.ac.uk/
Printed by WarwickPrint, 2004.
Foreword
This is the proceedings of the Third Program Visualization Workshop, PVW’04, orga-nized at the University of Warwick, UK, on July 1–2, 2004.
Program Visualization Workshop has been organized in Europe every second year since year 2000. Previous workshops have been organized in Porvoo, Finland (2000) and at HornstrupCentret, Denmark (2002). All workshops have also been organized in co-operation with ACM SIGCSE and in conjunction with the ITICSE conference, to promote participation in both conferences.
The aim of the workshop is to bring together researchers who design and construct visualizations and visualization systems for computer science, especially for programs, data structures and algorithms, and, above all, educators who use and evaluate visu-alizations in their teaching. Due to the limited number of participants and that most participants are actively working in the field of software visualization, the workshop pro-vides an excellent opportunity to exchange ideas and experiences, as well as disseminate novel systems.
This year twenty-two participants from ten countries attended the workshop. The invited lecture by Ben du Boulay from the University of Sussex and twenty paper presentations gave us an excellent overview of current lines of research in program visualization and algorithm animation, as well as in several other interesting topics in the visualization field. In addition, the workshop allowed us to get to know many people working in the field, and thus give seeds to fruitful co-operation in the future.
This proceedings includes the revised and extended versions of the papers accepted to the workshop. Each paper was initially reviewed by two members of the program committee, and the first revised version was included in the pre-proceedings deliv-ered to the participants in the workshop. All papers were presented in the workshop and many fruitful discussions followed the presentations. After the workshop at least one member of the program committee critically reviewed each paper to give oppor-tunities to improve the papers even more. In addition, the authors were allowed to extend the papers to include more details, examples and arguments. The final versions are now included in this proceedings. The papers themselves are available online at: http://www.cs.hut.fi/Research/PVW04/.
I wish to thank the program committee members for their critical and encouraging comments on all of the papers. The program committee was
• Lauri Malmi, Helsinki University of Technology, Finland (chair) • Mordechai Ben-Ari, Weizmann Institute of Science, Israel • Mike Joy, University of Warwick, UK
• Ari Korhonen, Helsinki University of Technology, Finland • Guido R¨oßling, Technische Universit¨at Darmstadt, Germany • Rocky Ross, Montana State University, USA
• Angel Vel´azquez-Iturbide, Universidad Rey Juan Carlos, Spain´
Mike Joy was also responsible for the local arrangements, and I wish to thank him for his excellent work. The proceedings was edited by Ari Korhonen.
Espoo, Finland, October 2004
Contents
Invited Lecture
Representation in Learning Computer Science: Black Boxes in Glass Boxes Revisited
Ben du Boulay, University of Sussex . . . 1
Paper Presentations
A Survey of Program Visualizations for the Functional Paradigm Jaime Urquiza-Fuentes, J. ´Angel Vel´azquez-Iturbide . . . 2 Enhanced Expressiveness in Scripting Using AnimalScript 2
Guido R¨oßling, Felix Gliesche, Thomas Jajeh, Thomas Widjaja . . . . 10 THORR: A Focus + Context Method for Visualising Large Software Systems
Eoin McCarthy, Chris Exton . . . 18 MatrixPro – A Tool for On-The-Fly Demonstration of Data Structures and Algorithms
Ville Karavirta, Ari Korhonen, Lauri Malmi, Kimmo St˚alnacke . . . 26 Multi-Lingual End-User Programming with XML
Rob Hague, Peter Robinson . . . 34 Multimodal Modelling Languages to Reduce Visual Overload in UML Diagrams
Kirstin Lyon, Peter J. N¨urnberg . . . 41 Concretization and animation of Finite Automata with c-cards Andrea Valente . . . 48 A Lightweight Visualizer for Java
John Hamer . . . 54 Program state visualization tool for teaching CS1
Otto Sepp¨al¨a . . . 62 Application of Helix Cone Tree Visualizations to Dynamic Call Graph Illustration
Jyoti Joshi, Brendan Cleary, Chris Exton . . . 68 Algorithm Visualization through Animation and Role Plays
Jarmo Rantakokko . . . 76 Inside the Computer: Visualization and Mental Models
Cecile Yehezkel, Mordechai Ben-Ari, Tommy Dreyfus . . . 82 An Approach to Automatic Detection of Variable Roles in Pro-gram Animation
TeeJay - A Tool for the Interactive Definition and Execution of Function-oriented Tests on Java Objects
Ralph Weires, Rainer Oechsle . . . 94 JavaMod: An Integrated Java Model for Java Software Visual-ization
Micael Gallego-Carrillo, Francisco Gort´azar-Bellas, J. ´Angel Vel´azquez-Iturbide . . . 102 Towards Tool-Independent Interaction Support
Guido R¨oßling, Gina H¨aussge . . . 110 Taxonomy of Visual Algorithm Simulation Exercises
Ari Korhonen, Lauri Malmi . . . 118 What a Novice Wants: Students Using Program Visualization in Distance Programming Course
Osku Kannusm¨aki, Andr´es Moreno, Niko Myller, Erkki Sutinen . . . . 126 Selecting a Visualization System
Sarah Pollack, Mordechai Ben-Ari . . . 134 Survey of Effortlessness in Algorithm Visualization Systems
Representation in Learning Computer Science:
Black Boxes in Glass Boxes Revisited
Ben du Boulay, University of Sussex
Central issues in the teaching of computer science and other subjects such as math-ematics are those of the nature and use of representations. In Open Learning Envi-ronments a crucial role of representation is to encode and then offer students ways of thinking about the entities, relationships and processes of the domain in question. For example, in our work on learning Prolog, much effort centred on trying to make pro-gram trace information at once both meaningful yet explicit about the complex, and normally implicit, processes such as unification and search underpinning that computer language. In our work on the Discover system, an even more explicit model of the functioning of the virtual machine was provided to aid both program construction as well as debugging. In our work on an advice system for novice Unix file system users, the representation issue was centred not just on the semantics of the domain, but also on novices’ misunderstandings of that domain. The system needed to make plausible inferences about what the user might have meant to achieve when they typed the pecu-liar command that did. In our current work with Java we have been exploring the way that programmers exploit the multiple representations typically available in a program development and debugging environment to build a coherent understanding of the pro-gram as a complex multi-faceted entity. Indeed like Prolog, Java provides complex, but normally implicit process that learners need to understand if they are to be successful programmers.
A Survey of Program Visualizations for the Functional
Paradigm
Jaime Urquiza-Fuentes, J. ´Angel Vel´azquez-Iturbide Universidad Rey Juan Carlos, Madrid, Spain
{j.urquiza,a.velazquez}@escet.urjc.es 1 Introduction
One of the definitions for visualization is to give a visible appearance to something, mak-ing it easier to understand. In Price et al. (1998), software visualization is defined as “the use of crafts of typography, graphic design, animation and cinematography with modern human-computer interaction and computer graphics technology to facilitate both the human understanding and effective use of computer software”. Program visualization is defined as “the visualization of actual program code or data structures in either static or dynamic form”. We focus on the functional programming paradigm here. We study crafts used to visualize functional program code and data structures. The study has been done over sixteen systems. These systems can be categorized in multiple ways (Price et al., 1993; Myers, 1986; Brown, 1998). Although we do not want to make a new taxonomy, we differentiate among integrated development environmens, debuggers, teaching systems and visualization systems.
We have made a compilation of information about functional visualization systems (this information is very dispersed). In general, most systems are partial solutions to the main problem; the visualization of functional programs. Our ultimate aim is to find a more general solution.
In section 2 particular aspects of the functional paradigm are introduced. Section 3 briefly describes the systems we studied. The visualization of each particular aspect identified is presented in section 4. In section 5 the evaluation of some systems is described. Finally we draw our conclusions in section 6.
2 Features of the Functional Paradigm
The functional programming paradigm has some particular features that are needed to be visualized to understand the execution of a program. In functional programming the source code of a program is formed of bodies of functions. Each function is a set of rules. In the following, a program to compute the addition of elements in a list is shown:
fun sumlist list(int) -> int | sumlist([]) = 0
| sunlist(head::rest) = head + sumlist(rest);
The execution of a functional program begins with an expression in which some of the functions of the program are called. Each execution step is a rewriting step applied on an expression, and its result will be another expression. The following are all the rewriting steps of the execution of sumlist([3,5,2]).
sumlist([3,5,2]) ⇒sumlist(3::[5,2]) 3 + sumlist([5,2]) ⇒sumlist(5::[2]) 3 + 5 + sumlist([2]) ⇒sumlist(2::[]) 3 + 5 + 2 + sumlist([]) ⇒sumlist([]) 3 + 5 + 2 + 0
3 + 5 + 2 3 + 7
As shown in the previous example, the rewriting steps are applied to parts of the whole expression (framed code in the example). For each step, the next subexpression to rewrite (or reduce) is called theredex. Each rewriting step is related to the evaluation of a (sub)expression, and each evaluation gives (sub)results. Therefore, important aspects to visualize are the evaluation of (sub)expressions, its corresponding redexes and the (sub)results obtained.
Another feature to visualize is the order in which function calls are executed. Two impor-tant details are the evaluation of parameters and how pattern matching is used to select the appropiate rule in the body of the function to be applied.
The environment of variables (also called contour) fixes their values, so it will be important to clearly visualize those environments. Moreover, if complex data structures are used in a program, as lists or trees, it will be desirable to work with special visualizations for them.
There are two ways (also called strategies) of executing a functional program. The previous example shows eager execution. Alternatively, lazy execution evaluates an expression only when necessary. For example, the expression fact(4+2) is reduced to if((4+2)=1) then 1 else (4+2)*fact((4+2)-1). The function fact is applied before evaluating the argument 4+2. In order to avoid inefficiency, the subexpression 4+2 does not appear 3 times, but it is unique and shared among the three places. Therefore, expression sharing is an important feature of lazy evaluation to visualize.
3 Systems Studied
Normally, the features to be visualized and the way this is achieved depend on the class of the system being used. We have therefore classified systems into four categories: integrated development environments, debuggers, teaching systems and visualizing systems.
Integrated development environments use to integrate a number of tools under the same interface. CIDER (Hanus and Koj, 2001) uses the lazy language Curry. It integrates edition, program analysis tools, a graphical debugger, and a dependency graph drawing. Execution data are collected in a trail. Its debugger supports breakpoints and changing the execution direction.
WinHIPE (Naharro-Berrocal et al., 2002) uses the language Hope. Programs are executed under the eager stategy. It shows the set of expressions resulting during an evaluation. Its debugger provides general options such as executing one or n steps, evaluating to the next breakpoint, evaluating the redex or backtracking to a previous expression. It shows graphically lists and trees and supports a wide range of customizations, including graphical format, typo-graphic characteristics and subexpression visibility. From the static visualizations generated, it allows building animations that can be saved and loaded for educational use.
ZStep(Lieberman and Fry, 1998) is a Lisp integrated environment. Its debugger supports execution in both directions, evaluating the selected expression and executing until the end. Speed execution control and a tree function calls are also provided. Execution data can again be found in a trail. ZStep simultaneously shows the source code and the execution code. Execution errors are located in the same place where the correct values should be located.
The last environment is calledTERSE (Kawaguchi et al., 1994). Properly speaking, it is not a functional program environment, but rather a term rewriting system (which is the basis of functional program execution). It has been developed with Standard ML/NJ, and allows transforming TERSE programs into Standard ML programs. During execution it allows selecting, among all redexes available, the one that will be reduced. Also, it permits to choose the rule to apply and the execution strategy. It shows a global vision of the expression, represented as a tree, and a zoomed vision of a particular area of it, and also generates rewriting sequences.
graph to guide the user while debugging.
Hat (Sparud and Runciman, 1997) also supports a subset of Haskell. It generates a trail of reduced redexes, allowing to browse it in a graphical way.
Hood (Gill, 2000) uses the whole Haskell language. To visualize the execution, the source code must be modified, inserting calls to the visualization system where a visualization is needed (either a function or a data structure). The visualization is obtained as a result of the execution of the program.
Prospero (Taylor, 1995) and Hint (Foubister and Runciman, 1995) are very similar sys-tems. Prospero uses the language Miranda and Hint uses a subset of Haskell. Both generate and use a trail. While debugging, they allow using breakpoints, but do not allow changing the direction of the execution.
Teaching systems usually focus the user’s attention on particular aspects of programming languages in order to gain understanding. Evaltrace (Touretzky and Lee, 1992) uses Lisp. Its visualizations are documents generated with LATEX. This system is focused on differentiating between applying and evaluating actions. It also visualizes macros and side effects. It is integrated into a programming environment.
KIEL (Berghammer and Milanese, 2001) works with a subset of the language Standard ML, were only first order functions are allowed. It allows changing the execution strategy and executing a number of rewriting steps.
DrScheme (Findler, 2002) uses the language Scheme. It allows using four subsets of the language. When a error is produced,DrScheme locates the function call that produced it. It has an static debugger which, using type inference, can predict potential errors.
KAESTLE & FooScape (Boecker et al., 1986) work with Lisp too, but they only visualize data structures and function call graphs. They can generate snapshots of each visualization and sequences of them. They use trails generated by the FranzLisp system and are also integrated in a programming environment.
We have studied two visualization systems. GHood (Reinke, 2001), which graphically shows the observations made by Hood. It has typical VCR controls and possible EPS output of its graphs. It generates animations where the speed can be controlled. Visual Miranda (Auguston and Reinfelds, 1994) uses the language Miranda. It generates a textual trail, but it can be shown in a graphical way.
4 Partial Visualizations of Functional Programs
In this section, we describe how the systems cited above support the visualization of the different aspects (partial visualizations) of functional programming mentioned in the second section. Four partial visualizations and some existing combinations of them are considered.
4.1 (Sub)expressions, Redexes and (Sub)results
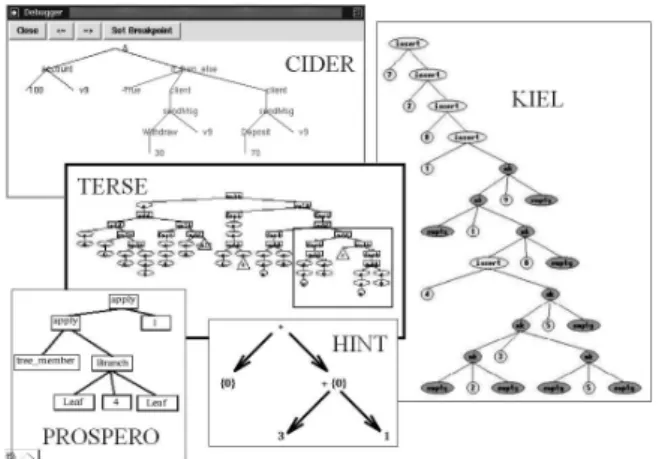
A functional expression has a tree structure, so all systems work internally with expressions represented as trees (or directed graphs in lazy functional languages). Many systems also visualize expressions as trees (see Fig. 1). These are CIDER,KIEL(which allows interacting directly with the abstract syntax tree), Prospero, Hint and TERSE (which gives a different representation to constructors, variables and functions).
Figure 1: Expressions represented as trees Figure 2: Compression of large expressions
All systems except Hood & GHood and Evaltrace highlight the redex (see Fig. 3). Hood & GHood only show the value of a variable marked as observable.
Hat,Freja,Buddha and Evaltrace connect each subexpresion and the result of its evalua-tion. DrScheme shows simultaneously the current expression, its reduction and the function definition used in the rewriting step. Visual Miranda connects the expression with its subex-pressions and finally with its result (see Fig. 4).
Figure 3: Redex highlighting Figure 4: Connecting expressions & results
4.2 Function Calls, Function Application and Pattern Matching
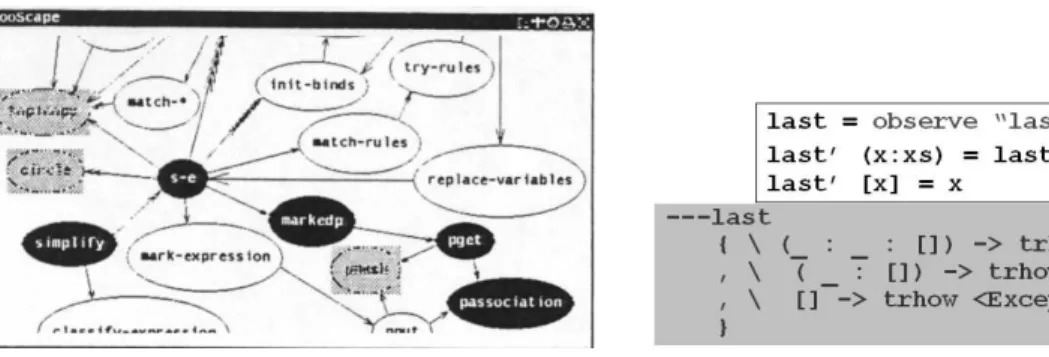
Figure 5: A function call graph in FooScape Figure 6: A Hood observation Function calls may also be used as an auxiliary element, even though they do not play an important element in visualizations. Thus, WinHIPE uses function calls as breakpoints, but the visualization displays the current expression as a whole.
4.3 Variables and Data Structures
The contour of variables and their values is visualized in several ways. All the systems show variable values. Hood is a special case, because it shows values in a particular location of the source code, so in the body of a function, the user can choose to visualize a variable in a rule and not in others. Evaltrace identifies a contour by connecting the begining and the end with a thick line. If this line is solid, then the global contour is the parent of the present contour. Otherwise, there is a local variable definition and the parent contour is the closest enclosing one. DrScheme connects variables and their occurences with lines (see Fig. 7). Visual Miranda shows the value for each variable before evaluating a (sub)expression (see Fig. 4).
Figure 7: Contour visualization withDrScheme and Evaltrace
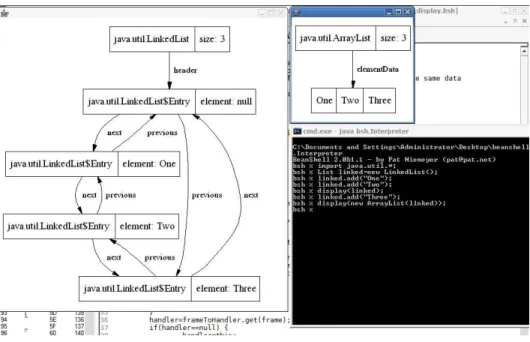
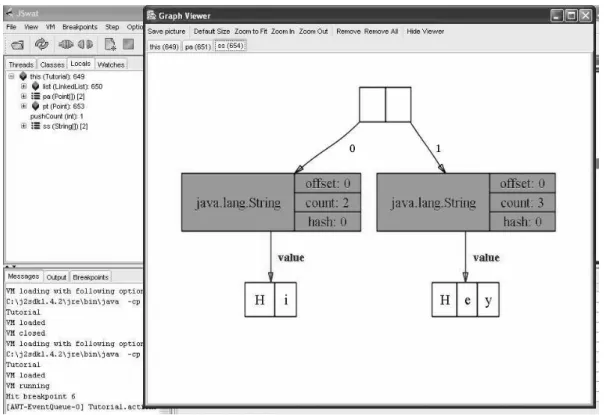
Only two systems allow alternative visualizations of complex structures (see Fig. 8). WinHIPE permits to customize the visualization of tree and lists, by identifying constructors used (the predefined constructors of the language for lists; Node andEmpty for binary trees), and assigning to it the corresponding shapes, line styles, background and foreground colours and dimensions defined by the user configuration. KAESTLE & FooScape visualize lists by drawing their elements into squares, putting one after another or connecting them with arcs as needed. It allows modifying the layout of each list visualized and its contents.
4.4 Subexpression Sharing in Lazy Evaluation
Systems supporting lazy evaluation should visualize shared subexpressions. CIDER and Hat do not visualize shared subexpressions until they are reduced, then they highlight all oc-curences of the shared subexpression. Prospero and Hint (see Fig. 9) only visualize once a shared subexpression, being connected the rest of occurrences to the first one by arcs or labels.
Figure 9: Visualization of shared subexpressions in lazy evaluation
4.5 Combining Partial Visualizations
Some systems combine some of the previous partial visualizations. While Hood & GHood are able to show values of variables and results of function calls, andKAESTLE & FooScape display a function call graph and current state of lists in the program, the rest of systems tend to blur the separation of code and data in functional programs. WinHIPE, DrScheme and Visual Miranda display values and data structures integrated into expressions. Evaltracedoes it too but in a different way, by integrating values of variables into a pretty-printed textual description of the execution of the program. In addition DrScheme and Evaltrace show the contour of variables, andVisual Miranda is able to display the full pattern matching process.
5 Systems Evaluation
We have only found two documented experimental evaluations of systems. The first (Chitil et al., 2001) is a comparative study of three systems: Freja, Hat and Hood. The study is focused on their tracing and debugging facilities. A number of criteria are evaluated for each system: readability of expressions, the process of locating an error, redexes and language constructs, and modification of the program. This study identifies strengths and weakness of each system and then suggest how the systems can be improved.
The second documented evaluation (Medina-S´anchez et al., 2004) is of the WinHIPE environment. This evaluation is focused on effortlessness and usability of animations and their construction process. The experiment was done with students and its results show that animations are easy to use, its construction process is easy to learn, and are understood as a help to complete other tasks, such as debugging or program understanding.
There are two more evaluations but they are documented in a rather informal way. In the section 6 of Findler (2002) some experience with DrSchemeis briefly described and in section 5 of Reinke (2001) some details are shown about experience with GHood.
6 Conclusions
hand, we have considered the most important partial views provided about functional pro-grams (expression evaluation, function calls, values, and subexpression sharing). Our selection of these dimensions has been pragmatical: we do not pretend these dimensions to be the most important ones, but we found them especially clarifying to us. In Price et al.’s taxonomy, the corresponding categories are program (B.1) and purpose (F.1).
In spite of this variety of visualizations, none provides comprehensive visualizations, with multiple views of all the aspects. There are several systems covering several features of functional programming, more comprehensive visualizations are still lacking. We advocate for a comprehensive approach that would make use of solutions given by current systems. A comprehensive approach could offer current partial views, but it would also offer more powerful and flexible visualizations on the different features of functional programs.
Such a comprehensive visualization still has to be designed. However, notice that the first identified feature, namely expression evaluation, is the basic element of the functional paradigm. Consequently, it should be the basis if the new visualization. Two other features (function calls and values) are partial views that mimic our understanding of program exe-cution derived from the imperative paradigm. Therefore, they should be integrated in the expression model. Finally, subexpression sharing is a particular and important aspect of lazy evaluation.
Acknowledgements
This work has been supported by projects GCO-2003-11 of the Universidad Rey Juan Carlos and TIN2004-07568 of the Ministerio de Educaci´on y Ciencia.
References
M. Auguston and J. Reinfelds. A Visual Miranda Machine. In Proceedings of the Software Education Conference (SRIT-ET’94), pages 198–203. IEEE Computer Society Press, 1994. R. Berghammer and U. Milanese. Kiel - a computer system for visualizing the execution of functional programs. In Functional and (Constraint) Logic Programming, WFLP 2001, pages 365–368, Christian-Albrechts-Universitt zu Kiel, 2001. Report No. 2017.
H.D. Boecker, G. Fisher, and H. Nieper. The enhancement of understanding through visual representations. InProceedings of the ACM SIGCHI’86 Conference on Human Factors in Computing, pages 44–50. ACM Press, 1986.
M.H. Brown. A taxonomy of algorithm animation displays. In J.T. Stasko, J. Domingue, M.H. Brown, and B.A. Price, editors,Software Visualization. Programming as a Multimedia Experience, pages 35–42. MIT Press, 1998.
O. Chitil, C. Ruciman, and M. Wallace. Freja, Hat and Hood - A comparative evaluation of three systems for tracing and debugging lazy functional programs. In Implementation of Functional Languages, 12th International Workshop, IFL 2000, Selected Papers, volume 2011 of LNCS, pages 176–193. Springer, 2001.
R.B. Findler. DrScheme: A programming environment for Scheme. Journal of Functional Programming, 12(2):159–182, March 2002.
S.P. Foubister and C. Runciman. Techniques for simplifying the visualization of graph reduc-tion. In K. Hammond, D.N. Turner, and P.M. Sansom, editors, Functional Programming, pages 65–77. Springer, 1995.
M. Hanus and J. Koj. Cider: An integrated development environment for Curry. InFunctional and (Constraint) Logic Programming, WFPL 2001, pages 369–373, Christian-Albrechts-Universitt zu Kiel, 2001. Report No. 2017.
N. Kawaguchi, T. Sakabe, and Y. Inagaki. Terse: Term rewriting support environment. In Proceedings of the 1994 ACM SIGPLAN Workshop on Standard ML and its Applications, pages 91–100. ACM Press, 1994.
H. Lieberman and C. Fry. ZStep95: A reversible, animated source code stepper. In J. T. Stasko, J. Domingue, M. H. Brown, and B. A. Price, editors, Software Visualization. Pro-gramming as a Multimedia Experience, pages 277–292. MIT Press, 1998.
M. ´A. Medina-S´anchez, C.A. L´azaro-Carrascosa, C. Pareja-Flores, J. Urquiza-Fuentes, and J. ´A. Vel´azquez Iturbide. Empirical evaluation of usability of animations in a functional programming environment. Technical report, Departamento de Sistemas Inform´aticos y Programaci´on, Universidad Complutense de Madrid, Madrid, Spain, 2004. Ref. 141/04. B. Myers. Visual programming, programming by example, and program visualization: A
tax-onomy. InProceeding of the ACM SIGCHI’86 Conference on Human Factors on Computing Systems, pages 59–66. ACM Press, 1986.
F. Naharro-Berrocal, C. Pareja-Flores, J. Urquiza-Fuentes, J. ´A. Vel´azquez-Iturbide, and F. Gort´azar-Bellas. Redesigning the animation capabilities of a functional programming environment under an educational framework. In M. Ben-Ari, editor, Proceedings of the Second Program Visualization Workshop, pages 60–69, University of Aarhus, Department of Computer Science, 2002. DAIMI PB - 567.
H. Nilsson and J. Sparud. The evaluation dependence tree as a basis for lazy functional debugging. Automated Software Engineering, 4(2):121–150, April 1997.
B. Pope. Buddha - A Declarative Debbuger for Haskell. PhD thesis, Department of Computer Science, The University of Melbourne, Australia, June 1998.
B.A. Price, R. Baecker, and I. Small. An introduction to software visualization. In J. T. Stasko, J. Domingue, M. H. Brown, and B.A. Price, editors, Software Visualization. Programming as a Multimedia Experience, pages 3–27. MIT Press, 1998.
B.A. Price, R.M. Baecker, and I.S. Small. A principled taxonomy of software visualisation. Journal of Visual Languages and Computing, 4(3):211–266, September 1993.
C. Reinke. GHood: Graphical visualisation and animation of Haskell object observations. In R. Hinze, editor, Proceedings of the 2001 ACM SIGPLAN Haskell Workshop, volume 59 of ENTCS, pages 121–149. Elsevier Science, 2001.
J. Sparud and C. Runciman. Tracing lazy functionals computations using redex trails. In H. Glasser, P. Hartel, and H. Kuchen, editors, Proc. 9th Intl. Symposium on Programming Languages, Implementations, Logics and Programs (PLILP’97), volume 1292 of LNCS, pages 291–308. Springer, 1997.
J.P. Taylor. Presenting the evaluation of lazy functions. PhD thesis, Department of Computer Science, Queen Mary University of London and Westfield College, London, UK, 1995. D.S. Touretzky and P. Lee. Visualizing evaluation in applicative languages. Communications
Enhanced Expressiveness in Scripting Using AnimalScript 2
Guido R¨oßling, Felix Gliesche, Thomas Jajeh, Thomas Widjaja
Department of Computer Science / Dept. of Business Administration and Computer Science Darmstadt University of Technology, Darmstadt, Germany
{guido, gliesche, jajeh, widjaja}@rbg.informatik.tu-darmstadt.de
Abstract
AnimalScript 2is a new implementation of the visualization languageAnimalScript used in theAnimalsystem. The new implementation adds important features, especially conditional and loop statements. It also prepares the ground for further advanced compo-nents, such as methods or object templates. Several examples illustrate the expressiveness and ease of use of AnimalScript 2.
1 Introduction
One of the many different approaches for generating algorithm or program visualization con-tent (abbreviated “AV” for the rest of this paper) isscripting. Here, the user provides a simple ASCII file containing commands that steer the visualization. The commands are usually held in plain English to make using the underlying scripting language easier. Typical examples for scripting-driven AV systems include JAWAA (Akingbade et al., 2003), JSamba (Stasko, 1998), and the JHAV ´E visualization environment with its visualization front-ends GAIGS, JSamba (Naps et al., 2000), and Animal(R¨oßling and Freisleben, 2002).
Scripting files are normally very easy to create manually. The user requires only a text editor and a certain familiarity with the scripting notation to become productive. Even better, it is relatively easy to modify existing code so that it generates scripting commands for visualization purposes while running the underlying program. Generating some working scripting code is normally rather easy. Writing a scripting code that presents a “good” visualization is more difficult. However, the same is true for any AV system that allows or forces the user to explicitly layout the visual components.
In this paper, we focus on the added capabilities to the original version of the scripting languageAnimalScriptprovided by theAnimalsystem (R¨oßling and Freisleben, 2001). To avoid confusion, we will always refer to the new implementation asAnimalScript 2, and use AnimalScriptfor the original implementation. We first review the main features of interest in the original scripting language and motivate why a new implementation was needed. The added features are then described in detail. The paper concludes with a short overview of the current implementation status and the goals we have set for the final version.
2 A Quick Overview of AnimalScript
Each AnimalScript animation consists of a single file with a set of lines. Each line can contain exactly one command or comment. To make parsing the files easier, each operation starts with a unique keyword. The parser can therefore determine the appropriate action by parsing the first keyword, although later parameters usually determine the actual action taken.
AnimalScript is parsed line-by-line. This means that once a given line is parsed, the appropriate animation commands are added to anAnimal animation. Normally, each oper-ation – whether declaroper-ation of a new object or animoper-ation effect – takes place in a separate animation step. If multiple operations shall take place in the same animation step, the user has to surround them with curly braces { } to indicate a block. Similarly to programming languages, the animation treats this block as a unit placed in the same step.
squares, lines,orcircles. To enhance the use ofAnimalfor computer science education, the following common complex objects are also supported: list elementswith an arbitrary number of points, arrays in either horizontal or vertical orientation, and source / pseudo code including indentation and highlighting.
Most commands have a set of optional parameters for setting specific properties. This includes simple settings, such as color or display depth. Arrows may be added at the beginning or end of a polyline. The user can also switch between polylines and polygons using the boolean
closed property, using closed=true for polygons, and closed=false for polyline objects. Animal offers only a small selection of animation effects at first glance, limiting the operations to show / hide, move, rotate and change color. Each animation effect can work on an arbitrary set of animation objects at the same time. The expressive power of the scripting language becomes obvious when the set of options for the commands is reviewed. For example, a move can be made to a certain location, along an object defined inside the command, orviaa previously defined object. The latter supports easy reuse of common move paths inside an animation, for example for sorting problems.
To further enhance the expressiveness of the scripting language, each object type can offer specific subtypes of a given animation effect. These are passed as an optional parameter to the standard animation effect (R¨oßling, 2001). For example, a polygon may offer the user the followingmove types:
• move the whole object,
• move a single node,
• move an arbitrary set of nodes,
• move the whole object except for a single node,
• move the whole object except for an arbitrary subset of nodes.
In this way, it is very easy to reach rather complex behavior based on a still simple notation. To further support animation authors, the computer science-based primitives also have their own set of commands. This especially concerns the following operations:
• Generating a group of source or pseudo code with user-specified font and color settings. As an exception to the general rule, each code line or line fragment is added as a sepa-rate component. This avoids exceedingly cluttered scripting code with several hundred characters in one line, and thus makes the script far easier to read;
• highlighting or unhighlighting a single line of code or a fragment thereof - for example, the boolean condition of aforloop;
• generating an array with user-defined font and color settings, either in horizontal or vertical orientation;
• installing an “array index pointer” with an optional label, useful for example to indicate an array position in sorting algorithms;
• putting values into the array and swapping array elements. The latter operation is animated automatically if a positive effect duration is specified;
• creating list elements with an arbitrary number of pointers at either the top, bottom, left or right side;
EachAnimalScriptobject has a unique ID. Once the current line is parsed, the anima-tion author can retrieve the currentbounding box of the defined object, yielding the smallest rectangle that covers the whole object.
AllAnimalScript coordinates can be specified in a number of different ways:
absolute coordinates give an explicit pair of (x, y) coordinates on the screen. To yield a visible object, x and y should be positive and within the display window borders;
locations can be defined once and reused as often as necessary;
relative coordinates are the most expressive and powerful option. Here, the location of
a given object is determined based on other visible or hidden objects. Typically, the position is determined based on thebounding box of a given object by giving one of the eight compass directions or “center” and an (x, y) offset. Polyline or polygon objects also allow placement relative to a given node. Components can also be aligned to the
base line of a text component. Finally, the location can also be defined as an offset from thepreviouscoordinate.
A special echo command can be used for user feedback. Apart from simply printing a certain text to the command line or main window, the actual bounding box of a given object or set of objects can be retrieved, as well as individual objects and their IDs. In this way, if the layout on the screen does not match the author’s expectations, some debug commands using echo can be integrated to figure out exactly what went wrong. Finally, objects can be grouped or ungrouped to save repeating the objects IDs for objects that are animated in the same way over several operations. It is important to note that a component inside a group can still be animated individually,without effect on the other group elements.
The syntax of AnimalScript, JAWAA and JSamba is roughly similar. AnimalScript uses String identifiers for objects instead of integers. Additionally, AnimalScript offers a fine-grained timing, compared to the “instant” or “animated” modes in JAWAA and JSamba. AnimalScript also boasts a far greater flexibility in animating and placing components, as outlined above.
In both JAWAA and JSamba, all parameters have to be given for all commands without an introducing keyword. Thus, commands start with a descriptive keyword, followed by a set of seemingly arbitrary values, typically of type integer. AnimalScript strictly requires keywords between most parameters, such ascolorordepth. At the same time, most param-eters including their associated keyword are optional. This combination makes the underlying script easier to read, but also somewhat longer, than scripts for JAWAA or JSamba.
As can be seen from this overview, AnimalScript is rather powerful and expressive. However, there is one crucial drawback. As stated before, each line is parsed separately, as the context of the previous lines is retrieved from the Animal-internal animation object. Thus, many of the standard parsing concepts, such as abstract syntax trees, are not needed to parseAnimalScript animations. To make the implementation easier and more efficient, we took the ultimately unfortunate implementation decision to stay at a “single line parser”. This brings one severe limitation: interesting components such as loops or conditionals can not be supported by the originalAnimalScript parser.
To address this problem, we decided to re-implement the whole parser from scratch. This was also a good opportunity to clean up some the messier parts of the source. Compared to the former implementation with about 7500 lines of code, a team of three students of Business Administration and Computer Science was formed for this task.
3 Added Features in AnimalScript2
extent of the scripting language means that we had to restrict the amount of work we could tackle at one time.
The main goal of developingAnimalScript 2is changing the line-based parsing approach to one based on abstract syntax trees. Apart from allowing components such as loops and conditionals, this will ultimately allow us to support method invocations. Currently, the most striking additions are thewhile andforloops and theif conditional with an optional
else part. The additionalloop construct iterates the loop body for a number of repetitions specified as an arithmetic expression. Apart from its use as a “shorthand notation”, theloop
construct is also helpful for beginners in programming. The trinary conditional operator
(booleanExpression) ? expression : expression is not supported. The syntax for the entities follows the syntax used in Java and is shown in Listing 1. intVarDeclin thefor
construct stands for the initialization or declaration of a variable.
while ( b o o l e a n E x p r e s s i o n ) #execute as long as expression is true 2 {
command 4 }
6 f o r ( i n t V a r D e c l ; b o o l e a n E x p r e s s i o n ; a r i t h m e t i c E x p r e s s i o n ) # as in Java {
8 command
}
10
loop ( a r i t h m e t i c E x p r e s s i o n ) # iterate exactly ”expression” times 12 {
command 14 }
16 i f ( b o o l e a n E x p r e s s i o n ) { command
18 }
20 i f ( b o o l e a n E x p r e s s i o n ) { command
22 } e l s e {
24 command
}
Listing 1: Loops and conditional constructs
The body of each loop may also contain sub-blocks, just as in a “real” programming language. As shown in Listing 1, the curly braces can appear either on a new line or at the end of the current line. In contrast to C, C++ and Java, the curly bracesmust appear, even if the command body consists of only one command. Users familiar with a C-like syntax should find it easy to learn and effectively use the notation.
To support the loops appropriately,AnimalScript 2 introduces commands for handling arithmetic, boolean and String-based expressions. Arithmetic expressions currently cover the base operators +, -, *, / and % (modulo). This includes the precedence of multiplication and division over addition and subtraction, as well as parentheses.
notation employed in Java, C and C++. Integer variables can be assigned arbitrary (integer) expressions using the assignment operator, e.g. nrIterations = 5 * i.
Boolean variables are defined as in Java. They can be assigned either one of the two literalstrue / false, another boolean variable or an arithmetic expression with C semantics (0 is false, all other values are true). The boolean operators cover conjunction && and disjunction||, the boolean comparison operators==and !=, and integer comparisons yielding a boolean result (using<, <=,==, >=, >, and ! =).
AnimalScript 2 also offers String variables, declared as string myString = "Hello" and assigned a new value in the usual way. Strings can be concatenated using thePerl/PHP -notation with a point in the middle. Thus, myString . " world" yields the String Hello world. The concatenation works on String, boolean and integer variables and literal Strings. Due to the way String variables are expanded, even the names of variables can be generated dynamically. This is mainly useful in loops that generate individual objects with a unique variable name, for examplea1, a2, a3,. . .. A similar effect can be achieved in some scripting
languages for programming, notable PHP and Perl, with operators such as $$ (Lerdorf and Tatroe, 2002).
4 Example Use of AnimalScript 2
The source code shown in Listing 2 swaps the first element of an array with the minimum array value. It therefore constitutes a part of the Straight Selection sorting algorithm. We assume the presence of a method swap that can swap two elements on a given array.
i n t [ ] v a l u e s = new i n t[ ]{3 , 2 , 4 , 1 , 7}; 2 i n t pos = 1 ;
i n t minIndex = 0 ;
4 while ( pos < v a l u e s . l e n g t h ) {
i f ( v a l u e s [ pos ] < v a l u e s [ minIndex ] )
6 minIndex = pos ;
pos++;
8 }
swap ( v a l u e s , 0 , min ) ;
Listing 2: Java code for swapping the minimal array element with the first array element
The originalAnimalScriptdoes not provide any loop support. Therefore, the structure has to be “flattened”, resulting in something like Listing 3.
%Animal 1 . 4
2 array ” v a l u e s ” ( 1 0 , 1 0 ) length 5 ”3” ”2” ”4” ”1” ”7” arrayMarker ” pos ” on ” v a l u e s ” atIndex 1 l a b e l ” pos ”
4 arrayMarker ” minIndex ” on ” v a l u e s ” atIndex 0 l a b e l ” minIndex ” moveMarker ” minIndex ” to p o s i t i o n 1 within 5 t i c k s
6 moveMarker ” pos ” to p o s i t i o n 2 within 5 t i c k s moveMarker ” pos ” to p o s i t i o n 3 within 5 t i c k s 8 moveMarker ” minIndex ” to p o s i t i o n 3 within 5 t i c k s
moveMarker ” pos ” to p o s i t i o n 4 within 5 t i c k s 10 moveMarker ” pos ” to outside within 5 t i c k s
arraySwap on ” v a l u e s ” p o s i t i o n 0 with 3 within 10 t i c k s Listing 3: Example animation code in the originalAnimalScript
%Animal 2 . 0
2 array ” v a l u e s ” ( 1 0 , 1 0 ) length 5 i n t {3 , 2 , 4 , 1 , 7} i n t pos = 1
4 i n t minIndex = 0
arrayMarker ” pos ” on ” v a l u e s ” atIndex pos l a b e l ” pos ”
6 arrayMarker ” minIndex ” on ” v a l u e s ” atIndex minIndex l a b e l ” minIndex ” while ( pos < 5 ) {
8 i f ( v a l u e s [ pos ] < v a l u e s [ minIndex ] ) { minIndex = pos ;
10 moveMarker ” minIndex ” to p o s i t i o n pos within 5 t i c k s }
12 pos = pos + 1
moveMarker ” pos ” to p o s i t i o n pos within 5 t i c k s 14 }
arraySwap on ” v a l u e s ” p o s i t i o n 0 with minIndex within 10 t i c k s
Listing 4: Example animation code inAnimalScript 2
At first glance, the code shown in Listing 4 is longer than the code in Listing 3 (15 lines versus 11 lines of code). It is easy to see that this depends on the actual array: the number of code lines are fixed for both the Java and theAnimalScript 2 listing. ForAnimalScript, the number of code lines depends on the array length and the ordering of the elements.
There is a strong similarity between the Java code in Listing 2 andAnimalScript 2. The script contains twelve lines of effectiveAnimalScript 2code, if we ignore lines 1, 11 and 14. Six lines of assignments, conditional and loop are identical or almost identical. The mapping from the Java array declaration toAnimalScript 2 is also easy. The main changes concern the commands for installing visible array position markers and moving them in concert with the value assignments. The complete animation code forSelection Sort inAnimalScript 2 is shown in Listing 5. The equivalentAnimalScript notation contains 34 lines of code.
%Animal 2 . 0
2 array ” v a l u e s ” ( 1 0 , 1 0 ) length 5 i n t {3 , 2 , 4 , 1 , 7} i n t pos = 0
4 i n t s p o s = 0 i n t minIndex = 0
6 arrayMarker ” pos ” on ” v a l u e s ” atIndex pos l a b e l ” pos ” arrayMarker ” s p o s ” on ” v a l u e s ” atIndex s p o s l a b e l ” pos ”
8 arrayMarker ” minIndex ” on ” v a l u e s ” atIndex minIndex l a b e l ” minIndex ” while ( pos < 4 ) {
10 minIndex = pos
f o r ( s p o s = pos + 1 ; s p o s < 5 ; s p o s = s p o s + 1 ) { 12 i f ( v a l u e s [ s p o s ] < v a l u e s [ minIndex ] ) {
minIndex = s p o s ;
14 moveMarker ” minIndex ” to p o s i t i o n s p o s within 5 t i c k s }
16 }
arraySwap on ” v a l u e s ” p o s i t i o n pos with minIndex within 10 t i c k s
18 pos = pos + 1
moveMarker ” pos ” to p o s i t i o n pos within 5 t i c k s 20 }
As can be seen, the new features are very helpful for array-based algorithms, such as sorting or searching. They significantly reduce the cognitive effort of coding “programs” into visualizations. Loops and conditional can of course also be used for other programs.
Compared to the original implementation ofAnimalScript, the new implementation can offers significant run-time performance advantages. This is especially true for programs that use the new conditional or loop statements. For example, the implementation of Selection Sort shown in Listing 5 only has to parse 20 lines from the file. The iterative version imple-mented forAnimalScripthas to parse 34 lines of code. Any reduction of file I/O, especially concerning parsing operations, can greatly improve the run-time, even when buffered streams are employed.
Additionally, the look-up mechanism for object position determination inAnimalScript 2 is faster than in the original AnimalScript. In the original version, the animation had to be fast-forwarded to the “current point in time” to accurately determine the bounding box of a given element. Relative placement commands used in defining new objects or within animation effects were therefore very time-consuming to evaluate. In the new version, the look-up is significantly faster thanks to the (hidden) tree structure used for storing and evaluating the animation.
At the moment, we cannot provide conclusive run-time measurements, as the implemen-tation of the array operation visualizations has not been fully implemented. We plan to do a more extensive evaluation once the implementation of the parsing and execution are completed.
5 Summary and Further Work
AnimalScript 2 is a re-implementation of the scripting languageAnimalScript (R¨oßling and Freisleben, 2001). The previous line-based parser is replaced by a parse tree. The main change that is visible to users are the important base operations for simplifying animation creation: loops, conditionals, variables and expressions.
The additions considerably increase the expressiveness ofAnimalScript, pushing it closer to a full-fledged programming language with visualization. This simplifies manual generation, for example of sorting algorithms. We plan to evaluate the effects on (semi-)automatic genera-tion once the implementagenera-tion is finished. As the user is not required to use the new commands, AnimalScript 2 is at least not “more difficult” to learn and use than the original release.
All new components can be parsed and evaluated. Some of the older (and not very well documented) advanced features of the original scripting language are missing and placed on hold for more important content. This includes importing several scripting files into a single animation and internationalization aspects. Additionally, the support for pre-definedlocations
is still under development.
The team is currently working on getting all object generation commands set up. While this task is per se relatively simple, the size of theAnimalsystem with 216 classes and about 45000 lines of code has to be taken into account. Becoming familiar with all components and their interplay is hardly trivial, as can be seen when studying the reference work (R¨oßling, 2002). Currently, all additional features can be parsed, evaluated and executed, apart from the occasional bugs to be expected in any significant software project.
Due to the complete redesign and reimplementation of the parsing process, the new ver-sion of the scripting language is ready for other advanced extenver-sions. This includes method definitions and blocks that define author-specific objects based on a set of primitives. Due to the size of the implementation team and the other demands on their time, not all goals are realistic - this is only a one-year project without payment!
Once the implementation is finished, the new release ofAnimalScript 2will be available online under http://www.animal.ahrgr.de. A set of examples will also be available there, as there was just too little space in this paper for more.
References
Ayonike Akingbade, Thomas Finley, Diana Jackson, Pretesh Patel, and Susan H. Rodger. JAWAA: Easy Web-Based Animation from CS 0 to Advanced CS Courses. In Proceedings of the 34th
ACM SIGCSE Technical Symposium on Computer Science Education (SIGCSE 2003), Reno, Nevada, pages 162–166. ACM Press, New York, 2003.
Rasmus Lerdorf and Kevin Tatroe. Programming PHP. O’Reilly & Associates, Sebastopol, CA, 2002. ISBN 1-56592-610-2.
Thomas Naps, James Eagan, and Laura Norton. JHAV ´E: An Environment to Actively Engage Students in Web-based Algorithm Visualizations. Proceedings of the 31st
ACM SIGCSE Technical Symposium on Computer Science Education (SIGCSE 2000), Austin, Texas, pages 109–113, March 2000.
Guido R¨oßling. Algorithm Animation Repository. Available online at http://www.animal. ahrgr.de/ (seen August 14, 2004), 2001.
Guido R¨oßling. Animal-Farm: An Extensible Framework for Algorithm Visualization. PhD thesis, University of Siegen, Germany, 2002. Available online at http://www.ub. uni-siegen.de/epub/diss/roessling.htm.
Guido R¨oßling and Bernd Freisleben. AnimalScript: An Extensible Scripting Language for Algorithm Animation. Proceedings of the 32nd
ACM SIGCSE Technical Symposium on Computer Science Education (SIGCSE 2001), Charlotte, North Carolina, pages 70–74, February 2001.
Guido R¨oßling and Bernd Freisleben. Animal: A System for Supporting Multiple Roles in Algorithm Animation. Journal of Visual Languages and Computing, 13(2):341–354, 2002.
THORR: A Focus + Context Method for Visualising Large
Software Systems
Eoin McCarthy, Chris Exton SVCR Group
Department of Computer Science and Information Systems, University of Limerick
[email protected], [email protected]
Abstract
Many attempts have been made to construct tools that aid a programmers understand-ing of source code and system structure. Syntactic highlightunderstand-ing and tabbed interfaces can only be useful to a degree; greater steps need to be taken to accelerate programmer com-prehension and in reducing programming and maintenance times. This paper presents a new programming environment for software engineers, THORR. The programming envi-ronment hopes to overcome some of the shortcomings currently associated with similar visualisation projects, in terms of balance between level of detail and context, by using ’Degree-of-Interest’ information visualisation techniques to implement an attention reac-tive user interface. An overview of the prototype tool and its basic functionality is also given.
1 Introduction
Large scale software systems, like production-sized legacy programs can be incredibly difficult to maintain or update. Much of the time expended in performing these tasks is taken up by refreshing a programmer’s knowledge of the system or training a new engineer into under-standing the system(Knight, 2001). Under these circumstances, a programmer’s productivity can decrease as the work can be laborious and tiresome. As a result errors can occur or projects can be late.
Software visualisation was brought about as a means of easing the maintenance section of the software lifecycle. It is believed that by visualising a software system graphically, be it program or algorithm animation, the knowledge decay that programmers experience can be slowed, and the length of time it takes to remember or discover code can be reduced.(Ball and Eick, 1996), (Grundy and Hosking, 2000).
During the design phase of software development, programmers will use diagrams to il-lustrate the software design in the form of UML diagrams, using industrially recognised tools such as Rational Rose, and Select Enterprise. However, it is difficult to find equally prominent tools that aid programmer understanding of an implemented system. One of the reasons for this is maybe that many visualisation systems are tested using small software examples and as a result may not scale well to industrial-sized software systems.
In this paper, we present a new software visualisation tool for software engineers called THORR, in the hope of reducing programmer effort, and shortening maintenance times. We will attempt to overcome the problems of scalability, and navigating large data sets that have prevented other visualisations from being widely accepted.
1.1 Software Visualisation
While it has been described in many different ways for the purpose of this paper software visualisation will be defined as:
“...the use of the crafts of typography, graphic design, animation, and cinematog-raphy with modern human-computer interaction and computer graphics technol-ogy to facilitate both human understanding and effective use of computer soft-ware.”(B Price, 1992).
2 Visualisation Techniques
2.1 Fish-Eye Lens
The Fish-Eye lens distortion technique was original described by Furnas (Furnas, 1986). It was based on a technique best described as ’thresholding’. It was primarily used to visualise hierarchical structures, in which each element was assigned 2 numbers. The first number was based on its relevance and the second number was based on the distance between the information element in question and the element regarded to be the focused node. A threshold value was then selected that was compared with a function of these two values to determine which information would be presented and suppressed.
2.2 Focus + Context
One of the biggest difficulties in visualizing large quantities of information is the lack of screen space in which to visualize it. Users can become disoriented or even ’lost’ in a visualisation where complex navigation is required to obtain information.
Focus + context techniques were introduced as means of displaying huge quantities of information on one screen. A distortion algorithm is used to magnify a certain part of the screen while de-emphasizing the rest. As a result, the user can have a constant overview of the information while focusing in on one particular area.
Card et al(Card and Nation, 2002) use the terminologyfocus + context when referring to visual techniques that provide simultaneous access to both overview and detailed information. According to Card,focus + context is based on the following three premises:
• The user requires both the overall picture and a detailed view.
• There may be different requirements for the information in the detailed view than in the overall picture.
• Both displays may be combined into a single dynamic view.
2.3 Degree-Of-Interest Animation
Developed at XEROX-PARC(Card and Nation, 2002) the DOI (degree-of-interest) tree is an example of an attention reactive interface, used for visualising hierarchical information. The focus + context method, which it utilises, differentiates it from other similar visualisations. While other focus + context visualisations apply distortion algorithms to the screen itself, fisheye views and perspective walls for example, the DOI tree applies transformations and magnifications to the tree to illustrate interest in specific nodes.
3 Support for User Needs
3.1 Scalability
The problem in creating an effective scalable visualisation tool is multi-faceted. Designers have to consider massive amounts of input to the tool; huge amounts of information processing and then must also have efficient algorithms, which display the information in an insightful manner. When these considerations are undertaken, then there is a chance for creating a truly scalable system.
There are many tools that have been implemented to show off one particular animation or visualisation technique, which they deem to be highly important(Robertson et al., 1998), (Sanjaniemi and Kuittinen, 2003) to name but a few. When these tools are evaluated, it is usually done with a sample set of miniature or ’toy’ software systems. There is not enough emphasis placed on whether or not these tools will actually work in industry. They have not considered what will happen if the change the sample size from 200 LOC to 2million LOC, and more often than not unless the metaphor for visualisation has been design with huge programs in mind, it will not scale well.
The presentation of large amounts of information is often spread across an area that spans multiple screens, but THORR will attempt to visualise a meaningful overview of a system in a single display, which will result in a need for novel and complex layout algorithms.
3.2 Interaction
The difficulty in implementation of the interaction mechanism required in a visualisation is directly proportional to the amount of information it is required to visualise. When dealing with small sample sets, very simple interaction techniques will be adequate both in terms of user-interface and navigation of visualisation. It is difficult for a user to get confused when dealing with small amounts of information and as a result even badly designed interaction techniques could be sufficient.
When the amount of information increases to a very large number of information elements, there must be more advanced techniques put in place. Users navigation must be stringently designed and aid the user, by only constraining movement to what is required. When dealing with huge graphs, complete freedom of movement can result in major difficulties. (Cockburn and McKenzie, 2000), (Wood et al., 1995)
THORR will be designed with all of these interaction difficulties in mind. It must allow users to retain overall context at all times. It must also give users the ability to move from high-level information, which has very little detailed information, to lower high-level more comprehensive information with ease. The most successful interaction mechanisms constrain its users in some way, so THORR will be designed to limit the movements that can be carried out by the users. THORR will also implement a 3D interaction technique, which when combined with the other interaction requirements will result in complex implementation but will enhance the users visualisation experience.
3.3 Interoperability
A common interchange format would be useful to allow interoperability between tools. Such as interchange would act as a ’buffer’ or ’interface’ between different tools and it would make it easier to judge the benefits of individual tools. Identical information sources could be used when performing comparisons between tools, resulting in better overall qualitative results. o input or export formats have been described.
The THORR tool will attempt to emulate some of the better design decisions that other visualisation systems have implemented. It will implement an input system, which will accept a common interchange. This results in a tool that will be language independent and also encourage interoperability with tools that accept similar formats. It will be designed to be somewhat extensible and also be implement in a language that is not operating system specific.
3.4 Automation
The amount of automation required in visualisation systems is inversely proportional to the simplicity of the interaction controls used in the system. In other words, the easier it is to traverse large amounts of information in a tool, the harder it should be to design and implement to the navigational controls. THORR will be required to automate some if not all of the more time-consuming visualisation tasks. It should be able to automatically set-up projects, and extract meaningful information from software systems without requiring an overt amount of user input. The visualisation should assist the user’s cognitive processes by implementing a navigational system that will allow the user quick and easy access to all nodes in the graph, and it should be able to automatically decide which nodes to display in detail and which nodes should be filtered. There is, however, a fine line between helping users through the automation of tasks and hindering users by applying excessive constraints, so a balance between the two must be struck.
4 THORR Visualisation
Studies have shown that up to 70% of lifecycle costs are consumed within the maintenance phase, with 50% of these costs relating to comprehension alone (de Lucia and Fasolino, 1996),(Rajlich, 1994). Hence, according to these references, up to 35% of the total lifecy-cle costs can be directly associated with simply understanding the code.
The overall aim of the THORR visualisation then, is to decrease both the time and ef-fort expended by programmers in trying to understand software systems. Visualisation sys-tems have shown results in improving the speed at which users understand, remember, and find information.(Robertson et al., 1998),(Robertson et al., 1991). Focus + context methods have been proven increase the speed of use of visualisation systems by retaining overall con-text(Mitchell and Cockburn, 2003). We hope that by integrating these attributes, users will be able to quickly navigate through large-quantities of information extracted from software systems.
The visualisation itself is a high-level hierarchical visualisation employing degree-of-interest animation. The graph consists of a hierarchical tree of coloured cubes corresponding to various components of the software system, such as classes, superclasses, subclasses and interfaces. Edges between nodes correspond to inheritance parent-child relationships.
Its major advantage over similar tools is the fact that it can visualise thousands of nodes on one screen. It can be navigated without ever having to zoom in or out on a particular section of the tree, thus retaining context at all times. It also circumvents the need for scrolling as all the information is displayed on the one screen.
4.1 Degree-of-Interest Computation
Figure 1: THORR graph in intitial state
When a user selects a node to beinterested in the DOI for each node is then calculated according to the relationship it has with the focused node. All DOI values are between 1 and 0, where 1 is assigned to the focused node and 0 is assigned to the nodes that have little or no relationship with the focused node. To demonstrate this focus + context computation, consider the screen captures of the same graph taken from THORR at two different states in Figures 1 and 2. Figure 1 is a screen capture at the initial layout of the graph and Figure 2 captured the graph afterNodeOfInterest has been selected by the user.
Figure 2: THORR graph in focussed state
When a user chooses a node to become the focused node, as in Figure 2, THORR firstly assigns that node a DOI of 1, then assigns a lesser offset to its children, and parents, then a smaller offset again to their respective children and parents and so on until the least related nodes have offsets of 0. Positions are then calculated, taking into account the changes of size that will occur, and a smooth interpolation between the two states is animated.
4.2 THORR Functionality
Text will always be an integral part of visualizing software, so the option of viewing the source code of individual methods has been included.A searching functionality has been incorporated into the tool to allow for even faster access to components of the visualisation. Searching the visualised information for specific or partial-phrases can yield in multiple results. The ability to capture both screen shots and the state of the graph for later analysis has also been integrated into the THORR visualisation. Simply clicking on the relevant screen capture will restore the graph to that state.
4.3 Node Characteristics
Y-axis. This added ability allows information to be presented not solely on the front of the cube, but on 4 of the 6 sides.
This functionality is exploited by presenting different facets of Java classes. Constructors, operations and attributes were chosen as the relations to be presented on each of the sides. These divisions are similar to those implemented in the ’Javadocs’ documentation tool of the Java API. Scrolling has been implemented to allow text to be presented in a sizeable manner, without reducing the amount of text that can be displayed on each side.
5 THORR Framework and Implementation
The THORR visualisation system focuses primarily on visualizing Java software systems and UML software designs in an efficient and comprehensible way.
5.1 Java
Java was selected as it is an excellent sample language to use in this prototype as it offers many different class relations such as inheritance, associations, inner-classes, super or sub-classes, local classes and packages, many of which are worth visualising. Java consists of a number of APIs, which are intended to be used or extended through inheritance with the aim of aiding productive programming by reducing programmer effort and increasing portability(Taivalsaari, 1996). While this ability to extend source code is useful, often to fully understand a class one must understand its superclasses and the classes it inherits from as well.
5.2 XMI
XMI(OMG, 1999) is the XML Metadata Interchange format standardized by W3C and the OMG. It is this standardisation that allows THORR to import both Java source code and UML diagrams. In the case of this tool, the information from the visualisation can be used in other tools and across platforms allowing for the combined use of many tools in a heterogeneous environment. A public domain tool, JavaRE(Andersson, 2001), analyses Java source and outputs information in the form of XMI documents.
6 Evaluation
An evaluation of Thorr was implemented in order to discern if the proposed methods of visu-alisation provide additional benefit to programmers. A simple tool A versus tool B evaluation was set up, between Thorr and the IDE Eclipse(Eclipse-Foundation, 2004). Eclipse was cho-sen because it is a widely used development environment when developing industrial sized Java software systems. It also has the ability to visualise inheritance hierarchies at a basic level and provides users with advanced search capabilities.
A pilot study was carried out to determine if changes to the evaluation design were re-quired. There were a few small problems with the tool and the phrasing of the tasks that were identified and corrected for the actual evaluation.
The evaluation assigned 2 sets of tasks to 2 different groups. Group 1 carried out the Task Set A in Thorr and Task Set B in Eclipse, whereas Group 2 carried out Task Set B in Thorr and Task Set A in Eclipse. This swapping of task was employed as an attempt to negate dissimilarities in the programming experience between participants, the thinking being that participants that had difficulty performing task in Eclipse should also have some problems performing similar tasks in Thorr.