Faculty of Electrical Engineering,
Mathematics & Computer Science
The recognition of hand gestures
by evaluating micro-vibrations
using a single wrist-worn
highly sampled IMU
Camilla Spaan
Bachelor Thesis
June 2018
Supervisors:
I would like to thank M.I Mohamed Refai and Dr.ir. B.J.F van Beijnum for guiding me through this research and giving me the opportunity to contribute to this research. Furthermore, I would like to thank Dr.ir. L.J Spreeuwers for joinging my bachelor assignment committee. Lastly, I would like to thank everyone who had the patience to guide me through my frustrations with MATLAB.
After an incidence of stroke, the motor activity of the patient can be affected. This is perceivable by the inability to complete simple hand movements. By using wearables, which are suitable for am-bulatory measurements, home revalidation becomes an option. By implementing a highly sampled IMU in a wearable device, it becomes possible to detect specific vibrations corresponding to certain hand movements. As every gesture generates a different movement pattern, it is possible to extract characteristic features of those movements. These can be used to classify the different gestures to be able to identify movements made by the user.
The main focus of this research is toevaluate the feasibility of detecting gestures in Activities in Daily Life (ADL) by evaluating micro-vibrations using a single wrist-worn highly sampled IMU. In order
to determine this feasibility, the research question if the information obtained by a highly sampled IMU is adequate enough to classify different gesturesis answered.
The search to implement the human body as input for electrical devices has been going on for quite awhile. This ranges from using the skin as input and measuring acoustic energies to using vibrations generated by the bones to determine which gesture is made. To be able to use this method in home recovery it is useful to work with a existing product. With the use of wearables (e.g smartwartches) this can be achieved. These devices use an Inertial Measurement Unit to detect movements made by the user. By increasing the sampling frequency of these devices it might be able to detect more detailed movements, such of the fingers of hand to start using it for gesture recognition.
This research uses a motion logger with the ability to detect acceleration at a sampling frequency of 2000Hz. However, it is unknown how detailed the detections will be and if recognition is possi-ble. The data that is extracted of the movements, are analysed using signal processing. First the complete signal is divided into 30 sets, where each set indicate one gesture. By implementing the Fast Fourier Transform and determining the power spectrum, it is possible to extract features to char-acterise the gestures. These features range from the standard deviation and sum to the 5 highest peaks of each set. After these features are extracted machine learning is used to classify the ges-tures. The accuracy must be atleast 80% to satisfy the correct characterisation of gestures, as home revalidation needs a high accuracy while this also takes varieties of human movements into account.
For this research 8 subjects are measured, who are asked to perform 2 sets each consisting of 30 gestures. The gestures are based on the possibility that they can be used in activities in daily life. The motion logger is placed around the right wrist of every participant to ensure it is possible to com-pare the results. The IMU measures the acceleration of a set of gestures for each subject, which are analysed using signal processing techniques like Fast Fourier Transform and power spectrum. To be
able to classify these gestures, features are extracted from the power spectrum to indicate the char-acteristics corresponding to each specific movement. Using the classification learner Support Vector Machines, which applies hyperplanes between the different data points, subject specific models and generic models are generated. The gestures will be implemented individually and grouped based on corresponding movements. These models are created using the feature sets obtained of both the individually and grouped gestures as input. One data set is used to test the model. The results of the tested model are shown in a confusion matrix to indicate the accuracy of correctly classified gestures.
After some setbacks and troubles with the sensor the following results were found. It was discov-ered that for subject specific models individually arranged gestures an average accuracy of 53% was obtained and for grouped gestures 68%. While the generic models generated an accuracy of 35% individually and 62% grouped. The accuracy of the individually based generic model is significantly smaller than the other models as it did not have enough input to create a representative model that takes variations of movements into account. While the accuracy of the subject specific models could be increase if more measurements were conducted per subject.
Acknowledgements ii
Summary iii
List of acronyms vii
1 Introduction 1
1.1 Motivation . . . 1
1.2 Goal of the research . . . 1
1.3 Report organization . . . 2
2 Literature Study 3 3 Theory 5 3.1 2M motion logger . . . 5
3.2 Signal Processing . . . 6
3.3 Classification Application . . . 8
3.3.1 Classifiers . . . 8
3.3.2 Classification Validation . . . 9
4 Method 11 4.1 Experimental Procedure . . . 11
4.2 2M motion logger . . . 13
4.3 Data Analysis . . . 14
4.3.1 Data Preparation . . . 14
4.3.2 Data Analysis . . . 15
4.4 Explanation of Confusion Matrices . . . 17
5 Results 19 5.1 Subject Specific Model . . . 19
5.2 Generic Model . . . 25
6 Discussion 31 6.1 Subject Specific Model . . . 31
6.2 Generic Model . . . 32
6.3 Comparison with ViBand . . . 33
6.4 Limitations . . . 33
6.4.1 Measurements . . . 33
6.4.2 Features . . . 34
7 Conclusions and recommendations 35
7.1 Conclusions . . . 35 7.2 Recommendations . . . 36
References 37
Appendices
A Research Protocol, Information Letter and Informed Consent 39
B Flowchart of MATLAB process 47
C Visuals Conducted Analysis 48
ADL Activities in Daily Life
EMG Electromyography
IMU Inertial Measurement Unit
SNR Signal-to-Noise Ratio
FFT Fast Fourier Transform
SVM Support Vector Machines
TPR True Positive Rates
FNR False Negative Rates
PPR Positive Predictive Rates
FDR False Discovery Rates
Introduction
The introduction gives an inside in the motivation and goals of this research as well as explaining the global overview of the chapters.
1.1 Motivation
After an incidence of stroke, the motor activity of the patient can be affected. This is perceivable by the inability to complete simple hand movements. Home monitoring after discharge is necessary to analyse the recovery process. As wearables are suitable for ambulatory measurements, they have potential applications in a minimal sensing system. By using a highly sampled Inertial Measurement Unit (IMU) it is possible to detect the hand movements of such a patient [1]. As highly sampled IMUs, which work for frequencies above 250 Hz, can detect high frequencies it is able to measure specific vibrations corresponding to certain hand movements.
Currently, wearable devices are not adequate to detect such detailed movements, as they are mainly fabricated for a frequency around 100 Hz [1]. By implementing more suitable components it is an option to start using them in recovery processes, which can be beneficial to give proper revalidation in a home situation.
This study a prelimitary study based on the ViBand paper, which uses accelerometers for bio-acoustic sensing and is conducted with the NeuroCIMT project 7 [2].
1.2 Goal of the research
Every gesture generates a different movement pattern resulting in different frequency spectra of accelerations. Using this knowledge, it is possible to extract features for each gesture, which can be used to identify the movements made by the user. Classification of different gestures is performed by training models using machine learning with the extracted features as input. The goal of this research is toevaluate the feasibility of detecting gestures in Activities in Daily Life (ADL) by evaluating micro-vibrations using a single wrist-worn highly sampled IMU.The research question to answer this goal
is
• Is the information obtained by a highly sampled IMU adequate enough to classify different gestures?
1.3 Report organization
Literature Study
The search to implement the human body as an input for electric devices has been going on for quite some time. The researches in this field vary from using the skin as an input(eg. [3], [4]) to determining internal sounds, electrical activity or vibrations(eg. [5], [6]).
Harrison C. et al. [2010] looked at using the skin as an input. This is done by measuring acoustic energy (e.g. sound waves), which is generated by tapping the skin for example. A sensor was placed on the skin to detect these waves. A cantilever sensor was used, as it was possible to alter the resonant frequency and did not have a flat response curve. This resulted in less irrelevant frequency detection thus a lower Signal-to-Noise Ratio (SNR). The research was conducted for single hand gestures (touching finger e.g. with only the hand that is connected with the sensor), and finger or forearm taps, with the sensor being placed underneath the elbow. Eventually the average accuracy of all these measurements was found to be 87.6%. [3]
Electromyography (EMG) is another important measurement using the skin as input, which reg-isters electrical activity. These can then be implemented for other uses (e.g Muscle-Computer inter-faces). Instead of measuring the movement of the skin, electrical potentials generated by the muscle cells are detected. An advantage of this is that it directly interfaces with the muscle activity. The re-search looked at the activity of the muscles when lifting, tapping, putting pressure on the fingers and moving the hand to two positions. The band was placed on the forearm to be connected to muscles and to decrease discomfort. The accuracy determined for the complete gesture set was 80.5%. [4]
Hambone [5] however uses vibrations generated by the movement of the bones to determine which gesture is made. These are detected using piezoelectric sensors, as these can notice me-chanical vibrations thus able to measure bone vibrations. An essential detail is that the attenuation of bones is lower than of muscles resulting in the necessity to place the sensor as close to the bones as possible without excessive movement of the skin. The optimal areas are thus the wrist and ankle as there are the ulnar and radial styloids (bumps of the wrist) and lateral and medial malleoli (bumps of the ankle) located. The gestures evaluated are focused on these locations, e.g. moving foot up, down or rotating as well as flicking the air or snapping with the fingers. It was found that the overall accuracy of both the ankle and wrist combined was around 95% [5]. Amento [6] focused on the sounds made by the movements of the bones instead of the vibrations. As the bones generate quiet sounds, the skin passes the sounds on to the piezoelectric microphone, which is placed on the skin. Essential is that this sensor does not detect airborne sounds, meaning it is not influenced by the surroundings. For optimal detection the sensor must thus be placed as close to the movement as possible, thus
giving the wrist as the more favourable position to place the sensor. The main gestures documented were tapping, flicking and rubbing with the fingers. However some ADL were also evaluated, such as writing, dialling a phone and grabbing potato chips. This research determined that the accuracy of bioacoustics is more promising than the use of acoustics generated by muscle activity.
The use of EMG and IMU sensors is an option that is often researched in combination with ges-ture recognition(e.g. [7], [8], [9]). The bachelor thesis of Joost Herijgers has looked as well at this application to classify gestures [10]. In this thesis a Myo band was used [11], which is a sensor band, placed around the forearm, containing eight surface EMG channels and one IMU sensor. Four types of measurements were conducted, focused around pointing at and grabbing objects. As this research is in the spirit of optimizing home recovery after a stroke, two type of tests were done to fit the eventual expectations. First a reference test was conducted to indicate a healthy person and then a stroke survivor was mimicked to see if it could be applied in practise. The conclusion obtained in this research is that the accuracies were between 92.2% and 94.3% but that the EMGs had the least contribution to the classification [10]. The next step to study is to see if it is possible to obtain accurate data using an IMU alone and if it is satisfiable to implement it in home revalidation after a stroke.
Theory
This chapter gives an inside in the theory needed to be able to answer the research question. The sensor used in the experiments will be explained. The classifiers which are available for implemen-tation shall be elaborated and the theory behind the used signal processing is explained.
3.1 2M motion logger
[image:12.595.221.405.548.653.2]The data interesting for the research is focused on the movement of the hand and fingers. This can be detected using IMU’s, as was discussed in chapter 2. The IMU used for this research is implemented in the 2M motion logger. It can measure acceleration, angular speed, magnetic field and altitude. This specific device is used as the sampling frequency can be increased from 250 Hz to a maximum of 2000 Hz. When the sampling rate is 2000 Hz, it can detect oscillations up to 1000 Hz, as is explained by the Nyquist theorem. This research is based on the ViBand study, who used a sampling frequency of 4000 Hz, which was able to detect detailed vibrations [1]. With a sampling frequency of 2000 Hz it is unknown how detailed the detections will be and if recognition is a possibility. The gestures made by the participant will be detected using the acceleration data of the IMU. This accelerometer measures in g-units, with a range of±16g. Here g represents the gravitational unit where 1g is equal to9,81m/s2. It can detect accelerations in the x-, y- and z-axis. The device axes of the 2M motion logger can be seen in figure 3.1.
Figure 3.1:Device orientation of a 2M motion logger [19]
3.2 Signal Processing
In order to analyse the data obtained by the motion logger, it is necessary to apply some signal processing. This ensures the possibility to compare characteristics of the data obtained.
Fast Fourier Transform
The Fast Fourier Transform (FFT) decomposes a time domain signal into a frequency spectrum. First the signal, which consists of N points, is decomposed into N signals. A useful rule to apply is that there arelog 2(N)stages necessary to decompose the signal. Then the frequency spectrum is
obtained for each separate point and the signal is combined again to realize a complete frequency spectrum of the whole signal. In figure 3.2 a graphical explanation of the FFT can be seen. It shows how a signal in the time domain can be represented in peaks in the frequency domain.
Figure 3.2:Graphical explanation of the FFT [20]
Window Function
Windowing is used to reduce the discontinuity of the signal near the edges. This is necessary as a FFT can contain discontinuities which influences the spectrum. Using the windowing technique it helps to reduce the influences of these discontinuities, as it flattens the outer ends of the spectrum.
There are many window functions that can be used, depending on the type of signal that needs to be processed. Most common are the Hanning, which is satisfying in most of the cases and Hamming. They are useful as they have an adequate frequency range and have low side lobes [21], which can be seen in figure 3.3.
Statistical Features
To increase the amount of information available for a classifier learner statistical features are ex-tracted of the data. This will make the classifier more adequate as there is more information available per gesture to compare. The statistical features that will be computed are the power spectra, mean, standard deviation, maximum and minimum of the signal, the highest peaks, sum, range, median, the first derivative and the band ratio. The advantage of these extractions is that they are characterstic for each signal, making it possible to apply a classifier to the data. They are chosen as the main features to ensure the results of this research are comparable with the ViBand paper [1].
The power spectra is used to find the density per frequency for that signal. This is calculated using equation 3.1:
SN(ejΩ) = N−1
X
n=−N+1
rN[n]ejΩn (3.1)
TheΩindicates the discrete-time frequency, n ranges from 0..N-1,where N the length of the signal
is and r[k] represents the autocorrelation function of a finite-length sequence x[n], shown in equation 3.2.
r[k] =Ex(n)x(nk). (3.2)
By combining equation 3.1 and 3.2 and using the autocorrelation property ofP∞
k=−∞x[k]∗x[k+n]↔
χN(ejΩ
2
it results in an equation also used by function Periodogram in MATLAB
SN(ejΩ) =
1
N χN(ejΩ
2
(3.3)
The mean determines the average value of the data usingmean=µ=
PN k=1x[k]
N .
The standard deviation indicates how the data is spread compared to the mean. This is calculated using equation 3.4, which is a combination ofσ =pvar(X)andvar(X) =E(X2)−µ2where the
variance knows how far the values are spread out compared to the mean.
SD=σ=
s
P|x−µ|2
N (3.4)
The peaks are found by extracting the n-highest values of the data. This is done by comparing each value to the next, sort them by size and extract the n-first values.
The sum adds all the values of data together to reach the total value, equation 3.5.
sum=Xx[k] (3.5)
The maximum and minimum work with the same method as the peaks, except the maximum only takes the highest value extracted and minimum looks for the lowest value.
The median determines the middle value of the set. This is done by first arranging the values in ascending order, then determine the total amount of values, take the middle one which gives the median. If the amount is even the halfway point between the two middle values will be the median and for an uneven set the middle number is taken as median.
The range on the other hand shows the difference between the highest and lowest value of the set. It can be misleading however as one erratic sample can alter the whole range, which is why the standard deviation is calculated as well.
3.6. As it determines the peaks and troughs it is also possible to extract the value of a certain point in the signal and subtract that of one point above in the signal.
d
dt(St+1) =St+1−St (3.6)
The band ratios are calculated to describe the shape of the total FFT and the power distribution of the signal. As most features look at the edges of the signal the band ratio shows the effects in the regions. This is done by dividing one region by the previous one, equation 3.7, which shows small differences between the two regions. k and j each indicate a region here that is explored.
Bj,k=
Sj
Sk
(3.7)
3.3 Classification Application
The features obtained in the data analysis will be used as input for the classification application in MATLAB. This application is based on the theorems of classifiers and validation, which are elaborated in the subsections below.
3.3.1 Classifiers
In order to be able to classify the data and determine the type of gesture made by the participant, it is necessary to build classification models. This can be done using the classification learner in MATLAB. This application is useful as it automatically trains different models to recognize the data. There are multiple classifiers which can be used. The most optimal one depends on the data that is analysed. All the classifiers will be explained and eventually a final decision will be made on which classifier is most suitable for the analysis.
Decision Trees
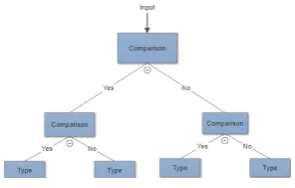
[image:15.595.239.387.584.678.2]The decision trees have the advantage that their prediction speed is fast, while using little memory and is easy to interpret. One disadvantage however is the low accuracy it has when using predic-tion [22]. The decision tree is in essence a boolean classificapredic-tion, as it is typically a true-or-false comparison. The input is compared to a statement in the node and depending on the outcome (yes or no) a decision is what the next node will be. This will continue until it has reached a type and thus a classification of the input. [23] An example of a decision tree can be seen in figure 3.4.
Figure 3.4:Example decision tree
Logistic Regression
probability to select a class. As it is only uses 0 and 1 (false or true) it is possible to have losses in the data. Logistic regression reduces those hard thresholds to decrease the losses and find the optimal value. An advantage of this classifier type is the prediction is fast, memory usage medium and the ablility to predict easy. However the disadvantages overrule, as it is not possible to set any options to control the class nor is it optimal to use when there are more than two classes. [22]
Linear Discriminant Analysis
Linear discriminant analysis resembles the logistic regression classifier. If there are more than two classes, the linear discriminant analysis is preferred. It uses statistical features of the data to make predictions about the generated information. These features are the mean, which gives the average value of the data, and variance, which shows how far the data is spread out around the mean value. To extract these features the linear discriminant analysis classifier must assume that the data is of equal length and that it has a Gaussian distribution. Meaning that the data is shaped like a parabola when plotted. Due to this it comes with a few limitations. The classifier is dependent on the amount of classes the data has, as it can not generate more data groups to show the features than the number of classes available. Thus reducing the amount of data, which can lead to losses and a decreased accuracy. The flexibility of the model is thus low [22] [24].
Support Vector Machines (SVM)
The support vector machine tries to separate the classes by applying hyperplanes between the dif-ferent data points. It is able to do this in multiple dimensions to create the optimal separation. The support vector machine classifier uses four types of parameters to obtain the optimal hyperplane and thus the best accuracy. The kernel ensures the hyperplane can be made in multidimensional planes, regularization determines the amount of misclassification of the data sets, gamma establishes how far the influence of the data points reach on the hyperplane and the margin tries to keep all the data points with their corresponding class. An advantage is that there are many support vector machines available, thus adabtable to the type of data sets. However, they are all hard to interpret and use a significant amount of memory, decreasing the usability [22] [25] [23].
k Nearest Neighbour Classifiers
The k nearest neighbour classifiers use the distance to determine the class a data point belongs too. The classifier takes a certain value k, which determines the amount of neighbours it looks at. The class with the highest amount of neighbours will be assigned to the new data point. To ensure there will be no tie, it is not possible for k to be a multiple of the amount of classes available. A disadvantage is that it results in a classifier that is hard to interpret, uses considerable amount of memory and takes quite some time to solve the classification [22].
3.3.2 Classification Validation
features is that it reduces the chance of overfitting. This happens when there are more data points in the model than can be explained by the data set. By using all the folds the chance of overfitting is exceptionally small. As this type uses the complete data set it is mostly used for smaller sizes of data [26].
Method
In this chapter the experimental method is elaborated and an inside is given in the procedure.
4.1 Experimental Procedure
As this is an research which conducts experiments with the help of human participants, it is necessary to keep the ethical side of the research in mind. This is checked by the Ethical Committee of the University of Twente. The documents can be viewed in appendix A, which consists of the research proposal, the information brochure for the participant and the consent form that the participant must sign to be able to participate in the experiments.
The research is conducted with the help of thirteen healthy participants (10 female, 21.8±1 year of age, 13 right-handed) , who all wore the 2M motion logger on their right wrist in a comfortable manner resembling figure 4.3. All participants will have two sets of data measured, each consisting of 30 gestures.
In this research 10 different gestures are defined and will be measured using the 2M motion logger. The first 3 gestures are similar to the ones in the ViBand paper [1]. The other 7 gestures are based on the possibility that they can be used in ADL. Each gesture begins and ends in the same position, which isarm flat on the table, parallel to the participants seated position. The movements
are always conducted using their right hand except for gesture 5 and 9, which uses the left hand to hold the object. All gestures are shown in figure 4.1 and a written explanation is given after the visuals.
Figure 4.1:Overview of gestures
1. Pinch:The subject will move their right hand upwards and using the right hand the subject will pinch their thumb and index finger together.
2. One finger rub: The subject will move their right hand upwards and using the right hand the subject will rub their thumb along their index finger.
3. Wave down:The subject will move their right hand upwards and will bend the wrist downwards and up to create a downwards faced wave.
4. Make fist:The subject will move their right hand upwards and using the right hand the subject will form a fist of their hand.
5. Cut Play-Doh using a knife: The subject will move their right hand to pick up a knife. The subject will then cut a part of the Play-Doh and place the knife down on the table.
6. Pick up Pen: The subject will move their right hand upwards and using the fingers of the right hand the subject will pick up the pen lift it in the sky.
7. Touch nose and right ear with index finger: The subject will move their hand hand upwards in the direction of their face, point their index finger out and touch their nose. Then the subject will move their index finger to touch their right ear.
8. Grasp Dopper (palmar grasp): The subject will lift their right hand and move it towards the Dopper. The subject will grasp the Dopper, which is placed on the right side of the subject, with the palm of their right hand. The Dopper is lifted straight up, hold up and placed on the surface again.
9. Open Dopper:The subject will lift their left hand and move it towards the Dopper. The subject will grasp the Dopper with the palm of their left hand. Using their right hand, they will open the Dopper, take off the cap and puts it back to close the Dopper. After the Dopper is closed the subject will move their right arm back to the original position to lay flat on the table in front of them. Then they will let go of the Dopper with their left hand.
10. Give thumbs up:The subject will move their right hand upwards and give thumbs up with their right thumb.
• At the start of each measurement the arm with the sensor was position for 5 seconds in the original position.
• Between each gesture made the button was pushed shortly to indicate a gesture was finished. • Every participant followed the same order of gestures, which is the same as listed above.
4.2 2M motion logger
[image:20.595.249.378.594.688.2]The measurements are done using the 2M motion logger, which was explained in section 3.1. The sensor needs to be configured, which is done using a special program, 9DOF Motion Logger. The correct settings will be uploaded before the experiment is started, which are based on the interests of the experiment. The sampling rate is set to 2000 Hz, while the accelerometer is placed on a boundary of ±16g, which limits the sensing in this range. The sample rate of the event marker, gyroscope and magnetometer are not used as it can lead to malfunctions in the sensor and its ability to measure correctly at the high sampling rate. Figure 4.2 shows the overview of the program used to set up the sensor.
Figure 4.2:Overview settings for the sensor set-up.
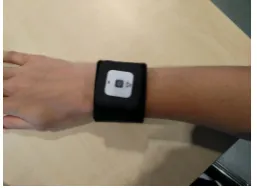
After the sensor is set up, it can placed around the participants wrist. To ensure the measurements can be compared correctly the sensor is always placed around the wrist facing the same direction, which can be seen in figure 4.3. Before the start of an experiment the motion logger is turned on. After each part of the measurement, the sensor is turned off and the data of the measurement is saved, as the sensor overwrites its data when it is turned on again.
4.3 Data Analysis
4.3.1 Data Preparation
After the measurements are conducted each participant has two .csv files, containing the information about the gestures. The files are converted to .mat files to be able to use MATLAB for analysis. An overview of the general flow behind the analysis can be seen in the flowchart included in appendix B. Visuals of the steps leading up to the feature extraction can be seen in appendix C along with troubles in measurements of the sensor.
The data uploaded into MATLAB from the sensor can be seen in figure 4.4. It gives an indication at which instance the button is pressed, the acceleration of the x-, y- and z-axis, sampling frequency, amount of data and the total time of the measurement.
Figure 4.4:Example of data uploaded to MATLAB
Since the button is pushed between every gesture, the index can be extracted from the data using textitbuttonInstances and its corresponding time of the push. After splitting the data in separate axes a high-pass-filter is applied. This removes the DC components of the signal as these interferes with the signals low amplitude wanted to analyse the microvibrations. The Butterworth filter is chosen as the high-pass-filter as this has a flat frequency response in the passband. It is also able to pass the cut-off frequency without an excessive ripple. The order of the filter is important as it indicates the trade off made between the advantages and disadvantages of the filter. A higher order leads to a better response around the cut-off frequency, while it also increases the overshoot. Based on the signal a 4-order filter is determined to be the best trade off. Along with a frequency of 0.3
2000∗2Hz,
were 2000 Hz is the sampling frequency and 0.3 Hz the cut off frequency. The 0.3 Hz is chosen as human movement at standing position is around 10 Hz and small vibrations are thus way below the 10 Hz [27].
After filtering, the excessive spikes during rest and movement of the arm are removed, as these are not part of the gestures, see appendix C. The signal is separated per gesture using the indexes found due to the push of the button. The gestures are shifted in the signal frame for 20 steps as can be interpreted as
Ft,i, Ft−1,i, ..., Ft−w+1,i, where w indicates the steps, i the frequency bin and t the signal frame. The
frequency bins indicate the intervals between the samples. This gives the ability to eventually com-pute an average of the power spectrum not to miss any important detail.
by multiple axes, they need to be combined to get the best representation possible. The maximum makes sure the main influences of each axis are incorporated in the combination especially as this is done over the 20 shifted samples. By taking the average, all 20 shifted power spectra are sum-marized into one signal. From this signal the statistical features are extracted, which were explained in section 3.2. The band ratio is here assumed to look at the ratio between the frequency bins, as all other features extract mostly specific parts of the signal and this will give information about the complete signal. Then the indication which gesture corresponds to which measurement is added to the information and a table is created of all the results as the classifier learner works optimal with a table as input.
Finally for each participant the extracted data is combined together in one table except for the last gesture set obtained. This means that per subject of which 6 times the 10 gestures were extracted, 5 are used to train the model and the remaining gesture set is used to test the model, which is done to test the robustness of the sensor as well. This is called the subject specific model, however the data will also be tested by creating a generic model. This will be based on 4 subjects, all of their data is included, and one subject will be used to test the eventual model for its accuracy. Both of these ways of testing the data will be done as well for creating groups of gestures. The grouping is decided on the resemblance in specific movements and the model will be recreated to determine if the accuracy has increased. To keep the confusion matrices comparable all tests will use the same grouping
4.3.2 Data Analysis
The MATLAB application Classifier Learner is used for the classification of gestures. As explained in section 3.3 there are multiple options available. The table containing the 5x10 gestures is uploaded in the classifier application. This is the moment where the predictors, features, and the response, classes, are chosen. The predictors are the independent varying features that are specific for each type of gesture, where as the response is a fixed value that depends on the predictors, the gesture types. An example of the input can be seen in figure C.7, where rows indicate a different gesture and the columns the features. Cross-validation is chosen as validation technique, which is set to 5 folds as the data set is not quite large. An advantage is that the MATLAB function to convert the extracted test data of the model into a confusion matrix works automatically with 5-folds-cross-validation.
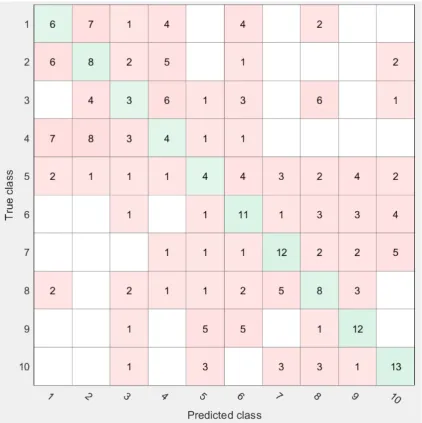
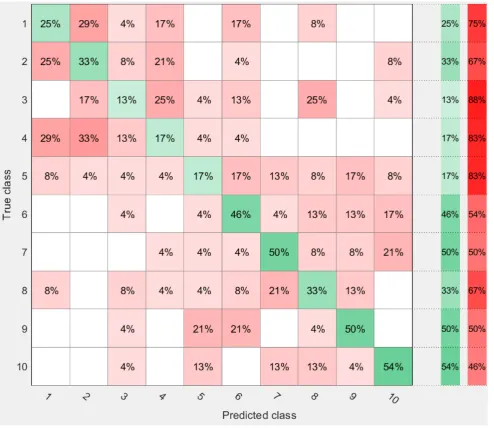
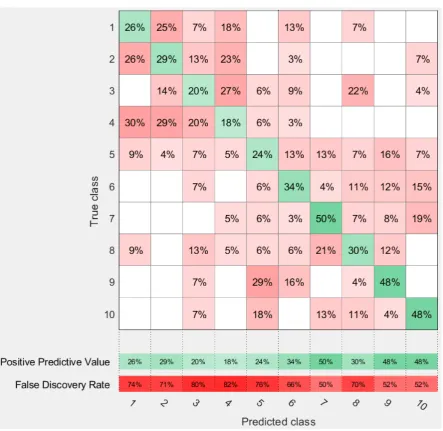
The confusion matrix can be designed using three different data indications, section C shows how these decisions alter the visuals of a confusion matrix. The first possibility is to plot the matrix using the number of observations (figure C.8). Secondly, it can be implemented using True Positive Rates (TPR) and False Negative Rates (FNR). Here the TPR indicates the correctly classified gestures (green percentages) and the FNR the incorrectly classified gestures (red percentages) (figure C.9). Lastly, it is possible to look at Positive Predictive Rates (PPR) and False Discovery Rates (FDR). These indicate the correctly (green percentages) and incorrectly predicted gestures in each class (red percentages). The TPR, FNR, PPR and FDR can be represented by the following equations [28]:
T P R= T P
T P +F N (4.1)
F N R= F N
F N+T P = 1−T P R (4.2)
P P R= T P
T P+F P (4.3)
F DR= F P
F P+T P = 1−P P R (4.4)
, where TP is the true positive, FN the false negative and FP the false positive [28]. The accuracy is determined by the values of the equations above, which results inaccuracy = T P+T N
T P+T N+F P+F N,
where TN indicates the true negative. For this research the TPR and FNR is chosen. It gives a clear overview which gestures are confused by the model due to the fact that they might resemble each other. While the other settings indicate the amount of gestures that is correctly recognized or the accuracy that the gesture is correctly predicted. When the model is created it is exported to MATLAB to predict the accuracy of the model using the unknown data. This is then converted to a confusion matrix using a function, which was shared on Mathwork forum [29].
The accuracy is decided to be adequate if it is above 80%. This will make sure that the model is better than just guessing at dividing the gestures over the different classes. As this method should eventually be implemented in home recovery the accuracy should be high, while it should leave room for the probability that the human movements are too divers to predict it almost perfectly.
Grouping
Table 4.1:Grouping of the gestures based on resembling movements
Gesture Identification Pressure Fingers Pinch(1) One finger rub(2) 1
Touch nose and right ear with index finger(7)
Pick up Wave down(3) Cut Play-Doh using a knife(5) 2
Pick up pen(6) Open Dopper(9)
Pressure palm Make fist(4) Grasp Dopper(palmar grasp)(8) 3 Give thumbs up(10)
4.4 Explanation of Confusion Matrices
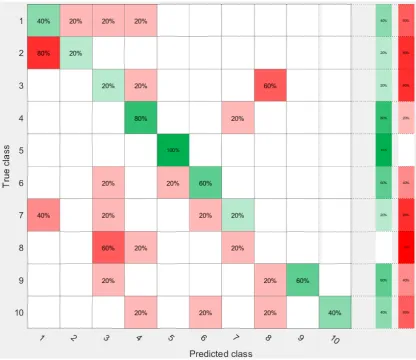
All confusion matrices show the accuracy per gesture in the model. The left matrices show the trained model, where the y-axis indicates the actual (true) class while the x-axis show the predicted class. The right matrices show the accuracy of the model tested using an unknown data set. The y-axis show the predicted (output) class while the x-axis show the actual(target) class.
Figure 4.5 shows an examples of a confusion matrices including coloured lines to explain the use of the confusion matrices clearly. The matrix without the lines is shown in figure 5.1. The diagonal (green) is the most favourable result, the percentages indicated here shows the amount of predicted classes that correspond to their true classes. The matrices(left)using the trained set should be read horizontally, indicating that everything on one row belongs to one true class. The blue line indicates how it would look if all the predicted classes correspond to the true class, it would have an accuracy of 100% as no other predicted class is filled. The red line shows what happens if there are multiple predicted class for one true class. It can be seen that for true class 8, predicted class 3, 4 and 7 were found. The 60% indicate that of all gestures found for true class 8, those were predicted to fit class 3. The rest is divided over class 4, 20%, and 7 , 20%, leaving nothing for class 8 thus remaining empty in the diagonal.
Results
This chapter gives an overview of the results obtained during the analysis of the data. The results are divided over subject specific models and genetic models. This division is to justify if the sensor is accurate enough to determine gestures of the same subject. Another possibility is to see if the sensor is useful to classify gestures when the model is trained with different subjects. In section 5.1 the confusion matrices using the tested set of the subject specific model is described, along with an explanation of the specific classifier learner that is used per subject. Furthermore, the results are discussed of the gestures grouped per type of movement. In section 5.2 the generic model is elabo-rated and the confusion matrices using the tested set of this model are discussed. The model using grouped gestures is also validated with the help of a confusion matrix mentioned in this section. The generic model is created multiple times, where each model is based each time one different subject used as test set. The detailed information per subject, such as time and if it is used in the results, are listed in appendix C. Appendix D shows the confusion matrices obtained using the training set for all subjects.
5.1 Subject Specific Model
In figure 5.1 till 5.5 are the confusion matrices, using the test set, shown from the subject specific models without grouping. Table 5.1 shows per subject the classifier with the highest accuracy and indicate which are used to build the model using the training set.
Table 5.1:Overview highest accuracy with corresponding classifier learner per normal set gestures
Subject Optimal Classifier Model Accuracy
1 Medium Gaussian SVM 44%
2 Medium Gaussian SVM 60%
3 Medium Gaussian SVM 40%
4 Medium Gaussian SVM 46%
5 Medium Gaussian SVM 40%
Figures 5.6 till 5.10 show the confusion matrices using the tested set with grouping the gestures of the subject specific models. Table 5.2 shows per subject the classifier with the highest accuracy after the gestures are categorised and also indicate which are used to build the corresponding models using the training set.
Table 5.2:Overview highest accuracy with corresponding classifier learner per grouped gestures for each subject using the training set.
Subject Normal Classifier Model Accuracy
1 Cubic SVM 66%
2 Cubic SVM 70%
3 Medium Gaussian SVM 68%
4 Quadratic SVM 50%
5 Medium Gaussian SVM 52%
Both the accuracies of grouping and normal confusion matrices of the test set are shown in table 5.3 to give a clear overview per subject and how they change if grouping is applied. It can be found that the average increase is 14% from normal to grouped gestures.
Table 5.3:Comparison of accuracies of normal model and grouped model after using test set
Subject Normal Grouped
1 50.00% 70.00%
2 70.00% 70.00%
3 20.00% 50.00%
4 80.00% 80.00%
5 50.00% 70.00%
Confusion Matrix Overview Subject Specific Models
Regular gestures
Figure 5.1:Confusion matrix of trained model and after testing for subject 1
Figure 5.2:Confusion matrix of tested set subject 2
Figure 5.2 shows the confusion matrices of subject 2. It shows an accuracy of 70% after the test set is applied to the model.
Figure 5.3:Confusion matrix of tested set for subject 3
Figure 5.4:Confusion matrix of tested set for subject 4
Figure 5.4 shows the confusion matrices of subject 4. It shows an accuracy of 80% after the test set is applied to the model.
Figure 5.5:Confusion matrix of tested set for subject 5
Grouped Gestures
Figure 5.6:Confusion matrix of grouped gestures of tested set for subject 1
Figure 5.6 shows the confusion matrices of subject 1. It shows an accuracy of 70% after the test set is applied to the model.
Figure 5.7:Confusion matrix of grouped gestures of tested set for subject 2
Figure 5.8:Confusion matrix of grouped gestures of tested set for subject 3
Figure 5.8 shows the confusion matrices of subject 3. It shows an accuracy of 50% after the test set is applied to the model.
Figure 5.9:Confusion matrix of grouped gestures of tested set for subject 4
Figure 5.10:Confusion matrix of grouped gestures of tested set for subject 5
Figure 5.10 shows the confusion matrices of subject 5. It shows an accuracy of 70% after the test set is applied to the model.
5.2 Generic Model
The generic model created in figure 5.11 till 5.15 are created using the normal gestures. Figures 5.16 till 5.20 used the categorisation of gestures to create the confusion matrices. Both the models are based on the medium Gaussian SVM.
Table 5.4 shows the accuracies of each model for different subjects used as test set. This is done for both the normal model and the grouped model. It used 4 subjects to train the model and 1 subject to test the model.It can be found that the average increase is 24.67% from normal to grouped gestures.
Table 5.4:Overview accuracies of model using tested set for each test subject, normal and grouped gestured
Test Subject Normal Grouped
1 28.33% 61.67%
2 28.33% 60.00%
3 28.33% 51.67%
4 30.00% 38.33%
Regular gestures
Figure 5.11:Confusion matrix of generic model using testing set subject 1
Figure 5.11 shows that the overall accuracy after testing using subject 1 as test set is 28.33%.
Figure 5.12:Confusion matrix of generic model using testing set subject 2
Figure 5.13:Confusion matrix of generic model using testing set subject 3
Figure 5.13 shows that the overall accuracy after testing using subject 3 as test set is 28.33%.
Figure 5.14:Confusion matrix of generic model using testing set subject 4
Figure 5.15:Confusion matrix of generic model using testing set subject 5
Figure 5.15 shows that the overall accuracy after testing using subject 5 as test set is 35%.
Grouped Gestures
Figure 5.16:Confusion matrix of grouped gestures with generic model using subject 1 as test set
Figure 5.17:Confusion matrix of grouped gestures with generic model using subject 2 as test set
Figure 5.17 shows that the accuracy after using subject 2 as test set with grouped gestures is 60.00%.
Figure 5.18:Confusion matrix of grouped gestures with generic model using subject 3 as test set
Figure 5.19:Confusion matrix of grouped gestures with generic model using subject 4 as test set
Figure 5.19 shows that the accuracy after using subject 4 as test set with grouped gestures is 38.33%.
Figure 5.20:Confusion matrix of grouped gestures with generic model using subject 5 as test set
Discussion
The results of the measurements will be discussed along with the experiments conducted on the participants. Section 6.1 discusses confusion matrices of the subject specific normal models and grouped models. Section 6.2 will discuss the confusion matrices of the generic model and grouped generic model. Both will elaborate what can be extracted from these results. These sections follow this order as the measurements are conducted in this manner. Section 6.3 links the results back to the ViBand paper, which was the underlying basis of this research. Section 6.4 will go more in depth about the limitations experienced in this research, with a focus on the motion logger, features and classifier learner.
6.1 Subject Specific Model
To be able to state something about the accuracy of the classifier model and algorithms, the accu-racy found using all gestures is compared with the model based on the grouped gestures (table 5.3). The used classifiers are determined by their highest accuracies, which can be seen in table 5.1 for the normal subject specific models and table 5.2 for the grouped gestures subject specific models . The other classifiers that did not return the highest accuracy were not tried for the tested set. It was found that the decision trees could not generate a search that was detailed enough to obtain a useful accuarcy when implementing the test set.
For the normal model it can be seen that a high accuracy in the model using the trained set does not automatically result in a high accuracy of the same gesture in the model when using the test set. For example, in figure 5.4 it can be seen that gesture 8 had an accuracy of 80%, while using the tested data did not recognize gestures 8. This indicates that there is a limitation in the model that is created or participants are not always as consistent in their movements as the model with the trained set lets to believe. The model with the test set also shows that the excessive gestures are often con-fused with others as they combine multiple types, while also the more minimalistic movements are mixed up between each other. This can indicate that participants use the same type of movements to make different gestures.
This let to the grouping of gestures to verify if the accuracy would increase if the matching ges-tures are combined. It can concluded of table 5.3 that the grouped model has an increased accuracy for all models of the regular division, except the models where the accuracy was already above 70%. As the categorization of gestures is meant to combine gestures that resemble a lot, for low accura-cies in the normal model this will help to give a more general overview of the gestures. It will be less
likely that the model will make a mistake in the recognition of a gesture thus increasing the accuracy of the model. For models with an already high accuracy, the model did not have any trouble catego-rizing the gestures in the first place and the way the gestures were categorised did not alter these characteristics per gesture It can be seen that group 1 and 3 are more often confused than any of them with group 2. This is for both the models with the trained set and the models with the test set. It indicates indeed that those two groups use the same type of movements but on a different scale, as group 1 is focused on the finger tips and group 3 on palm of the hand. Group 2 is more focused on picking up tools, which is a completely different category. Subject 3 however is not taken into account in this observation, as it behaves differently when comparing to the other subjects. Figure 5.8 shows that all gestures are almost equally miscategorized, stating that subject 3 has almost no variety in their movements in their gestures. This might be due to very soft pressure or slow movements that it might not be detected as excessive as other participants.
One question that arises is where does this difference in accuracy come from. When looking at table C.1 it shows that time does not influence the accuracy of the models. Subject 4 had a measurement time of 7:09:7 minutes and an accuracy of 80%, while subject 5 had a total time of 7:04:6 and an accuracy of 50%. This might indicate that the accuracy depends on how much strength and speed a gesture is conducted with, as this highlights the characteristics of the gesture.
6.2 Generic Model
The generic model is built using 5 subject sets, resulting in 240 gestures total and one testing set using 60 gestures in total of the leftover subject. To verify the influence per subject, this generic model is conducted five times to let each subject once be the test set. When looking at table 5.4 it can be seen that the accuracies of the normal generic model are low compared to table 5.3. It needs to be kept in mind that the amount of subjects used for the generic model is not high enough to generate an average model that takes the variability of moving into account. Hence it makes it increasingly difficult to correctly classify the right gesture, when only 5 different subjects are used for training. One gesture that is worth mentioning in this context is gesture 6, which represents pick-ing up a pen. This movement is highly personal and everyone does this in their own way, which can be seen the accuracy of the tested model. If the tested subject does it completely different than any of the other 5 subjects it will not be correctly categorized, which can be seen in figure 5.11 till 5.15
To determine if the accuracy of the generic model can be increased a grouped gesture generic model is generated. There was an increase of 24.67% in accuracy when using the grouped gestures. It can be seen in the models using the test set, that group 3 is continuously difficult to determine, while group 2 is fairly accurate. When comparing the accuracies per subject in the subject specific models, it can be seen that they influence the accuracy in the generic models. For example subject 4 had an accuracy of 80.00% in the grouped subject specific model, which was the highest accuracy found in this type. While in the grouped generic model, it had an accuracy of 38.33%, which is significantly lower than the other tests.
but more than halve of the gestures can be recognized.
6.3 Comparison with ViBand
As was stated in chapter 1, this research arose after reading the ViBand paper [1]. There are a few differences between gesture recognition done by ViBand and this research. First of all, the sam-pling rate of the sensor was 4000Hz instead of 2000Hz. Second is the amount of measurements taken per subject and the type of gestures. In ViBand 17 gestures were used in three categories two-handed gestures, one-handed gestures and on-body touch input, while this research used 10 gestures and focused mostly on pressure and picking up. Thirdly, the features that were used for the input of the classifier and the type of classifier were dissimilar. A SMO-based SVM was used instead of the SVM’s in this research, as the SMO-based is not available in the classification application of MATLAB. ViBand also included the first derivative and band ratios to classify the gestures, which are not included in this research section 6.4.2. The most important difference was that ViBand had an average accuracy of 94.3%, while the average accuracy of the subject specific model was 54% normal and 68% grouped. One of the reasons for the difference in accuracy can be the various in sample frequency, as it can increase the ability to detect micro-vibrations. However, the high accura-cies of Viband can also be influenced by the first derivative and band ratios, as these features give an increased detailed indication of the gestures than the other features. The number of participants does not contribute to the accuracy as they also used subject specific models for each of them. The fact that this study also looked at a generic model is not taking into account when comparing the ViBand paper and this research.
6.4 Limitations
6.4.1 Measurements
highest peaks. However not all peaks could be removed as essential details of gestures would be erased as well. It is unsure how much these peaks influenced the analysis, but expected is that it did play a role in the recognition.
6.4.2 Features
Conclusions and recommendations
The conclusion based on the goal of this research, is stated here. Along with recommendations for improvement for the study and future research.
7.1 Conclusions
The goal of this research was to evaluate the feasibility of detecting gesture in ADL by evaluating micro-vibrations using a single wrist-worn highly sampled IMU. To determine if this goal is reached the following question will be answered:
• Is the information obtained by a highly sampled IMU adequate enough to classify different gestures?
When looking at the subject specific models it can be stated that for normal classification of the ges-tures the information obtained when wearing a highly sampled IMU is not adequate enough as it resulted in an average accuracy of 54% over all subjects. The grouped classification of the gestures did not go beyond an average accuracy of 68%. Hence, the subject specific models did not satisfy the stated question.
The generic model of this research performed worse than the subject specific models, with an accuracy of 30.00% for the normal model and 54.67% for the grouped model. This is due to the fact that there was not enough data input for the generic model to take the variations into account when testing the model. Based on these findings it can be stated that the generic model is not able to fulfil the question if the information obtained by the highly sampled IMU was adequate enough to classify the different gestures.
As both of the models answered negative to the question it can be concluded that the goal of this research to determine if it is feasible to use micro-vibrations to detect gestures is not met. It is possible to some extent to measure the gestures, but the results are too limited to state that for now this goal is feasible.
This research was a preliminary study focused to see if it would be achievable to eventually use highly sampled IMU’s in home revalidation. As discussed throughout the research it can be con-cluded that gesture recognition is useful, but it is not optimal enough yet to be used in a revalidating environment. The averages accuracies all lay below the 80.00%, which is not useful if it is tried to measure a patient, who is undergoing revalidation. Their movements may vary in strength, speed or
persistence. This makes a system with an already inadequate accuracy using healthy participants, not implementable for home revalidation. With the use of the current setting it is likely that it will not be able to detect all gestures, making correct recognitions difficult. While this is essential when working in home revalidation. Hence, to be able to use it for this purpose, it will need to undergo developments.
7.2 Recommendations
To meet the goal of this research some improvements can be done. Most importantly is the use of a correct working sensor, that will not influence the data. Increasing the accuracy is also an aspect that can be improved by measuring more participants and an increased number of measurements per subject. This can increase the accuracy of both the subject specific model and the generic model. One last possibility is to use a computer with a higher computational power to be able to include features such as first derivative and band ratios.
[1] C. H. Gierad Laput, Robert Xiao, “Viband: High-fidelity bio-acoustic sensing using commodity smartwatch accelerometers,” UIST ’16 Proceedings of the 29th Annual Symposium on User Interface Software and Technology, pp. 321–333.
[2] “Neurocimt project 7: Ambulatory sensing.” [Online]. Available: http://neurocontrol.nl/ neurocimt-project-7-ambulatory-sensing/
[3] D. M. Chris Harrison, Desney Tan, “Skinput: Appropriating the body as an input surface,” CHI ’10 Proceedings of the SIGCHI Conference on Human Factors in Computing Systems, pp. 453–462. [4] T. S. Saponas, D. S. Tan, D. Morris, and R. Balakrishnan, “Demonstrating the feasibility of using forearm electromyography for muscle-computer interfaces,” CHI ’08 Proceedings of the SIGCHI Conference on Human Factors in Computing Systems, pp. 515–524.
[5] E. S. P. T. Deyle, S. Palinko and T. Starner, “Hambone: A bio-acoustic gesture interface,” 2007 11th IEEE International Symposium on Wearable Computers, pp. 3–10.
[6] B. Amento, W. Hill, and L. Terveen, “The sound of one hand: A wrist-mounted bio-acoustic fingertip gesture interface,” CHI EA ’02 Extended Abstracts on Human Factors in Computing Systems, pp. 724–725.
[7] S. Jiang, B. Lv, W. Guo, C. Zhang, H. Wang, X. Sheng, and P. Shull, “Feasibility of wrist-worn, real-time hand and surface gesture recognition via semg and imu sensing,” IEEE Transactions on Industrial Informatics.
[8] ——, “Development of a real-time hand gesture recognition wristband based on semg and imu sensing,” 2016 IEEE International Conference on Robotics and Biomimetics (ROBIO), pp. 1256– 1261.
[9] S. O. Shin, D. Kim, and Y. H. Seo, “Controlling mobile robot using imu and emg sensor-based gesture recognition,” 2014 Ninth International Conference on Broadband and Wireless Comput-ing, Communication and Applications, pp. 554–557.
[10] J. Herijgers, “The classification of pointing and grabbing gestures by evaluating a combination of semg and imu data.”
[11] “Myo wristband.” [Online]. Available: https://www.myo.com/
[12] Y. Ma, Y. Liu, R. Jin, X. Yuan, R. Sekha, S. Wilson, and R. Vaidyanathan, “Hand gesture recog-nition with convolutional neural networks for the multimodal uav control,” 2017 Workshop on Research, Education and Development of Unmanned Aerial Systems (RED-UAS), pp. 198–203.
[13] Y. Choi, I. Hwang, and S. Oh, “Wearable gesture control of agile micro quadrotors,” 2017 IEEE International Conference on Multisensor Fusion and Integration for Intelligent Systems (MFI), pp. 266–271, 2017.
[14] M. S. Kang, H. W. Kang, C. Lee, and K. Moon, “The gesture recognition technology based on imu sensor for personal active spinning,” 2018 20th International Conference on Advanced Communication Technology (ICACT), pp. 546–552, 2018.
[15] P. M. Chao Xu, Parth H. Pathak, “Finger-writing with smartwatch: A case for finger and hand ges-ture recognition using smartwatch,” HotMobile ’15 Proceedings of the 16th International Work-shop on Mobile Computing Systems and Applications, pp. Pages 9–14.
[16] M. M. Luna, T. P. Carvalho, F. A. A. M. N. Soares, H. A. D. Nascimento, and R. M. Costa, “Wrist player: A smartwatch gesture controller for smart tvs,” 2017 IEEE 41st Annual Computer Software and Applications Conference (COMPSAC), pp. 336–341, 2017.
[17] S. Agarwal and S. Ghosh, “Evaluation of microgesture recognition using a smartwatch,” 2017 16th IEEE International Conference on Machine Learning and Applications (ICMLA), pp. 986– 991, 2017.
[18] J. Wang, L. Qian, Y. Xie, and Q. Long, “Subtle finger motion recognition based on the cots smart-watch,” 2017 14th International Computer Conference on Wavelet Active Media Technology and Information Processing (ICCWAMTIP), pp. 134–139, 2017.
[19] “A8200 9dof motion logger: Instruction manual.”
[20] “Graphical overview of the fast fourier transform.” [Online]. Available: https://en.wikipedia.org/ wiki/Fast Fourier transform#/media/File:FFT-Time-Frequency-View.png
[21] “Understanding ffts and windowing.” [Online]. Available: http://download.ni.com/evaluation/pxi/ Understanding%20FFTs%20and%20Windowing.pdf
[22] “Choose classifier options.” [Online]. Available: https://nl.mathworks.com/help/stats/ choose-a-classifier.html#bu62uj8
[23] S. J. Russell and P. Norvig,Artificial Intelligence: A modern approach Third edition. Pearson
Education, 2010.
[24] “Linear discriminant analysis for machine learning.” [Online]. Available: https: //machinelearningmastery.com/linear-discriminant-analysis-for-machine-learning
[25] “Chapter 2 : Svm (support vector machine)ŁŁtheory.” [Online]. Available: https://medium.com/ machine-learning-101/chapter-2-svm-support-vector-machine-theory-f0812effc72
[26] “Select data and validation for classification problem.” [Online]. Available: https://nl.mathworks. com/help/stats/select-data-and-validation-for-classification-problem.html#bunsu7g-1
[27] “Resonant frequencies of standing humans.” [Online]. Available: https://www.ncbi.nlm.nih.gov/ pubmed/9306739
[28] “Precision and recall.” [Online]. Available: https://en.wikipedia.org/wiki/Precision and recall [29] “Plot confuction matrix.” [Online]. Available: https://nl.mathworks.com/matlabcentral/
Research Protocol, Information
Letter and Informed Consent
Flowchart of MATLAB process
Visuals Conducted Analysis
The errors in the measurements, background information of the measurements per subject, visuals of the data preparation are elaborated in the next sections.
Errors in Measurements
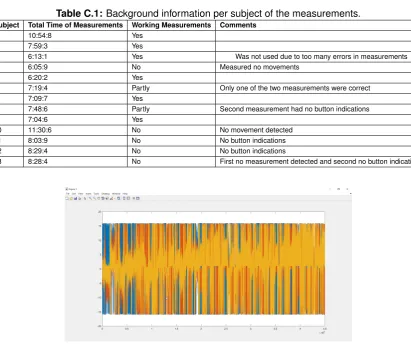
While conducting the measurements the sensor ran into a few problems. The graphs shown below give a clear overview of the issues ran into during this research. Figure C.1 shows the difficulty that the sensor did not always recognized movements made by the participant. The x- and y-axis were recognized as a value around 0g and the z-axis around 0.9g. However the sensor could also fluctuate between±16 as this was the range programmed for the accelerometer. It would detect movements around the±15g, figure C.2. Why the sensor behaved like this, has not been determined. If the movements were measured correctly it was not always a guaranty that the data could be extracted. As can be seen in figure C.3 it sometimes gave as output that the buttonInstances were empty. This indicates that the button was not activated with a sampling rate, while it was pre-set on a sample rate of 16 Hz as can be seen in figure 4.4. Especially, since it did not happen after a certain moment in the experimental phase but random throughout all of the participants. This can also be seen in table C.1, which shows if the data was used per subject and an explanation if not.
Figure C.1:Sensor without registering movement
Table C.1:Background information per subject of the measurements.
Subject Total Time of Measurements Working Measurements Comments
1 10:54:8 Yes 2 7:59:3 Yes
3 6:13:1 Yes Was not used due to too many errors in measurements 4 6:05:9 No Measured no movements
5 6:20:2 Yes
6 7:19:4 Partly Only one of the two measurements were correct 7 7:09:7 Yes
8 7:48:6 Partly Second measurement had no button indications 9 7:04:6 Yes
10 11:30:6 No No movement detected 11 8:03:9 No No button indications 12 8:29:4 No No button indications
[image:56.595.104.516.87.432.2]13 8:28:4 No First no measurement detected and second no button indications
Figure C.2:Fluctuations between the minimum and maximum accelerometer scale
Figure C.3:No recognition of the button of the sensor
Visuals Data Preparation
Figure C.4:Acceleration data combined and seperate for x-, y- and z-axis with marked peaks.
[image:57.595.143.556.449.678.2]Figure C.4 shows the plot of the total signal in time domain, which includes the x-, y- and z-axis in one graph. The other three graphs indicate where the peaks of the x-, y- and z-axis are located. It is not known where those excessive peaks come from and removing them resulted in less data destruction.
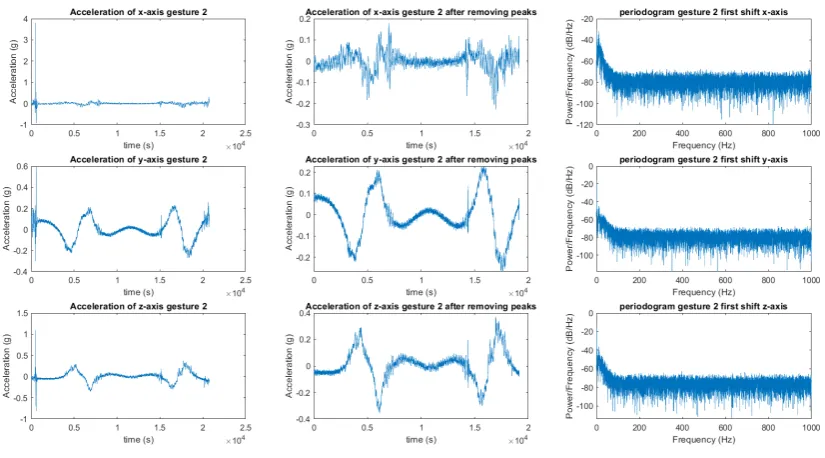
Figure C.5:Overview extracted data x-, y- and axis for gesture 2
the some influence of the button pressed by the participants the first 0.4
f s seconds is removed at the
[image:58.595.139.556.163.391.2]beginning and end of each signal. The second column shows the new signal of the second gesture after the influence of the button is removed. After this the signal is also shifted over the 20 steps explained in section 4.
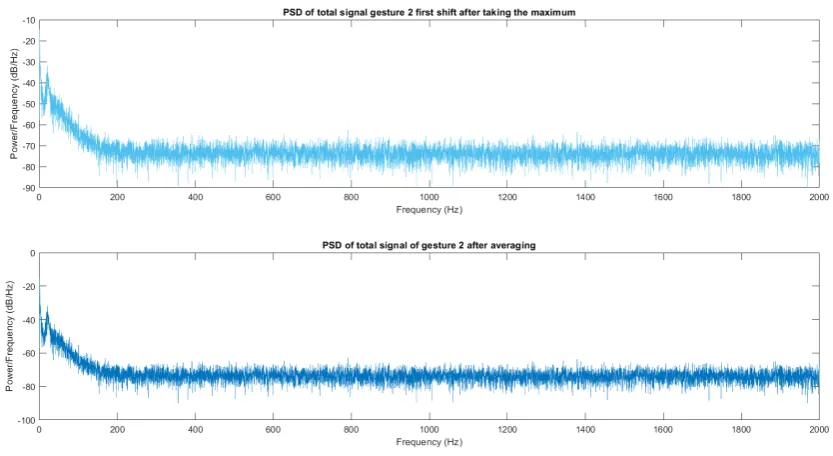
Figure C.6:Signal of gesture 2 after applying maximization and averaging
Finally, the PSD of the second gesture first shift is shown in the third column, which is calculated using the Periodogram function of MATLAB. This includes the FFT, Hamming window and PSD cal-culation. This is all done for all the thirty gestures made by the participant and the maximum is taken for the each shift and each x-, y- and z-axis combination. After this maximum is found the average over each shift is determined. This is all shown in figure C.6.
The features extracted of the power spectrum are combined into a table, where each row indicates a new gesture. These tables are used as input for the classifier learners. A example is shown in figure C.7.
Figure C.7:Example set features of gestures.
Examples Confusion matrices
Figure C.8:Example confusion matrix using number of observations
Figure C.9:Confusion matrix using True Positive Rates and False Negative Rates
Figure C.10:Example of confusion matrix using Positive Predictive Values and False Discovery Rates
Results of the measurements
This appendix shows the confusion matrices obtained in the measurements. It is divided in subject specific models in section D and generic model section D.
Confusion Matrix Overview Subject Specific Models
[image:62.595.93.510.374.734.2]Regular gestures
Figure D.1:Confusion matrix of model using trained set for subject 1
Grouped Gestures
Figure D.7:Confusion matrix of grouped gestures model using trained set for subject 2
[image:68.595.94.507.416.687.2]Figure D.9:Confusion matrix of grouped gestures model using trained set for subject 4
[image:69.595.94.539.419.705.2]Generic Model
[image:70.595.97.552.147.545.2]Regular Gestures
Grouped Gestures
![Figure 3.1: Device orientation of a 2M motion logger [19]](https://thumb-us.123doks.com/thumbv2/123dok_us/9710007.472057/12.595.221.405.548.653/figure-device-orientation-of-m-motion-logger.webp)