William G. Bradley1 Bradley J. Glenn
Received January 13, 1987; accepted after re-vision May 20, 1987.
Presented at the annual meeting of the Western Neuroradiology Society, Palm Springs, October 1986.
1 Both authors: MR Imaging Laboratory, Hun-tington Medical Research Institutes and Depart-ment of Radiology, Huntington Memorial Hospital, Pasadena, CA 91105. Address reprint requests to W. G. Bradley, MR Imaging Laboratory, Huntington Medical Research Institutes, 10 Pico St., Pasadena, CA 91105-3201.
AJNR 8:1057-1062, November/December 1987
0195-6108/87/0806-1057
© American Society of Neuroradiology
The Effect of
Variation in Slice
Thickness and Interslice
Gap on
MR Lesion
Detection
1057
Lesion detection by MR imaging depends on the contrast-to-noise ratio of the voxels containing the lesion relative to those containing the background. When the lesion voxels are less than completely filled, the inherent contrast between lesion and back -ground is modified by the filling factor. Lesion detection thus depends on lesion size, slice thickness, lesion position relative to slice, thickness of gap between slices, and inherent contrast between lesion and background.
Using computer simulation, the effect of variation in the slice thickness and the interslice gap on lesion detection is modeled as a function of lesion size, filling factor, and inherent contrast. Detection of small, low-contrast lesions is shown to be most sensitive to partial volume effects and to be greatest with thin slices. Detection of high-contrast lesions is shown to be limited primarily by the presence of a gap between slices_ For patients with diffusely distributed disease-e.g., the small, low-contrast lesions of multiple sclerosis-lesion detection is greater for thin slices, even with a gap, than for thick, contiguous slices.
Lesion detection by MR imaging is primarily dependent on the contrast-to-noise ratio (GjN) of the lesion relative to the background [1, 2]. The intensity of each
pixel in the lesion or the background represents the total signal returned from a
given volume element or voxel. Thus, if a lesion fills an entire voxel, the contrast
between lesion and background pixels is dependent solely on the inherent contrast
of the lesion. If the lesion occupies less than 100% of the voxel, the lesion contrast is then dependent on both the inherent contrast of the lesion and the percentage
of the voxel that is filled by the lesion, the so-called "filling factor." As the inherent contrast and filling factor decrease, the intensity of the voxel tends toward the intensity of the background, limiting lesion detection. These "partial volume effects" may be minimized by decreasing the slice thickness [3]. This maneuver will generally prolong the imaging time if contiguous slices are still obtained over the same imaging volume (all other factors remaining constant) [4]. To avoid a longer scan
time, the slice thickness may be decreased while maintaining a constant slice-to -slice interval (the distance between the beginning of each slice), thus increasing the gap between slices. By decreasing slice thickness in this manner, partial volume effects are minimized, but at the expense of increasing the probability that a lesion will be located in the gap. This computational study was undertaken to evaluate how these two effects interact to affect the detection rate of lesions of different size and inherent contrast.
Theory
Pixel contrast (PC') is defined as the product of the inherent contrast (IC) and the filling
factor (FF'), the percentage of the slice filled by the lesion:
PC' = FF' x IC (1 )
for detection. The actual value of PC is unknown and depends on the signal-to-noise ratio (SIN) and on subjective interpretation, both
of which will be assumed constant for this analysis. (While the
signal-to-noise ratio will normally decrease for thinner slices with smaller
voxels, this may not be perceptible at higher values of SIN-e.g, at higher fields-or it can be countered by increasing the number of
excitations or by increasing the echo sampling time, which decreases
the bandwidth, thereby partially offsetting the signal-to-noise
de-crease.) If PC is substituted for PC' and equation 1 solved for FF', it can be seen that for any given IC there is a minimum FF' required
for detection, which we will denote as the filling-factor threshold for detection (FF):
FF = PC/IC (2)
Thus, lesion contrast can be expressed in terms of the minimum fraction of the voxel that needs to be filled for detection (FF). This is
a very useful concept in our model, and we will use this convention to quantify lesion contrast. For example, an FF 40% lesion is one
with inherent contrast such that at least 40% of a voxel must be filled
before the lesion can be detected.
Using the above parameters and assumptions, a simple model was created. Considering all possible positions in or out of the imaging
plane, the lesion is modeled as a line along the long axis of the voxel,
perpendicular to the imaging plane (Fig. 1). The length of the line is
equal to the diameter of the lesion. To determine the probability of detection, the lesion is moved (by the computer) through the interval INT from the beginning of one slice to the beginning of the next. This
corresponds to moving from point X to point Y in Figure 1 and represents all possible positions of the lesion within the interval INT of slice thickness plus gap. As the lesion moves through this interval,
detection occurs whenever the overlap between the lesion and the
slice is greater than the size threshold for detection FF x ST (where ST is the slice thickness). The total distance over which detection
occurs, divided by the distance over which detection was possible (the intervaIINT), is the probability of detection (P).
There are three possible situations for lesion detection. Either: 1. The lesion will not be detected at any point along the interval
(P, = 0); or
2. The lesion will be detected at all points along the interval (P2 =
1); or
3. The lesion will be detected only at certain points along the
interval (0 < P3 < 1).
The first Situation, P, = 0, occurs when the lesion is unable to fill
enough of the voxel for detection even at maximum overlap. In other words, there is no detection when the lesion size LS is smaller than
the required size threshold for detection; that is:
if LS < FF x ST, P, = 0 (3)
The other extreme, P2 = 1, occurs when a lesion always fills more
than the size threshold at every point along the interval INT. The
point of minimum overlap between the lesion and the slice occurs when the center of the lesion is equidistant from the center of each
slice. Thus, if the lesion is still detected in this position of minimum
overlap, it will a/ways be detected (P2 = 1). This occurs when the
lesion spans the gap (INT -ST) and overlaps each slice by an amount greater than or equal to the size threshold FF x ST; that is:
if LS > (INT -ST) + 2(FF x ST), P2 = 1.0 (4)
For lesions in between these two extremes, detection will occur only at positions where the overlap between the lesion and the slice is greater than or equal to the size threshold (FF x ST). As the lesion
begins moving into the interval from point X to point Y in Figure 1, the overlap with slice A begins to decrease. The lesion will continue to be detected as long as the overlap with slice A is greater than or
x
I
Slice A
ISlice B
IFFxST
I
Lesion
•
I
Slice A
I
Slice B
IFFxST
.
1
Lesion
•
;...:
: I :
LS - (FFxST)
I
Slice A
I
Slice A
I
Slice B
IFFxSTIL e s i o n ·
l
Slice B
IFFxSTI1
Lesion
I-
I
•
ST - (FFxST)
y
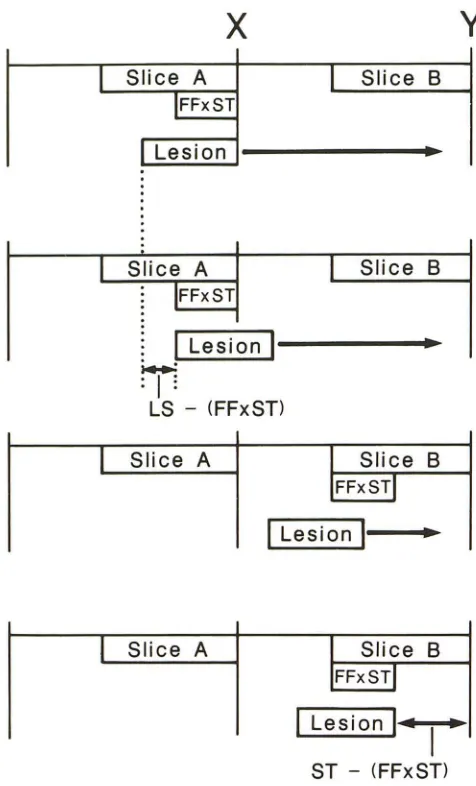
Fig. 1.-Computer simulation diagram. To simulate the variable position of a lesion (of size LS) relative to the slice thickness (ST) and interslice gap, the lesion is advanced by computer through the entire interval from
the right edge of slice A to the right edge of slice B. This is interval INT in
equations 4 and 7 in text. Detection occurs whenever the lesion overlaps
either slice A or slice B at least by the amount FF x ST (where FF is the
threshold filling factor for detection and ST is the slice thickness). Moving
from left to right, detection occurs over the distance LS - (FF x ST) as the
lesion overlaps slice A by FF x ST. Continuing to the right, detection does not occur again until there is a minimal overlap (by FF x ST) of slice B. Detection then occurs over the distance ST - (FF x ST) until the lesion
has been moved to the right edge of slice B.
equal to FF x ST. The distance over which detection occurs is thus
equal to the lesion size minus the size threshold:
LS - FF x ST (5)
As the lesion continues toward point Y and begins to overlap slice S,
detection does not occur initially, because the overlap is not greater
than the size threshold. Eventually, the slice S overlap equals FF x ST, and detection occurs over the distance from this point to point
Y. This distance is equal to the slice thickness minus the required
size threshold:
[image:2.612.316.554.80.473.2]AJNR:8, November/December 1987 LESION DETECTION BY MR 1059
Filling Factor
DetectIOn Threshold • 20%
0:
6
:::::::::=----::==_===_
· •
_______ "
08
1 ______________
a~: ~
---"
Detection 0 5 L" Rate
0 '
A
::l
25+---
--
--~~---_+---~
"
75 Slice Thickness (mm)
Filling Factor
Detection Threshold -60%
09
i
---
-
----
-
-10
08
4
-07
t
06-1Detection 05
i
---R.,. 0' -I '- -- - - -
-0
.
3
L
"
0.2o
~
1
i
25 75 10
Slice Thickness (mm)
c
_e_ t Omm lesion ·0- 8mm lesion -•• 6mm lesion
-0-4mm lesion ... 2mm lesion
-.- 10mm lesion
·0- Bmm lesion
'.- 6mm lesion -0- 4mm leSion
.... 2mm lesion
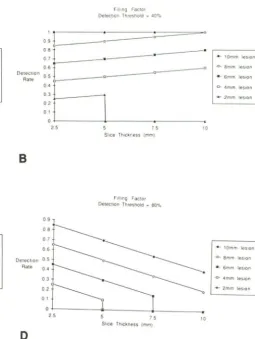
Fig. 2.-Calculated lesion-detection rate versus slice thickness and
filling-factor detection threshold as a function of lesion size. Since the slice
spacing or "interval" remains constant at 10 mm, the following gaps are
associated with particular slice thicknesses: 2.S-mm slice (7.S-mm gap),
S-mm slice (S-mm gap), 7.S-mm slice (2.S-mm gap), and 10-mm slice (no
gap). The detection rate of lesions with a 2-,4-, 6-, 8-, or 10-mm diameter
This distance, added to the distance of detection during overlap of
slice A and divided by the interval INT, is equal to the probability of
detection. Thus, combining equations 5 and 6, the probability of
detection for situation 3 is:
p _ (LS - FF x ST) + (ST - FF x ST)
3 - INT
Methods
LS + ST - 2(FF x 5T)
INT (7)
Using a commercial microcomputer: equations 3, 4, and 7 were
used to determine the probability of detecting a lesion of given size,
inherent contrast-filling factor, and variable percentage of slice thick
-ness relative to total interval. Lesion size was varied from 2-10 mm
• MaCintosh-Pius with 20 MByte Hyperdrive.
Filling Factor
DelechOn ThreShold • 40%
o:
~_--
--08
1
07. _ _ -06 i
Detection a 5 ~
Rate
0---B
o
~:L----~~1
l
25 75
Slice Thickness (mm)
Filling Faclor Delecllon Threshold _ 80%
Slice Thickness (mm)
,e- 10mm leSion
·0_ 8mm leSion -.- 6mm leSion
·0- 4mm leSion
--2mm leSion
10
-.-10mm leSion -0-8mm leSion -•• 6mm leSion -0- tlmm leSion ... 2mm leSion
is determined for filling-factor detection thresholds of 20% (A), 40% (B),
60% (e), and 80% (D). An upward slope of detection rate versus slice
thickness indicates predominance of interslice gap effects (seen with
high-contrast lesions in A and B) while a downward slope indicates
predomi-nance of partial volume effects (seen with low-contrast lesions in C and
D).
in 2-mm steps; the percent slice thickness varied from 25-100% in
25% increments, corresponding to the following combination of slice
thicknesses and gaps over a constant interval of 10 mm: 2.5-mm
slicef7.5-mm gap, 5-mm slicej5-mm gap, 7.5-mm slice/2.5-mm gap,
10-mm Slice/no gap (contiguous slices). The effects of variable filling
factor FF' and inherent contrast were combined as the filling-factor
detection threshold (FF), which was varied from 20-80% in 20%
increments.
To demonstrate the clinical relevance of this analysis, a patient
with multiple sclerosis (M5) having multiple, small, low-contrast
le-sions was studied using both 10-mm contiguous slices and 5-mm
slices with a 5-mm gap. The patient was studied on a 0.35-T
Diasonics MR imager using reduced bandwidth technology and
equipped with a quadrature detection head coil. Both sequences
used 256 x 256 acquisition matrixes in a 23.4-cm field of view for
0.95-mm in-plane spatial resolution. Both studies used a TR of 2 sec
and two excitations for an acquisition time of 17 min. For the 10-mm
contiguous slices, the TEs were 30 and 60 msec; for the 5-mm series,
the TEs were 40 and 80 msec (to allow a longer echo sampling time,
thereby partially equalizing the signal-ta-noise ratio for the two
[image:3.617.299.554.81.419.2]Results
The calculated detection rate is plotted against slice
thick-ness (for constant slice thickness plus gap interval of 10 mm)
in Figures 2 and 3. Detection rates are calculated on the basis
of an equal probability of lesion position at any point relative
to the slice. In Figure 2, lesions ranging in size from 2-10 mm
are shown for filling-factor detection thresholds (i.e., actual filling factors x intrinsic contrast) of 20% (Fig. 2A), 40% (Fig.
2B), 60% (Fig. 2C), and 80% (Fig. 2D). For high-contrast lesions (FF 20%), the detection rate is seen to increase as
the slice thickness increases owing to a decrease in the
Detecllon
Rate
A
Detection
Rate
C
2mm LesIOn
08
---
.
::
----
.
---
.
07
04 _ _ _ _
::!--°L
oJ
l
00 - - --2.5 7.5 10
Shce Thickness (mm)
6mm LesIOn
::
L---
.
·---
_0-07
+
ost
o
st
::I
~
o
~
~
25 75 10
Slice Thickness (mm)
IOmm Lesion
1 ? - - - -- - -
-09
+---08 0_________
0
---_
07
---0
06 _ _ _ _ _ _
Dc~ea~~on 05 ° ______ 0
0'
E
03
02 o I
25 75
Shco Thickness (mm)
10 -e-FF .. 2O"/o
-0-FF_40"/o
-•• FF .. 60"10
.0-FF_8O"/o
-e· FF.20%
-0- FF_40%
-.-FF .. 60'%
-c-FF_BO"lo
-e· FF.20%
-.- FF_60%
-0-FF_BO%
interslice gap (Fig. 2A). Since high-contrast lesions need only fill a small percentage of the slice to be detected, the presence of any gap between slices decreases the overall lesion detec-tion. As lesion contrast starts to decrease (Fig. 2B), an optimum slice thickness is noted for the smallest lesions. The detection rate initially increases as slice thickness is increased
because of a decrease in the interslice gap. However, as the
slice thickness continues to increase, the smaller,
low-con-trast lesions become undetectable because of overwhelming partial volume effects. The detection of larger lesions, on the other hand, continues to increase as the gap is decreased.
Continued decrease in lesion contrast (i.e., increase in
Detection
Rate
B
Detection
Rate
o
25
01
25
4mm LeSion
7.5
Shce Thickness (rnm)
8mm LeSIOn
7.5
Shce Thickness (mm)
_e_ FF.20%
-0-FF.40"10
-.-FF_60"10
-c-FF_BO"lo
10
_e_ FF.2()<'/o
-.-FF .. 60"'/o
-0-FF-BO%
10
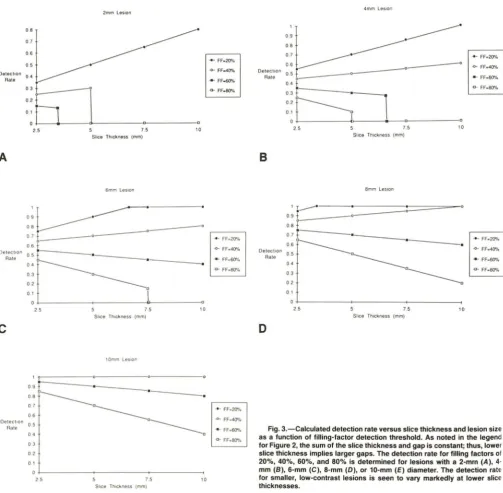
Fig. 3.-Calculated detection rate versus slice thickness and lesion size as a function of filling-factor detection threshold. As noted in the legend for Figure 2, the sum of the slice thickness and gap is constant; thus, lower
slice thickness implies larger gaps. The detection rate for filling factors of
[image:4.615.58.562.239.733.2]AJNR:8, November/December 1987 LESION DETECTION BY MR 1061
filling-factor detection threshold) leads to generally lower
de-tection rates because of increasing partial volume effects (Fig.
2C). Smaller lesions may be missed entirely regardless of position as the slice thickness is increased because of partial
volume effects. For the lowest-contrast lesions, which require
a filling factor of 80% for detection, the detection rate falls off
rapidly as the slice thickness is increased, because of
increas-ing partial volume effects.
In Figure 3, variable filling-factor detection thresholds (FF)
ranging from 20-80% are plotted for different lesion sizes: 2
mm (Fig. 3A), 4 mm (Fig. 3B), 6 mm (Fig. 3C), 8 mm (Fig. 3D),
and 10 mm (Fig. 3E). The detection rate for smaller lesions
(Fig. 3A) depends strongly on lesion contrast. The detection
of high-contrast lesions (FF 20%) improves as slice thickness
increases, because of concomitant decrease in the interslice
gap (Fig. 3A). The rate of increase in detection with increasing
slice thickness decreases rapidly as the contrast is decreased
owing to increasing partial volume effects. Lower-contrast
2-mm lesions may not be detectable even at the minimum slice
thickness. As the lesion size increases to 4 mm (Fig. 3B), the
effect of contrast is decreased, the detection rate changing
more slowly with increasing slice thickness. Larger,
higher-contrast lesions are seen to be 100% detectable regardless
of lesion size in Figures 3C-3E. The detection of large,
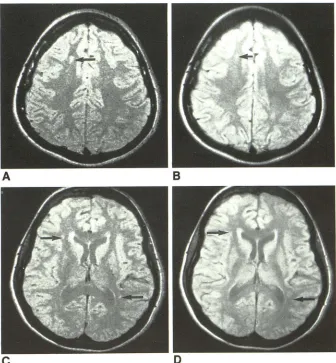
low-Fig. 4.-Comparison of 5- and 10-mm slice thicknesses in patient with multiple sclerosis. Five-millimeter slices with a 5-mm interslice gap
(A and C) are compared with 10-mm contiguous slices (B and D) to determine the conspicuity of
A
small, low-contrast multiple sclerosis plaques. This comparison reveals that small lesions may be missed when thick slices are used despite the absence of a gap between slices. When there is diffusely distributed disease, thin slices even
with a gap may be preferable to thick contiguous slices.
A, 5-mm slice through centrum semiovale
showing definite multiple sclerosis plaques (ar-row).
B, 10-mm slice through same level as A with
significantly decreased lesion conspicuity (ar-row).
C, 5-mm section through lateral ventricles showing several demyelinating plaques (ar-rows).
D, 10-mm slice through same section as C showing decreased lesion conspicuity (arrows). All images acquired with 0.95-mm in-plane
spa-tial resolution (256 x 256 acquisition matrix), two
excitations, 17-min acquisition time, TR
=
2.0 sec, TE = 30 (B, D) or 40 msec (A, C).c
contrast lesions is seen to decrease with increasing slice
thickness because of increasing partial volume effects (Fig.
3E).
Figure 4 is a comparison of 10-mm-thick contiguous slices
with 5-mm slices having a 5-mm gap. Both studies cover the
entire brain and both take 17 min for acquisition (using 256
phase-encoded projections, two excitations, and a TR of 2.0
sec. Figure 4 illustrates the effect of varying slice thickness
on the detection of low-contrast lesions in a patient with
multiple sclerosis. The lesions are clearly better seen on the
5-mm slices (Figs. 4A and 4C) than on the 1 O-mm slices (Figs.
4B and 40).
Discussion
At first glance, it might appear that a gap between slices is
always detrimental to lesion detection, since lesions in the
gap would be missed. Such gaps were accepted on early MR
imaging systems to minimize the detrimental effect of "cross talk" (i.e., partial excitation of adjacent slices) on C/N. Indeed,
once contiguous-slice technology became available, some
MR manufacturers did not even offer an optional interslice
gap in certain software releases. Unfortunately, there are
B
[image:5.612.222.558.379.742.2]certain settings in which this restriction may decrease lesion
detection.
Barring signal-to-noise limitations, thinner slices decrease
partial volume effects, increasing the detection rate,
particu-larly for low-contrast lesions. At constant TR (allowing the
same number of slices in a 2DFT multislice acquisition),
decreasing the thickness of multiple contiguous slices would
decrease the coverage (4). To cover a specified imaging
volume (e.g., the entire brain) with thinner slices would thus
entail an increase in total study time, which may be
unac-ceptable in certain clinical settings [4]. For fixed study time,
this analysis shows that lesion detection may be increased
using thinner slices, even with an interslice gap. While it is
obvious that small lesions within the gap will not be detected,
it is less obvious that small, low-contrast lesions may not be
detected at all with thicker slices.
For high-contrast lesions that need only fill a small
percent-age of a thick slice to be detected, the presence of the gap
limits the lesion-detection rate. For lower-contrast lesions,
however, partial volume effects are the main limitation to
detecting them. As suggested by Figure 4, small MS plaques
may be totally undetected with thick slices but may be well
seen with thinner slices. Thus, for diffusely distributed disease
involving small, low-contrast lesions, thin slices even with a
gap between them may be preferable to thick, contiguous
slices.
While the effect of decreasing slice thickness on SIN (and
therefore on GIN) has been ignored, this is only strictly
possible at high enough intrinsic values of SIN that such
losses are imperceptible. Holding all the parameters constant,
a decrease in the slice thickness will cause a proportional
(i.e., linear) decrease in the SIN [5]. Since visual perception
is logarithmic, such proportional decreases in SIN are actually
only perceived as such at very low values [5]. Thus, to include
the quantitative effect of changing slice thickness on
per-ceived GIN would require knowledge of the absolute value of
SIN as well as knowledge of a complex visual perception function (which is well beyond the scope of the present
analysis). In reality, perceptible losses in SIN resulting from
thinner slices are usually offset by additional excitations [5]
or by decreasing the bandwidth. Increasing the number of
excitations has the unfortunate side effect of increasing the acquisition time [6], while a lower bandwidth generally
re-quires a longer echo delay time (TE). (The longer TE [40
msec) in Figs. 4A and 4G compared with 30 msec in Figs. 4B
and 4D is the result of prolonging the echo sampling time to
decrease the bandwidth.)
Unfortunately, Figure 4 is not a pure comparison; that is,
TE, bandwidth, and SIN cannot be held constant while only
varying slice thickness. Thus, while Figure 4 is intended
primarily to demonstrate the effect of decreasing slice t
hick-ness on GIN, this will be influenced by the longer TE, the
thinner slice, and the reduced bandwidth. Assuming T2 values
of 75 msec for white matter and 94 msec for MS plaques
[7], increasing the TE from 30 to 40 msec increases contrast
by 14% (due to greater T2-weighting) and decreases SIN by
12% (due to greater T2 decay). The 50% reduction in slice
thickness results in a 50% reduction in SIN and, therefore, in
GIN. This is partially compensated by the reduced bandwidth,
which increases SIN by approximately 14% (Mark Winkler,
personal communication). How these second-order effects
influence the perceived "conspicuity" of the lesions in Figure
4 depends in the final analysis on the absolute value of SIN
and on the complicated process of visual perception.
ACKNOWLEDGMENTS
We thank Leslee Waston, Terry Andrues, Jay Mericle, and Jose
Jimenez for technical assistance; Cathy Reichel-Clark for art work;
and Kaye Finley for editorial assistance.
REFERENCES
1. Wehr1i FW, MacFall J, Newton Th. Parameters determining the appearance
of NMR images. Modern neuroradiology: advanced imaging techniques,
vol. II. San Francisco: Clavadel Press, 1983
2. Wehrli FW, MacFall J, Shutts 0, et al. Mechanism of contrast in NMR
imaging. J Comput Assist Tomogr 1984;8(3):369-380
3. Villafana T. Physics and instrumentation, Chapter 1. In: Lee SH, Rao
KCVG, eds. Cranial computed tomography. New York: McGraw-Hili,
1983:20
4. Bradley WG, Tsuruda JS. MR sequence parameter optimization: an
algo-rithmic approach. AJR 1987;149:815-823
5. Bradley WG, Kortman KE, Crues JV. Central nervous system
high-reso-lution magnetic resonance imaging: effect of increasing spatial resolution
on resolving power. Radiology 1985;156:93-98
6. Enzmann DR, O'Donohue J. Optimizing MR imaging for detecting small
tumors in the cerebellopontine angle and internal auditory canal. AJNR,
1987;8:99-106
7. Darwin RH, Drayer BP, Riederer SJ, et al. T2 estimates in healthy and
diseased brain tissue: a comparison using various MR pulse sequence.