Ruth G. Ramsey1
Charles E. Zacharias
1This article appears in the March/April 1985 issue of AJNR and the June 1985 issue of AJR.
Received September 14, 1984; accepted after revision November 23, 1985.
1 Department of Diagnostic Radiology, Rush-Presbyterian-St. Luke's Medical Center, 1753 W. Congress Parkway, Chicago, IL 60612. Address reprint requests to R. G. Ramsey.
AJNR 6:247-251, March/April 1985 0195-6108/85/0602-0247 © American Roentgen Ray Society
MR Imaging of the Spine
after Radiation Therapy:
Easily
Recognizable
Effects
MagnetiC resonance (MR) imaging of the spine after radiation treatment in four
patients demonstrated well defined areas of increased signal intensity in the vertebral
bodies on short or T1-weighted sequences. Radiation doses of 4000-5790 rad (40-57.9 Gy) were administered to the mediastinum, rectum, and spine. The interval between radiation treatment and MR imaging was 2 months to 10 years. The abnormally increased areas of signal intensity seen on MR images were best demonstrated in the midsagittal plane and were easily differentiated from involvement by tumor. The alteration in signal intensity probably was secondary to replacement of marrow by fatty tissue and corre-sponded closely with radiation therapy portals.
Magnetic resonance (MR) imaging of the spine is an excellent method for
evaluation of the vertebral column for bony metastases [1-3].
While
studying
patients with possible
bone
metastases, it became apparent
that
there was
a
typical pattern that
is
demonstrated in patients who have received previous
radiation therapy treatment to the
vertebral
column. The MR appearance after
radiation is that of increased signal intenSity of the bone marrow of
the
vertebral
bodies on the T1-weighted 30 msec echo-time (TE) and 530 msec repetition-time
(TR) spin-echo (SE) sequences (SE 530/30). On the longer SE sequences,
such
as
SE 2090/90,
this
change
is
less apparent. Typically the area of altered
signal
intenSity demonstrates very well defined margins corresponding to
the
radiation
port
.
Subjects and Methods
Four patients studied with MR scans demonstrated evidence of alteration in the signal
intenSity of the vertebral bodies secondary to radiation treatment. The time interval from
radiation treatment to MR examination varied from 2 months to 10 years.
Patients with metastatic disease may develop signs and symptoms of vertebral column
metastases, and while radiographs of the spine may be normal or abnormal, sometimes
radiation treatment to the vertebral column is begun on an empiric basis in symptomatic
patients. We began a study of the efficacy of the use of MR in the evaluation of bone metastases to the vertebral column (to be reported separately). During the course of study,
it became apparent that patients who had previously received radiation treatment to the vertebral column demonstrated areas of increased signal intensity in the bone marrow of
those vertebral bodies included in the treatment port. These areas of increased signal intenSity were best demonstrated on SE 530/30 sequences. Four examples are illustrated.
All these patients were examined using the 0.5 T (5 kG) superconductive magnet (Teslacon,
Technicare Corp., Solon, OH) with a bore size of 100 cm. The scan slices illustrated are 1 cm in thickness, and were obtained using a 128 x 256 matrix size. All examinations were
248
RAMSEY AND ZACHARIAS
AJNR:6, March/April 1985A
B
Fig. 1.-Case 1. A, SE 530/30 image using two signal averages per slice. Area of increased signal intensity involves C7, T1, and T5-T7 (white arrows). T2-T 4 vertebral bodies demonstate low signal intensity secondary to tumor
involvement (black arrows).
e
,
SE 2090/90 or T2-weighted image shows pathologic fracture of anterior part of T3 and T 4 better. Also, large anterior paras pinal soft-tissue mass is at T3 level (arrow). Esophagus was invaded byCase Reports
Case 1
A 32-year-old man had previous surgery for removal of an
undif-ferentiated tumor (germ cell carcinoma) of the mediastinum. After
surgery the patient was treated with 4000 rad (40 Gy) over 20 days
to regional lymph nodes and 5000 rad (50 Gy) to the tumor bed. The vertebral column was also included in the treatment port because the tumor could not be totally removed from the paraspinal area at
surgery.
The patient did well for about 2 months and then developed severe upper-thoracic-spine pain. MR imaging was performed for evaluation
of the presence or absence of bony metastases. The SE 530/30
sequence demonstrated low signal intensity involving T2-T4, sec-ondary to replacement of the fatty bone marrow by tumor tissue. There were pathologic fractures at T3 and T4. In addition, there was
well defined increased signal intensity in the vertebral bodies of C7, T1, and T5-T7 (fig. 1A). The area was well demarcated. The SE
2090/90 image demonstrated the pathologic fractures of T3 and T4
to better advantage (fig. 18). The abnormally increased signal area corresponded precisely to the radiation treatment port (fig. 1 C).
Case 2
A 54-year-old man had recurrent carcinoma of the rectum. He was
originally treated with near-total surgical removal of carcinoma of the
rectum about 5 years before this examination. After his initial surgery, he received 5790 rad (57.9 Gy) to the tumor bed.
He did well until 2 weeks before the examination when he devel -oped increasing pelvic pain; repeat surgery revealed recurrent tumor
in the bed of the previous surgical resection. MR demonstrated that the entire sacrum, with the exception of the upper one-fourth of S1,
c
tumor at this level and was well demonstrated on axial section (not shown).
Because of slight scoliosis secondary to pathologic fractures of T3 and T 4, spinal cord is not demonstrated in its entirety on this 1-cm-thick midsagittal
section. C, Treatment-port film corresponds to abnormal area of high signal intensity.
had abnormally increased signal intensity on the SE 530/30 sequence
(fig. 2). The port film was not available, but by history the port corresponded to the abnormal signal area.
Case 3
A 40-year-old man initially had surgery 2 years before this
admis-sion for removal of a grade II astrocytoma involving the spinal cord
at the level of the conus medullaris. Immediately after the partial
surgical removal of the tumor, he received 5000 rad (50 Gy) of radiation treatment to the lower thoracic spinal cord over a 5 week period. The patient did well until about 2 months before this study when progressive right leg weakness and numbness developed.
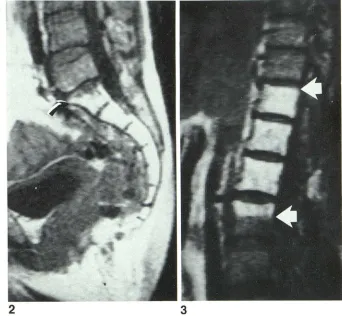
MR demonstrated a very well defined area of increased signal intensity involving T1 O-L 1 on the SE 530/30 sequences (fig. 3A). The
well demarcated involvement of the upper one-half of the vertebral
body of L 1 corresponded exactly to a midsagittal computed
tomo-graphic myelogram reconstruction image demonstrating the laminec-tomy sites (not shown). The port film was unavailable, but by history the laminectomy sites corresponded to the treatment port.
Case 4
A 21-year-old man was treated for testicular carcinoma and
re-ceived an unknown amount of radiation to the abdominal paraaortic lymph nodes 10 years before this examination. He was disease-free
and did well until 2 months before admission when he developed
weakness of the legs.
MR of the spine demonstrated the increased signal intensity within
the treatment port and also demonstrated the typical deformities of
Fig. 2.-Case 2. Midsagittal SE 530/30 image.
Increased intensity in lower three-fourths of S 1 and
involving rest of sacrum and coccyx (arrow). This abnormal area corresponds to radiation treatment port.
Fig. 3.-Case 3. Midsagittal SE 530/30 image.
Increased signal intensity of T1 0-T12 vertebral
bodies and upper one-half of L 1 vertebral body.
This corresponds to radiation treatment port (ar-rows). No evidence of recurrent tumor.
Discussion
2
It is well known that radiation treatment depresses the red
and white blood cell counts because of depression of the
blood-producing bone marrow of the vertebral bodies. After
radiation treatment
,
it appears that
there
is probably
perma-nent damage to the marrow-containing space within the
ver-tebral body
.
This has been shown with radionuclide and
pathologic studies [5-11]. The MR scan confirms that there
is replacement of at least part of the normal bone marrow
,
with an increase in the high-signal-intensity material
,
probably
adipose tissue, normally demonstrated on the SE 530/30
sequences
.
Radionuclide Bone Scanning after Radiation
The response of bone marrow to radiation therapy after
treatment of lymphoma and other neoplastic conditions has
been described [5, 6]. Local irradiation in the range of
300-4500 rad (3-45 Gy) produces rapid bone-marrow suppression
of the irradiated marrow that persists for
1-2
years
.
De-creases in peripheral blood counts seen routinely after radia
-tion treatment are an unreliable indicator of the
extent
of
bone-marrow activity
.
Therefore
,
radionuclide
imaging
of
the
marrow space has been used
to
assess marrow activity.
Technetium-99m sulfur colloid is used for
imaging
of
the
3
reticuloendothelial component of marrow
,
and
52
Fe
is
used
for
imaging
of
the
erythropoietic component
of the
medullary
space [5]
.
These radionuclide studies allow
semiquantitative
geographic mapping of
bone
marrow
and
demonstrate
mar-row
suppression
at
some sites,
e
xp
ansion
at
other
sites
,
regeneration
of
irradiated
marrow, and
extramedullary
he
-matopoiesis
.
Histopathology after Spine Radiation
The histopathologic effect of therapeutic
irradiation on
bone
marrow has been
studied
both experimentally and
in
patients
receiving
radiation
therapy
.
The local
bone
-
marrow
effects
have
been studied in
the rat
after 2000-10,000
rad (20-100
Gy) with histologic examination from 24 hr
to
1 year
after
irradiation
[7]
.
In another
study
,
18 patients
with breast
car-cinoma who received postoperative irradiation of
the internal
mammary lymph nodes on
the
side of the mastectomy under
-went serial bone-marrow
biopsies.
Sternal bone
-
marrow
as-pirates were obtained before
therapy
,
after
e
x
posure of 2000
rad (20
Gy), at
the end
of
therapy,
and subsequently
every
3
months
up
to
18
months posttreatment.
In
addition
,
seven
patients who had received
intensive
local irradiation
at
least
2 months before
death
underwent
marrow aspiration from
five anatomic
sites at autopsy [8]
.
These
and other
studies
[9-11]
describe
an
i
nitial
progressive reduction of cellular
[image:3.612.213.555.86.402.2]250
RAMSEY AND ZACHARIAS
AJNR:6, March/April 1985A
B
MR Imaging
The
increase in marrow signal intensity on
the
T1-weighted,
short
SE pulse sequences
,
such
as the SE 530/30 images
illustrated
in our four cases
,
may be secondary to an absolute
increase in the number of adipose cells in the irradiated
marrow
.
The increased signal may also be secondary to a
relative increase
in signal intensity because of a decrease in
the
hematopoietic element of the
radiated
marrow as
com-pared
with
the lower-signal-intensity nonirradiated marrow
.
One might hypothesize
that there is
a varying
response
depending on
the treatment.
However
,
at
this
time the lower
limit of treatment dose to produce this
appearance of
in-creased signal
intensity on MR
images is
unknown
.
From our
present
case
studies
,
it appears that this
alteration in
the
normal
marrow is apparent as
early
as 2 months (case
1),
Fig. 4.-Case 4. A, Midsagittal SE 530/30 im-age. Area of increased signal intensity extends from T12 (arrow) through sacrum. Dorsal one-third of T11 also demonstrates abnormal area of increased signal intensity. By history, this corresponds to treatment port. Cerebrospinal fluid has low signal intensity with this spin-echo sequence. B, SE 2090/ 90 image shows postradiation deformity of verte-bral bodies better. In addition, relatively low signal from L4-L5 disk (arrow) indicates degenerated disk at this level [4]. Cerebrospinal fluid has high signal intensity with this SE sequence.
and while the duration of this change is unknown, at least
one patient (case 4) demonstrated altered signal intensity 10
years after radiation treatment. This alteration in signal
inten-sity
is probably permanent.
Summary
After radiation treatment to the vertebral column, areas of
increased
signal intensity are readily identified on SE 530/30
sequences and correspond to the treatment port
.
This
in-crease in signal intensity is presumed to be secondary to
replacement of the normal bone marrow by either an absolute
or relative increase in the amount of fatty
tissue.
Previous
MR studies have demonstrated that
tumor
replacement of
intensity with T1-weighted images as compared with
the
normal vertebrae [1-3].
In those vertebrae with postradiation alteration of signal
intensity, the vertebral bodies are otherwise intact, with well
defined cortical margins and without an associated paras pinal
soft-tissue mass. It is important to be aware that these well
defined abnormal areas of increased signal
intensity
are
sec-ondary to the radiation treatment of
the
vertebral
column
rather
than to
some other pathologic condition
.
ACKNOWLEDGMENT
We thank Carol Lee Hanny for help in manuscript preparation.
REFERENCES
1. Han JS, Kaufman B, EI Yousef SJ, et al. NMR imaging of the
spine. AJNR 1983;4: 1151-1159, AJR 1983;141: 1137-1145
2. Modic MT, Weinstein MA, Pavlicek W, et al. Nuclear magnetic
resonance of the spine. Radiology 1983;148:757-762
3. Norman D, Mills CM, Brant-Zawadzki MB, Yeates A, Crooks LE,
Kaufman L. Magnetic resonance imaging of the spinal cord and
canal: potentials and limitations. AJNR 1984;5:9-14, AJR
1983;141 :1153-1156
4. Chafetz NI, Genant HK, Moon KL, Helms CA, Morris JM. Rec
-ognition of lumbar disk herniation with NMR. AJNR 1984;5:23
-26,AJR 1983;141:1153-1156
5. Fordham EW, Ali A. Radionuclide imaging of bone marrow. Semin
Hemato/1981;18:222-239
6. Bell EG, McAfee JG, Constable WC. Local radiation damage to
bone marrow demonstrated by radioisotopic imaging. Radiology 1969;92: 1 083-1 088
7. Knospe WH, Blom J, Crosby WHo Regeneration of locally
irradi-ated bone marrow. I. Dose dependent, long-term changes in the
rat with particular emphasis upon vascular and stromal reaction. Blood 1966;28 :398-415
8. Sykes MP, Chu FCH, Wilkerson WG. Local bone marrow
changes secondary to therapeutic irradiation. Radiology
1960;75: 919-924
9. Hill DR, Benak SB, Phillips TL, Price DC. Bone marrow regen-eration following fractionated radiation therapy .Int J Radiat Oncol Bioi Phys 1980;6: 1149-1155
10. Rubin P, Landman S, Mayer E, Keller B, Ciccio S. Bone marrow regeneration and extension after extended field irradiation in
Hodgkin's disease. Cancer 1973;32:699-716
11. Sacks EL, Goris ML, Glatstein E, Gilbert E, Kaplan HS. Bone
marrow regeneration following large field radiation. Influence of