Since the late 1970s, satellite telemetry has been used to follow the ocean movements of sea turtles. The tracking studies have benefited from improvements in telemetry equipment over the past two decades. The transmitters were initially large and heavy devices, weighing several kilograms and packaged into containers shaped like doughnuts, cones or cylinders (Timko and Kolz, 1982; Stoneburner, 1982). Because the smallest of these early designs was the size of a football, they had to be tethered to the back of the turtle’s shell. Advances in microelectronics produced smaller and lighter devices, eventually allowing the attachment of ‘backpack’ transmitters directly to the shell (Balazs, 1994; Renaud, 1995; Papi et al. 1997). This is now the preferred method for tracking hard-shelled turtles such as the green turtle (Chelonia mydas), which rest within coral caves and under outcroppings, where a tethered transmitter could become entangled (Dizon and Balazs, 1982).
A rectangular box with a whip antenna, the backpack is glued to the topmost part of the shell. Two buttons on the front of the device serve as a switch to deactivate the transmitter when submerged to preserve the batteries. Salt water provides the conductive link between the buttons so that, when exposed to air, the circuit is broken and a signal is transmitted to the satellite. The transmitter’s location on top of the shell ensures that the switch will function properly. However, the location
is not optimal from a hydrodynamic standpoint, because the unit will increase drag by causing flow separation and turbulence. The energy expended in swimming is proportional to the drag. This means that the turtle will swim either more vigorously to compensate for the added resistance or at a lower speed for the same effort. Either result could harm the turtle by increasing the energy required to migrate.
Previous hydrodynamic investigations have focused on the swimming behavior of hatchling and juvenile sea turtles. Using a recirculating water channel, Wyneken (1988) measured drag and lift forces on green and loggerhead (Caretta caretta) hatchlings. The results showed that green turtles have superior streamlining and thrusting capacity, leading to higher swimming speeds than those achieved by loggerheads. Prange (1976) measured drag forces on a juvenile green turtle with a head-to-tail length of 24 cm. Assuming geometric similarity, Prange (1976) used these drag data for the juvenile to estimate the metabolic efficiency of adults during migrations. Logan and Morreale (1994) employed aircraft design methods to show that juvenile sea turtles possess a ‘laminar’ flow shape that minimizes drag. Such a body shape enables the turtle to swim with a small expenditure of energy.
Despite almost 20 years of telemetry research, experimental studies are lacking on the hydrodynamic effect of a transmitter on the swimming energetics of a sea turtle. We have used wind JEB1480
Wind tunnel tests were performed to measure the effect of a satellite transmitter on a juvenile green turtle (Chelonia mydas). A full-scale turtle model was constructed from an 11.5 kg specimen with a 48 cm carapace length, and a transmitter model was constructed from a Telonics ST-6. The turtle model was tested in a wind tunnel with and without the transmitter, which was mounted on the forward, topmost part of the carapace. Drag, lift and pitch moment were measured for several speeds and flow angles, and the data were scaled for application to the marine environment. At small flow angles representative of straight-line swimming, the transmitter increased drag by
27–30 %, reduced lift by less than 10 % and increased the pitch moment by 11–42 %. On the basis of the drag data at zero angle of attack, it is estimated that the backpack will reduce swimming speed by 11 %, assuming that the turtle produces the same thrust with the unit attached. The drag data are also used to estimate the effect of a transmitter on the swimming energetics of an adult green turtle. Design guidelines are included to minimize the adverse forces and moments caused by the transmitter.
Key words: green turtle, Chelonia mydas, hydrodynamics, lift, drag, pitch, transmitter, telemetry, energy, swimming.
Summary
Introduction
HYDRODYNAMIC EFFECT OF A SATELLITE TRANSMITTER ON A JUVENILE
GREEN TURTLE (CHELONIA MYDAS)
KENNARD P. WATSON1,* ANDROBERT A. GRANGER2
1Naval Surface Warfare Center, Coastal Systems Station, Code R11, Panama City, FL 32407, USA and 2US Naval
Academy, Department of Mechanical Engineering, Annapolis, MD 21402, USA *e-mail: watsonk@atcf.ncsc.navy.mil
tunnel testing to quantify the effect of the transmitter on a model of a juvenile green turtle. This small turtle was selected to reduce model construction costs and because green turtles are famous for their long-range migrations of over 1000 km (Carr, 1984; Balazs, 1994). The test procedure is similar to that of Obrecht et al. (1988) and Bannasch et al. (1994), who investigated the drag of devices mounted on the back of flying birds and penguins.
Materials and methods
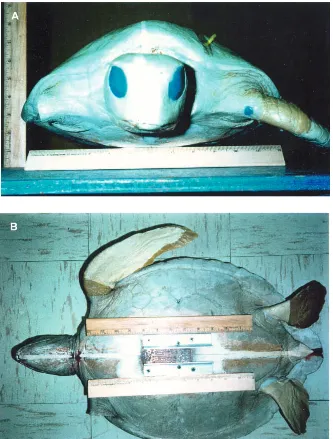
A full-scale cast model was constructed from the carcass of a juvenile green turtle Chelonia mydas. The body was made from Ultracal plaster, offering the best characteristics of high strength, low mass and minimal shrinkage during casting. However, the material was not suitable for the flippers, which were tapered and very thin at the edges, where plaster would be brittle. This problem was solved using Alumalite, a
fast-curing material that is more flexible than the plaster. The Alumalite flippers were poured separately, making provisions for attaching them to the plaster body. Frontal and planform views of the model are shown in Fig. 1. The length and width of the carapace were 47.8 cm and 36.9 cm, respectively. The axial distance from the head apex to the center of mass was 30.7 cm, and the axial distance from the head apex to the end of the carapace was 54.6 cm. Using a polar planimeter, which works as a numerical integrator, the measured planform area of the carapace was 1517 cm2and the measured frontal area was 398 cm2.
[image:2.609.230.563.300.739.2]The carcass weighed 113 N (mass 11.5 kg) and displaced 1.062 m3 of water when fully submerged, giving a buoyant force of 107 N in salt water. Milsom (1975) found that loggerhead sea turtles develop buoyancy control after the first year of life. Buoyancy is controlled by the amount of air in the lungs, with the volume adjusted by the smooth muscle in the lung. A turtle is neutrally buoyant if its weight and buoyancy
are equal in magnitude. In this case, the turtle has a submerged weight of zero and will neither sink nor rise when at rest, since weight and buoyancy are the only forces present at zero speed in still water. The tested specimen was negatively buoyant, with an in-water weight of 6 N causing it to sink. (Sign conventions for the force vectors are discussed below.) However, if Milsom’s (1975) findings are applicable to juvenile green turtles, the animal may have been able to achieve neutral buoyancy when its lungs were inflated.
The transmitter model was made from high-density foam, with an aluminum antenna and screws on the front to simulate the salt-water switch. The transmitter was based on a Telonics ST-6, which was used in a tracking study of juvenile green turtles in the Gulf of Mexico (D. Shaver, personal communication). While smaller units such as the ST-10 are more commonly used to track juvenile turtles, the ST-6 was selected for this study to provide a worst-case measurement for the hydrodynamic effect of a transmitter. The operational unit with batteries weighed 4.4 N (mass 0.45 kg), or 4 % of the turtle’s weight in air, and displaced 371 cm3 of water when fully submerged (3.7 N buoyant force in sea water). Fig. 2 is a diagram of the ST-6, measuring 13.7 cm×6.6 cm×4.4 cm with a frontal area of 25.7 cm2. The antenna length and width were 14 cm and 0.32 cm, respectively. The antenna included a thick base 3.7 cm long with a diameter of 0.64 cm. Modeling clay was used to create a platform to fair the transmitter model smoothly to the shell.
Definition of terms
Fig. 3 is a diagram of the forces and moments acting on a swimming sea turtle. The vectors are shown in the positive direction, with the flow vector shown relative to the turtle’s frame of reference. The magnitude of the flow is equal to the swimming speed when the turtle is traveling in still water (no waves or currents). The angle of attack is the angle between the relative flow velocity and the turtle’s longitudinal axis. Drag is defined as the resistance force parallel to the flow
vector, and lift is perpendicular to the drag. The forces generate a pitch moment (positive = nose up) acting about the center of mass. The drag, lift and pitch moment are functions of the speed and angle of attack. The turtle will experience an additional hydrodynamic side force, yaw moment and roll moment for general three-dimensional motions.
Although not the subject of this test program, the other forces acting on the turtle are thrust, weight and buoyancy. Fig. 3 shows the thrust vector parallel to the animal’s longitudinal axis. The turtle produces thrust by moving its front flippers in a power stroke that imitates a bird’s propulsive mode (Walker, 1971). Weight W is expressed as W=mg and buoyancy B is expressed as B=ρgv, where m is the mass of the animal (kg), g is the gravitational constant (9.81 m s−2), ρis the density of sea water (1025 kg m−3) and v is the volume of sea water (m3) displaced by the turtle. The buoyant force acts at the center of the displaced water volume.
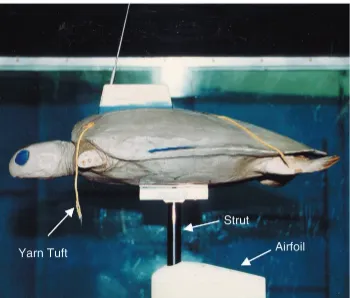
Test facility, instrumentation and scaling considerations Testing was conducted in the recirculating low-speed wind tunnel at the US Naval Academy. The test section is rectangular, 137 cm wide, 96 cm high and 236 cm long. The freestream turbulence level within the test section is 0.7 % of the mean air speed. Fig. 4 is a photograph of the model mounted on the three-component balance, which is shrouded within a low-drag airfoil and located directly under the center of mass of the model. The attachment mechanism was a split-shaft design that measured pitch moment as the difference between the vertical forces imparted on the two halves of the shaft assembly. The difference in forces was converted to a pitch moment and referenced to the center of mass 8.5 cm above the balance attachment point. The balance system was designed for a maximum 400 N drag, 823 N lift and 95 N m pitch moment. The load transducer had a combined error, Fcombined, of less than 0.025 % of the maximum. The load resolution was 0.067 N. An error analysis was performed on the force and moment data following procedures described by Coleman and Steele (1989).
Using Reynolds scaling, the data collected in the wind
13.7 6.6
[image:3.609.317.561.78.209.2]4.4
Fig. 2. Diagram of the Telonics ST-6 satellite transmitter. All dimensions are in centimeters.
Buoyancy
Center of mass Center
of volume
Lift
Drag
Longitudinal axis
Weight
Thrust Pitch
moment
Angle of attack
Relative fluid velocity
[image:3.609.55.290.539.714.2]tunnel were equated with the forces and moments acting on the turtle in water. The procedure involves testing the model at a particular air speed and converting the force and moment data to dimensionless coefficients. The scaling principle states that the aerodynamic coefficients are identical to those obtained by testing in water at the same Reynolds number, Re=Vl/ν, where
V is the speed, l is the carapace length, and νis the kinematic
viscosity of the fluid. The three approximate air speeds used in the wind tunnel were 8, 30 and 61 m s−1. They correspond to speeds in water of 0.5, 2.1 and 4.1 m s−1, assuming a kinematic viscosity of 9.3×10⁻⁷m2s−1 for sea water at 25 °C. It is important to note that Reynolds scaling ignores surface interaction effects. This means that the wind tunnel data apply to a turtle swimming at sufficient depth to avoid wave-making drag caused by interaction with the water surface.
Data collection and reduction
Data were collected for two configurations: the turtle model with rear flippers but no front flippers, and the same model with the addition of the transmitter (Fig. 4). The front flippers were excluded because they are used mainly for propulsion, and their drag contribution cannot be accurately simulated in a static configuration.
Drag, lift and pitch moment were measured for the three speeds and at angles of attack of −6 to 20 °, in increments of 2 ° (see Fig. 3 for sign conventions). In addition to the force and moment data, some general observations were made during the course of the tests. Two 13 cm yarn tufts were attached to the front and back of the carapace (Fig. 4). These
flow indicators provided insight into the characteristics of the shell boundary layer as the model changed configuration, speed and angle of attack.
The force and moment data were transformed into a more useful, dimensionless form. The equations to accomplish this task are as follows:
where q is dynamic pressure (q=GρV2), Sfront is frontal area (398 cm2),ρis air density, Splanis planform area (1517 cm2), V is wind tunnel air speed, l is carapace length (47.8 cm), CD is the dimensionless drag coefficient, CLis the dimensionless lift coefficient, CMis the dimensionless pitch coefficient, D is drag, L is lift and M is pitch moment.
For each model configuration, the coefficients of drag, lift and pitch moment were calculated for the range of test speeds and angles. Aerodynamic coefficients with the subscript ‘BF’ refer to the baseline model (body–flippers), and coefficients with the subscript ‘BFT’ refer to the model with the transmitter. The transmitter drag coefficient CD,tag is the
CM = –––––– ,M
qlSplan
(3) CL = ––––– ,qSL
plan (2)
CD = ––––– ,qSD
[image:4.609.212.562.71.369.2]front (1)
difference between the CDvalues with and without the device, referencing the coefficient to the transmitter frontal area:
where Stagis the ST-6 frontal area (25.7 cm2). Equation 4 gives the transmitter drag coefficient in the presence of the turtle body, which is analogous to the procedure used by Obrecht et al. (1988) to determine the drag of transmitters attached to birds.
Results
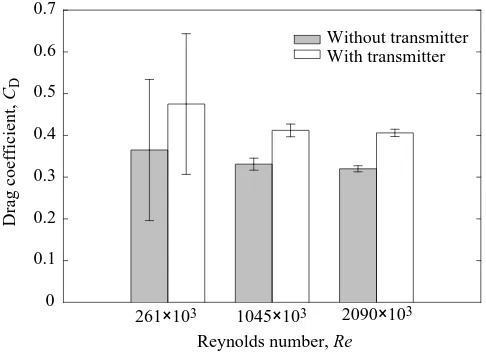
The drag coefficient at zero angle of attack (α) is relatively insensitive to Reynolds number variations over the speed range tested (Fig. 5). The baseline configuration, consisting of the body and rear flippers, has an average drag coefficient of 0.339 at α=0 °. With the transmitter, the average CDincreases by 27 % to 0.431. Fig. 5 shows evidence of a small reduction in CD with increasing Reynolds number; however, this variation is masked by measurement uncertainty at the lowest test speed. Substituting the average drag coefficients into equation 4 gives CD,tag=1.4 for the ST-6 transmitter at α=0 °. Obrecht et al. (1988) report a maximum CD,tagof 0.72 for rectangular box transmitters. The higher drag of our unit may be related to the sharp corners along the front and rear edges of the transmitter, and the 14 cm long antenna oriented 75 ° above the horizontal. A drag coefficient of 1.4 indicates fully separated flow around the unit.
The effects of angle of attack on the drag, lift and pitch moment coefficients are shown in Figs 6–8. A turtle will maintain a small angle when swimming in a straight line in still water. When maneuvering to catch prey or to avoid predators, the angle of attack can become large for a brief period as the turtle changes direction. Therefore, when reviewing Figs 6–8, the data near α=0 ° are representative of normal swimming motions. Because the coefficients showed
minimal variation with Reynolds number, the data are presented for the highest Re of 2090×103. The force and moment measurements are largest and, therefore, most accurate at the highest test speed.
The drag data for both models vary nonlinearly with angle of attack (Fig. 6). The nonlinearity is caused by an induced drag component associated with the lift of the turtle’s body and rear flippers. The effect of the transmitter is to shift the drag curve of the baseline model upwards without changing its shape. As a result, the drag coefficient is increased at all angles tested, with a maximum increase of 30 % at α=2 °. The transmitter drag coefficient is 1.5 at this angle.
The transmitter causes a reduction in the lift coefficient of less than 10 % (Fig. 7). No evidence of stall is apparent up to the highest test angle of 20 °. The body and rear flippers act as low-aspect-ratio lifting surfaces, making them less susceptible to stall than higher-aspect-ratio fins, such as the front flippers used for propulsion. Another feature of the lift data is the small negative value of CL at zero angle of attack. A negative value is unexpected, given the positive camber of the turtle’s carapace, which should produce positive lift at zero α. The negative CL may be due to rear flipper misalignment. Every effort was made to orient the fins at zero deflection during casting, but some misalignment is difficult to avoid. The negative lift observed at zero α could be explained by a flipper deflection of approximately −10 °. Each rear flipper was modeled as an uncambered wing with a planform area of 40 cm2, an aspect ratio of 2, and a lift slope based on a wing area of 0.045 per degree of fin deflection (Whicker and Fehlner, 1958). Neglecting body carryover lift, the two fins deflected by −10 ° produce a lift coefficient based on body frontal area of −0.023. This is close to the lift coefficient at α= 0 ° shown in Fig. 7.
Owing to its location above the animal’s center of mass, the transmitter causes a nose-up pitch moment at most angles (Fig.
CD,tag = (CD,BFT− CD,BF) ––––– ,
Sfront
(4) Stag
Reynolds number, Re
Drag coefficien
t,
CD
0 0.1 0.2 0.3 0.4 0.5 0.6 0.7
Without transmitter With transmitter
[image:5.609.319.563.73.251.2]261×103 1045×103 2090×103
Fig. 5. Measured drag coefficient (CD) versus Reynolds number (Re)
at zero angle of attack, corresponding to the turtle’s longitudinal axis aligned with the relative fluid velocity. Bars show two standard errors of the mean (N=10).
Angle of attack, α (degrees)
−10 −5 0 5 10 15 20 25
Drag coeff
icient,
CD
0.2 0.3 0.4 0.5 0.6 0.7 0.8 0.9
Without transmitter With transmitter
α
[image:5.609.53.296.512.689.2]V CD
Fig. 6. Measured drag coefficient (CD) versus angle of attack (α) at a
Reynolds number Re of 2090×103. Drag is parallel to the relative
8). The percentage change becomes large at negative angles, because the pitch moment of the baseline model approaches zero at −6 °. The transmitter increases CMby 42 % at α=−2 °, by 22 % at α=0 ° and by 11 % at α=2 °. The percentage increase decreases with increasing angle, eventually changing sign for α>15 °.
Another aspect of the data collection included flow indicators attached to the carapace during the tests (Fig. 4). The flow indicators revealed when the flow over the model became turbulent. For the baseline model, the aft flow indicators were streamlined until 16 ° angle of attack. Beyond this angle, the flow became turbulent along the shell. With the transmitter attached, the aft flow indicators were turbulent for all speeds and angles tested. The transmitter disturbed the air directly behind the unit and several centimeters to either side.
Discussion
Effects of the transmitter on migration energetics
The transmitter’s effect on migration energetics can be estimated from the drag data (Figs 5, 6). The special case of unaccelerated, straight-line swimming is considered here. The straight-line motion assumes a neutrally buoyant turtle traveling at constant depth in still water with no waves or currents. Given these restrictions, the thrust Ftrequired of the front flippers to maintain constant speed is expressed as:
where ρis the sea water density, V is the swimming speed, CD is the drag coefficient at zero angle of attack and Sfrontis the frontal area. This is a form of Newton’s equation for thrust–drag equilibrium, with the terms on the right-hand side of the equation collectively representing the drag on the
animal. The power output Pout required to maintain this equilibrium condition is simply the product of the thrust and the swimming speed (Pout=FtV).
The reduction in swimming speed caused by the transmitter can be estimated from equation 5 with the assumption of constant thrust. That is, if the turtle expends the same effort without trying to compensate for the added drag of the unit by increasing its power stroke, then the speed reduction is expressed as:
where the drag coefficients are those of the turtle with (CD,BFT) and without (CD,BF) the transmitter. This equation implies that the percentage speed reduction caused by the transmitter is constant if the drag coefficients are invariant with Reynolds number within the speed range VBFT to VBF. Using the average CD values at zero α (Fig. 5) gives
VBFT/VBF=√(0.339/0.431)=0.89, indicating a speed reduction of 11 % due to the transmitter. The added drag would therefore cause the turtle to swim at 1.8 km h−1for the same expenditure of energy that results in a speed of 2 km h−1without the unit.
With regard to metabolic power requirements, the total energy consumed during migration increases with the added travel time caused by the lower swimming speed. If X is the distance traveled on stored energy supplies, the travel time T is simply this distance divided by the turtle’s average swimming speed V over the migratory route. The increase in travel time can be estimated from equation 6 by substituting
V=X/T, giving the following ratio:
The average CDvalues from Fig. 5 give an increase of 13 %
–––– = –––––– . TBFT
TBF
CD,BFT
CD,BF
√
(7)–––– = –––––– , VBFT
VBF
CD,BF
CD,BFT
√
(6)Ft = –– 1 ρV2CDSfront , (5)
2
Angle of attack, α (degrees)
−10 −5 0 5 10 15 20 25
Lift co
efficient,
CL
−0.2
−0.1 0 0.1 0.2 0.3 0.4 0.5 0.6
Without transmitter With transmitter
α
[image:6.609.45.289.74.249.2]V CL
Fig. 7. Measured lift coefficient (CL) versus angle of attack (α) at a
Reynolds number Re of 2090×103. Lift is perpendicular to the
relative fluid velocity (V). Bars show two standard errors of the mean (N=10). α, angle of attack; V, fluid velocity.
Angle of attack, α (degrees)
−10 −5 0 5 10 15 20 25
Pitch moment coefficient,
CM
−0.02 0 0.02 0.04 0.06 0.08 0.10
Without transmitter With transmitter CM
α
[image:6.609.317.553.75.243.2]V
Fig. 8. Measured pitch moment coefficient (CM) versus angle of
attack (α) at a Reynolds number Re of 2090×103. Pitch moment is
in travel time. If the turtle’s power input is unchanged at the lower swimming speed, this value would also represent the percentage increase in metabolic energy during the migration. In reality, the energy increase will be higher owing to reduced aerobic efficiency at the lower swimming speed (Prange, 1976). If the turtle increases its power stroke to maintain its normal swimming speed, the migration time would be unchanged, but the energy demand would rise in direct proportion to the added drag of the transmitter. For the animal tested, the increase in metabolic energy consumption would more than double to 27 %. The true energy increase should lie somewhere between 13 and 27 %, depending on how the animal responds to the attachment of the transmitter. Swimming data for instrumented Adelie penguins (Pygoscelis
adeliae) support a value at the low end of this range (Culik et al. 1994). Unfortunately, no comparable data are available for
turtles. Timko and Kolz (1982) attempted to address this issue by releasing a loggerhead into a large aquarium and observing its behavior with a tethered transmitter. The turtle’s surface time nearly doubled, presumably because of the large buoyancy of the instrument, but the animal’s swimming behavior was not quantified. Studies are needed to determine whether the attachment of a transmitter causes the turtle to reduce its swimming speed to maintain a constant energy expenditure. The studies should consider the possibility that the transmitter elicits a temporary period of alarm, causing the turtle to swim faster than normal until it acclimates to the device.
Effects of the transmitter on maneuverability
In addition to its effect on swimming speed, the transmitter will reduce the turtle’s maneuverability by altering the
hydrodynamic lift and pitch moment. Lift is reduced by a small amount at most angles (Fig. 7), while the pitch moment is increased by a greater amount (Fig. 8). The increase in pitch moment, caused by the transmitter’s location above the center of mass, will force the turtle to deflect its rear flippers to maintain a level swimming motion. The use of the flippers in this manner will reduce their effectiveness for maneuvering, the primary function of these appendages (Walker, 1971). The deflected rear flippers will also generate more drag, further reducing swimming speed.
Example: green turtle migration in the Hawaiian Islands
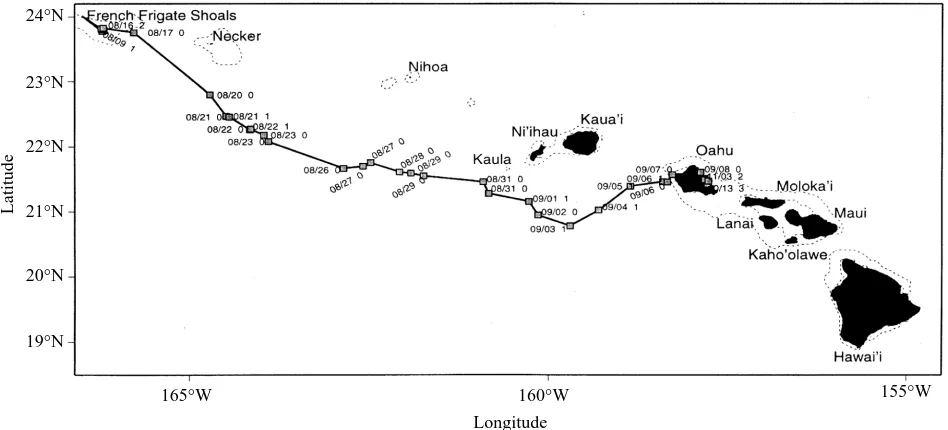
Balazs (1994) performed the first successful tracking of green turtles on their high-seas migrations. This example uses data for an adult female (87 cm shell length) tracked for 1130 km from the nesting area in the French Frigate Shoals (Hawaii) to the foraging grounds in Kaneohe Bay, Oahu (Fig. 9). During the 23 day transit, the turtle averaged 2.05 km h−1, and dive times ranged from 2.3 to 5.1 min, indicating that the animal was swimming near the surface. The tracking data were obtained from a Telonics ST-3 mounted on top of the shell.
Two key assumptions are required to apply our wind tunnel data to the tracking study. (1) The drag coefficient of the ST-3 attached to the adult turtle is assumed to be identical to that of the ST-6 on the juvenile (CD,tag=1.4 at α=0). This is reasonable given that the units are mounted at the same location on the shell and that both have the shape of a box. The dimensional drag of the ST-3 will be larger because of its increased frontal area. (2) The adult green turtle is assumed to be geometrically similar to the juvenile. This means that the two animals have identical drag coefficients
24°N
19°N 20°N 21°N 22°N 23°N
Latitude
160°W 155°W
165°W
[image:7.609.74.548.478.693.2]Longitude
Fig. 9. Post-nesting migration of a green turtle from French Frigate Shoals to Kaneohe Bay, Oahu in the Main Hawaiian Islands (Balazs, 1994). The turtle traveled 1130 km in 23 days at an average speed of 2.05 km h−1. A numerical code (0, 1, 2, 3) is shown next to the dates at various
and frontal areas that scale in proportion to the square of their shell lengths:
Substituting the known data for the adult and juvenile gives a frontal area of 1319 cm2for the adult. This information is used to compute the drag coefficient of the turtle with the ST-3, accounting for the transmitter’s frontal area as follows:
where CD,BF is the drag coefficient of turtle without a transmitter at zero angle of attack (CD,BF=0.339), CD,tagis the drag coefficient of the ST-3 (CD,tag=1.4), Sfront is the frontal area of the turtle (Sfront=1319 cm2) and Stagis the frontal area of the ST-3 (Stag=30 cm2). Substituting these values into equation 9 gives CD,BFT=0.371, representing a 9 % increase in drag relative to the unencumbered turtle. The drag coefficients with and without the transmitter are used to estimate the reduction in swimming speed and the associated increase in travel time. With the transmitter, the turtle required 23 days to reach its destination travelling at 2.05 km h−1. Without the transmitter, the turtle would have reached its destination in 22 days (equation 7) travelling at 2.14 km h−1 (equation 6). The transmitter therefore increased the travel time by 4.6 % and reduced the swimming speed by 4.4 %. Metabolic energy demand due to the transmitter increases in direct proportion to the added travel time, assuming that the turtle’s thrust and aerobic efficiency are unchanged. If the turtle had increased its power stroke to maintain its normal migratory speed, the transmitter would have increased the metabolic energy demand by 9 %.
These estimates are based on a two-dimensional picture of the migratory path. The absence of a dive profile means that the turtle’s true average speed was higher than the calculated value of 2.05 km h−1, which ignores vertical movement during dives and deviations from straight-line motion between satellite fixes. Errors could occur in the above calculations if the true speed was outside the Reynolds number range of the drag data. Fortunately, this appears not to be the case because, at 2.05 km h−1, the turtle was swimming at a Reynolds number of only 530×103. The true speed could be almost four times this value and still fall within the tested range of 261×103<Re<2090×103. Nevertheless, there is a need for data on dive patterns during migrations. Such information can provide insight into whether the turtle seeks a favorable depth to lower drag and thus minimize energy consumption. Swimming on the surface entails high energy costs resulting from the production of a wave train (Prange, 1976). The turtle can minimize wave drag by swimming at a depth corresponding to a few body thicknesses below the calm water surface (Gertler, 1950; Hoerner, 1965). The presence of a seaway may force the turtle deeper to avoid wave-induced motions that could increase drag. Recent studies are beginning
to provide a three-dimensional picture of swimming behavior (Hochscheid et al. 1998; Standora et al. 1998).
This example shows that an unstreamlined ST-3 has a modest effect on the migration energetics of an adult green turtle. Transmitter drag becomes more significant for tracking studies involving small adults and juveniles. Design guidelines are presented below to minimize adverse forces and moments caused by the transmitter.
Transmitter design guidelines
The rectangular shape of the tested transmitter is typical of satellite tags used in sea turtle telemetry. The shape is not optimal because it generates significant turbulence and flow separation, resulting in the large increase in drag shown in Figs 5 and 6. The location of the device on top of the shell exacerbates the flow disturbance. However, mounting the unit towards the rear of the animal, as in penguin tracking (Bannasch et al. 1994), could prevent the salt-water switch from activating when the turtle surfaces for air.
The drag of the transmitter can be reduced by streamlining its longitudinal cross section aligned with the swimming direction. This is achieved by attaching fairings to eliminate sharp corners that cause flow separation and increased drag. Obrecht et al. (1988) showed that fairings can reduce transmitter drag by approximately one-third compared with an unfaired rectangular box. The teardrop shape of the faired unit of Obrecht et al. (1988) is similar to an aircraft cockpit. In fact, from a fluid mechanics viewpoint, a cockpit and satellite transmitter both represent a bump or ‘perturbation’ on an otherwise smooth body. Robinson and Delano (1942) tested a family of aircraft cockpits to identify geometries with minimum drag. They found that the optimum tail fairing had a length/height (L/H) ratio of 4. Progressively reduced effectiveness was achieved as the tail was shortened, and very little drag reduction was achieved for L/H<2. The tail fairing used by Obrecht et al. (1988) appears to be at the low end of the acceptable range. The selected fairing must balance the competing needs of low drag and reasonable size. The longest fairing, while hydrodynamically optimal, may not be practical for use on smaller turtles.
A tail fairing alone is insufficient to minimize the drag of the transmitter. The cockpit study found that optimum tail length meant little if a non-optimal nose section was used. Ideally, the nose should have a fairing similar to that of the tail, but this would interfere with operation of the salt-water switch (Fig. 2). In lieu of a nose fairing, a compromise measure is to round the sharp corner at the front of the device. The corner radius should be at least one-quarter of the transmitter’s height. Additionally, the antenna should be oriented at a small angle above the horizontal, preferably less than 45 ° to minimize its drag contribution.
The weight of the transmitter, while insignificant relative to the drag force, should be adjusted to achieve neutral buoyancy in sea water. This will ensure that the transmitter does not alter the turtle’s submerged weight. If necessary, the unit could be designed with a small negative buoyancy with minimal adverse effect on the animal. In this way, when the transmitter
CD,BFT = CD,BF + CD,tag ––––– , (9)
Stag
Sfront
––––––– = ––––––– .Sadult Sjuvenile
ladult
ljuvenile
(
)
2detaches, it will sink to the bottom rather than floating to the surface and sending spurious signals.
These guidelines are applicable to existing Telonics-type transmitters. It would be preferable to redesign the housing into a teardrop shape. This would remove the need for fairings and produce a smaller unit, because all the internal volume could be used to contain the electronics. A new housing may also allow the use of an impact-resistant antenna. In recent tracking studies of adult green turtles, transmissions to the Argos satellite system stopped long before the anticipated battery life of the transmitter (G. Balazs, personal communication). It is believed that the whip antenna was damaged by impact with coral outcroppings. There are a host of low-profile antennae that might be used in place of the whip. For example, a helix antenna measuring only 3.8 cm could be integrated within the protective housing of the transmitter. Low-profile antennae such as the helix lack the radio frequency performance of the whip and are more susceptible to wave splash, but the Argos system has proved itself to be extremely robust and should be capable of compensating for reduced antenna performance. Furthermore, the transmitter drag could be minimized by integrating the antenna within a streamlined housing.
This study was supported by the Coastal Systems Station and the US Naval Academy. Beth Morford (Florida Department of Environmental Protection) supplied the turtle carcass, Stanley Tomkiewicz Jr (Telonics, Inc.) provided information on the transmitter tested and Denise Ellis (National Marine Fisheries Service, Honolulu) prepared the migration map in Fig. 9. The skilled technicians of the Naval Academy Technical Support Division built the wind tunnel model. We benefited from discussions with Jeanette Wyneken (Florida Atlantic University), Barbara Schroeder (NMFS, Silver Spring), Maurice Renaud (NMFS, Galveston), Alan Bolten (University of Florida), Donna Shaver (Texas A&M University), David Breed (CSS, Panama City) and Richard Byles. The primary author is particularly grateful to George Balazs (NMFS, Honolulu) for many helpful discussions and for encouraging the publication of this work.
References
BALAZS, G. H. (1994). Homeward bound: satellite tracking of Hawaiian green turtles from nesting beaches to foraging pastures. In Proceedings of the 13th Annual Symposium on Sea Turtle Biology and Conservation (ed. B. A. Schroeder and B. E. Witherington). NOAA Technical Memo. US Department of Commerce NMFS-SEFSC-341, pp. 205–208.
BANNASCH, R., WILSON, R. P. ANDCULIK, B. (1994). Hydrodynamic aspects of design and attachment of a back-mounted device in penguins. J. exp. Biol. 194, 83–96.
CARR, A. (1984). The Sea Turtle. So Excellent a Fish. Austin:
University of Texas Press.
COLEMAN, H. W. AND STEELE, W. G. (1989). Experimentation and
Uncertainty Analysis for Engineers. John Wiley & Sons, Inc.
CULIK, B. M., BANNASCH, R. AND WILSON, R. P. (1994). External devices on penguins: how important is shape? Mar. Biol. 118, 353–357.
DIZON, A. E. AND BALAZS, G. H. (1982). Radio telemetry of
Hawaiian green turtles at their breeding colony. Mar. Fish. Rev. 44, 13–20.
GERTLER, M. (1950). Resistance experiments on a systematic series of streamlined bodies of revolution – for application to the design of high-speed submarines. Navy Department, The David W. Taylor Model Basin, Washington DC. Report no. C-297. Declassified on 4 October 1982.
HOCHSCHEID, S., GODLEY, B. J., BRODERICK, A. C. ANDWILSON, R. P.
(1998). An investigation of green turtle inter-nesting behaviour in the eastern Mediterranean using data-logging devices. In Proceedings of the 18th International Sea Turtle Symposium (in press).
HOERNER, S. F. (1965). Fluid Dynamic Drag. Published by the author. LOGAN, P. AND MORREALE, S. J. (1994). Hydrodynamic drag
characteristics of juvenile L. kempii, C. mydas and C. caretta. In Proceeding of the 13th Annual Symposium on Sea Turtle Biology and Conservation (ed. B. A. Schroeder and B. E. Witherington). NOAA Technical Memo. US Department of Commerce NMFS-SEFSC-341, pp. 248–252.
MILSOM, W. K. (1975). Development of buoyancy control in juvenile
Atlantic loggerhead turtles, Caretta c. caretta. Copeia 1975, 758–762.
OBRECHT, H. H., PENNYCUICK, C. J. ANDFULLER, M. R. (1988). Wind tunnel experiments to assess the effect of back-mounted radio transmitters on bird body drag. J. exp. Biol. 135, 265–273. PAPI, F., LUSCHI, P., CROSIO, E. ANDHUGHES, G. R. (1997). Satellite
tracking experiments on the navigational ability and migratory behaviour of the loggerhead turtle Caretta caretta. Mar. Biol. 129, 215–220.
PRANGE, H. D. (1976). Energetics of swimming of a sea turtle. J. exp.
Biol. 64, 1–12.
RENAUD, M. L. (1995). Movements and submergence patterns of
Kemp’s Ridley turtles (Lepidochelys kempii). J. Herpetol. 29, 370–374.
ROBINSON, R. G. ANDDELANO, J. B. (1942). An investigation of the drag of windshields in the 8-foot high-speed wind tunnel. National Advisory Committee for Aeronautics Report no. 730.
STANDORA, E. A., MORREALE, S. J., SPOTILA, J. R. ANDPALADINO, F.
V. (1998). Where do turtles swim when they swim? In Proceedings of the 18th International Sea Turtle Symposium (in press). STONEBURNER, D. L. (1982). Satellite telemetry of loggerhead
sea turtle movement in the Georgia Bight. Copeia 1982, 400–408.
TIMKO, R. E. ANDKOLZ, A. L. (1982). Satellite sea turtle tracking.
Mar. Fish. Rev. 44, 19–24.
WALKER, W. F. (1971). Swimming in sea turtles of the family
Cheloniidae. Copeia 1971, 229–233.
WHICKER, L. F. AND FEHLNER, L. F. (1958). Free-stream
characteristics of a family of low-aspect-ratio, all-movable control surfaces for application to ship design. Navy Department, The David W. Taylor Model Basin, Washington DC. Report no. 933.