Printed in Great Britain © The Company of Biologists Limited 1990
BITE-TO-BITE VARIATION OF MUSCULAR ACTIVITY IN
CATS
BY CARL GANS1, GERARD C. GORNIAK2 AND WILLIAM K. MORGAN1
1
Department of Biology, The University of Michigan, Ann Arbor, MI 48109-1048, USA and 2Program in Medical Sciences, Florida State University, Tallahassee, FL 32306-4051, USA
Accepted 12 March 1990
Summary
Changes in electromyographic (EMG) activity between successive bites in the jaw- closing muscles of cats are described for the reduction of food with different textures. Plots of these data suggest, and statistics confirm, that one cannot predict the magnitude of EMG activity from one bite to the next, but that predicting the direction of change in EMG activity (i.e. increases or decreases) may be possible, given the relative magnitude of a bite. The patterns observed also show that the degree of variability between masticatory cycles differs among the jaw-closing muscles and with food texture. These patterns of muscle activity are related to the neural control of jaw movements.
Introduction
Mastication is a rhythmic activity and its open-close or open-close-cut (crush, grind, mince) movements are sometimes claimed to be steered by the action of a pattern generator (Dubner and Kawamura, 1971; Thexton etal. 1980; Jiich etal. 1984; Byrd, 1985). However, the particle size and texture of the food change during mastication and the position of the bolus keeps shifting relative to the upper and lower tooth rows (and to those of the working and balancing sides). These changes are reflected in jaw movements, in the activity of the mandibular muscles and in the forces they generate (Gans et al. 1978; Hiiemae, 1978; Thexton et al. 1980; Fish and Mendel, 1982; Gorniak, 1985). Furthermore, the activation times and activity patterns of the adductor muscles change between bites in an irregular manner (Gorniak and Gans, 1980), suggesting that the extent of cyclic stereotypy may differ among muscles as well as with the texture and size of the food. The variability thus generated poses problems, both for the standardization of masticatory cycles and their associated muscular activity and for testing the reality of the supposedly stereotyped motor pattern.
This problem is particularly difficult in those mammals that show complex jaw
2 C. G A N S , G . C. GORNIAK A N D W . M O R G A N
movements; variability produced by changes in movement and by changes in force production are difficult to separate and study independently. In contrast, cats show relatively simple closing movements of the lower jaw that limit variation, although their tongue can move the food from the working to the balancing side of the mouth between bites. Hence, the system allows study of variability in force production in a masticatory system with limited degrees of freedom.
The present study compares several parameters of electromyographic (EMG) activity per bite among the adductor muscles of cats chewing foods of different textures. The purpose of this study was to characterize the nature of bite-to-bite variability, to test the extent to which this reflects the type of food, and to establish the possibility of predicting EMG activity from one bite to the next.
Materials and methods
The data base for this study derives from the control specimens utilized for various studies of mastication in cats Felis catus (Gorniak and Gans, 1980). Electromyograms (EMGs) were recorded from the anterior and posterior tempor-alis, superficial and deep masseter and zygomaticomandibularis of five adult cats fed equivalent-sized chunks of cooked and raw beef and cooked chicken (see Loeb and Gans, 1986, for a justification of EMG and analytical techniques). The foods used differ in compressive stresses (3.04±0.32xl02Ncm~2 for raw beef; 1.93±0.43xl02Ncm"2 for cooked beef; Gorniak and Gans, 1980). For implan-tation of the standardized, 0.007-mm Teflon-coated, stainless-steel bipolar elec-trodes with 2-mm bare tips, the animals were anesthetized with ketamine hydrochloride (Vetalar, 22mgkg~1). The electrodes were passed subcutaneously to the back of the animal and there soldered to a miniconnector linking them, via Tektronix 122 and 26A2 differential preamplifiers, to a 117-DC Gould Acudata amplifier and then to a Honeywell 5600 medium-bandpass multi-channel tape recorder. An eight-channel Gould chart recorder provided a continuous record. Jaw movements were recorded at 24frames s- 1 with a 16-mm movie camera, with the signal from the moving shutter stored on tape in parallel with the EMG data (see Gorniak and Gans, 1980, for a detailed description of equipment and procedures and the changes of the EMGs during the phases of a chewing cycle).
were used to determine whether the muscles were on the active or balancing side and these were analyzed separately. Data from right and left muscles were not pooled, but each right muscle and each left muscle was treated independently.
Cats have a simple food-reduction cycle, with the mouth opening and closing in a pattern showing little propalinear or lateral shift of the mandible. In particular, the last portion of the closing movement is constrained by the interlocking of the canines (Gorniak and Gans, 1980, Fig. 3). A reduction sequence begins as food is picked up and continues to final swallowing. Sequences for different food types vary in (among other factors) the number of cycles per chunk from ingestion to swallowing (30±4.35 for raw beef; 19±2.75 for cooked beef), in the number of lateral food transfers.and in the times to full closure (Gorniak and Gans, 1980; Table 1).
This report presents 98 reduction sequences from five cats, representing a total of 2198 bites. With the exception of the anterior temporalis and reduction of cooked beef (73 bites each for right and left sides), a minimum of 120 bites and five reduction sequences were examined for each of the muscles on each side for each food type. The mean amplitude per chewing bite and the spike-times-mean amplitude values per chewing bite were plotted for each muscle and each food type, as were the differences in these measurements between successive bites of a sequence.
Because the bites performed by the cats are separated by a silent (inactive) period on the electromyographic traces, and because an interval associated with each bite is characterized by a burst of activity, we do not report the time sequence by spectral analysis or ARIMA modelling, as this would only provide information on the length of bite and interbite intervals as a function of other experimental conditions.
4 C. G A N S , G. C. GORNIAK AND W. MORGAN
Results General
Figs 1-5 illustrate the mean amplitude per chewing bite, mean amplitude differences per bite, times-mean amplitude per chewing bite and spike-times-mean amplitude difference per bite for each muscle and for two food types. The trends illustrated are representative of those for other animals, other food types and other feeding sequences and agree with previous studies documenting the repeatability of these procedures (Gans and Gorniak, 1980; Lauder and Shaffer, 1985). For the anterior and posterior temporalis and the superficial masseter, graphs of mean amplitude per bite are very similar to those obtained for spike-times-mean amplitude per bite. As spike-times-mean amplitude values appear to correlate best with the force generated by a muscle (Beach et al. 1982; Lauder and Shaffer, 1985), the descriptions for these muscles refer to the spike-times-mean amplitude values unless otherwise specified. For the deep masseter and zygomaticomandibularis, graphs of mean amplitude per bite and spike-times-mean amplitude per bite differ noticeably for the reduction of cooked beef. Thus, characterization of successive bite patterns for these muscles utilizes both parameters.
Bite-to-bite prediction of EMG (Tables 1, 2 and 3)
[image:4.451.42.414.433.544.2]The magnitude of changes to be expected between successive bites is shown in Table 1. Here the change of EMG parameter has been determined as the rise to the maximum value in the sequence and the drop from it. Also given is the change in these values between the middle and the end of sequences. The data are
Table 1. Percentage change in spike-times-mean amplitude for the working-side jaw-closing muscle when cats chew cooked and raw beef
Inter-bite Cooked beef Raw beef change during Percentage Percentage Percentage Percentage middle-end Muscle increase decrease increase decrease of sequence
Posterior temporalis Anterior temporalis Superficial masseter Deep masseter
Zygomaticomandibularis
64±22.1 66±20.2 65±15.9 64±14.3 . 44±5.5
52±32.2 65±18.9 61±21.9 61±23.2 66±22.6
90±12.6 80±18.1 82±20.9 42±23.7 59±32.3
56±18.4 63±25.7 70±22.3 34±22.3 50±22.0
14+11. 17±13. 14±8.5 21±16. 28±22.
1 4 6 9
The percentage increase is calculated from the difference in magnitude between the bite showing peak levels of activity and the one immediately preceding it. The percentage decrease is calculated from the difference between the peak activity and the bite that followed. For each reduction sequence the largest difference between two successive bites was set at 100 %, and the remaining differences between bites were normalized to this value.
For each muscle shown, the averages are calculated from data pooled for three reduction sequences (number of cats=5).
normalized so that the greatest difference observed was taken as 100%. The standard deviations are enormous, indicating substantial variability in all these values.
[image:5.451.72.410.278.576.2]The above analyses describe general trends extended over a number of bites, as also seen in the figures. However, a key question remaining is the extent to which the EMG pattern recorded in any one bite predicts that of the next one. This was tested by analyzing the EMG data with a Friedman two-way analysis of variance. Comparisons were run separately for the several EMG parameters for each cat, muscle, side on which chewing occurred and food type. To search for any possible regularity, we ran separate tests for muscle activities within the first 10 and the last 10 bites of chewing sequences (Tables 2, 3). Neither provided significant predicta-bility. Of 36 tests not matched for food type, only one suggested coincidence in the sequencing of the bites below the 5 % level and, of 90 tests matched for food, three (all in one group and for the last 10 bites) suggested coincidence at the 1 % level.
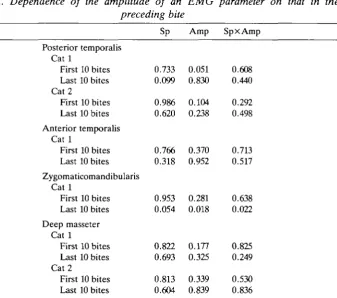
Table 2. Dependence of the amplitude of an EMG parameter on that in the preceding bite
Sp Amp SpxAmp
Posterior temporahs Cat 1
First 10 bites Last 10 bites Cat 2
First 10 bites Last 10 bites Anterior temporalis
Cat 1
First 10 bites Last 10 bites Zygomaticomandibularis
Cat 1
First 10 bites Last 10 bites Deep masseter
Cat 1
First 10 bites Last 10 bites Cat 2
First 10 bites Last 10 bites
0.733 0.099 0.986 0.620 0.766 0.318 0.953 0.054 0.822 0.693 0.813 0.604 0.051 0.830 0.104 0.238 0.370 0.952 0.281 0.018 0.177 0.325 0.339 0.839 0.608 0.440 0.292 0.498 0.713 0.517 0.638 0.022 0.825 0.249 0.530 0.836
Probability of prediction from Friedman two-way analysis of variance (0=highly predictable, l=random).
Reduction sequences for each muscle matched for cat and jaw side only. Degrees of freedom, 9.
6 C. GANS, G. CL GORNIAK AND W. MORGAN
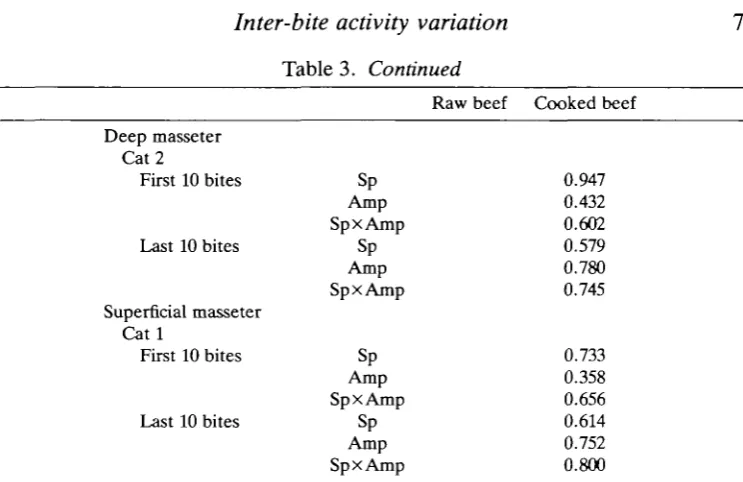
Table 3. Dependence of amplitude of EMG parameter on that in the preceding bite
Posterior temporalis Cat 1
First 10 bites
Last 10 bites
Cat 2
First 10 bites
Last 10 bites
Cat 5
First 10 bites
Last 10 bites
Anterior temporalis Cat 1
First 10 bites
Last 10 bites
Zygomaticomandibularis Cat 1
First 10 bites
Last 10 bites
Deep masseter Cat 1
First 10 bites
Last 10 bites
Sp Amp SpxAmp Sp Amp SpxAmp Sp Amp SpxAmp Sp Amp SpxAmp Sp Amp SpxAmp Sp Amp SpxAmp Sp Amp SpxAmp Sp Amp
Sp x Amp
Table 3. Continued
Deep masseter Cat 2
First 10 bites
Last 10 bites
Superficial masseter C a t l
First 10 bites
Last 10 bites
Sp Amp
SpxAmp
Sp Amp
SpxAmp
Sp Amp
SpxAmp
Sp Amp
SpxAmp
Raw beef Cooked beef
0.947 0.432 0.602 0.579 0.780 0.745
0.733 0.358 0.656 0.614 0.752 0.800
Probability of prediction from Friedman two-way analysis of variance (0=highly predictable, 1=random).
Reduction sequences for each muscle matched for cat, jaw side and food type. Degrees of freedom, 9.
Sp, number of spikes during a bite; Amp, mean amplitude during a bite.
However, these are the numbers of values that should yield a significant result, even if the rankings showed no pattern. Hence, the EMG level of the muscles cannot be predicted between successive bites.
Curiously, the probability of prediction increased for spike number but decreased for EMG amplitude from the first 10 to the last 10 bites. We also noted that the values for raw beef were least regular of all the sets tested.
Posterior temporalis
Fig. 1 shows changes in the activity level of the posterior temporalis. Plots of successive bites disclose an irregular series of peaks and valleys throughout the reduction sequence of cooked beef. This very irregular pattern is composed of subsets of bites in which there are low valleys interspersed between subsets with relatively high and low peaks. The low-peak series of bites are those when the muscle is on the balancing side (B), and the high-peak series of successive bites correspond to times when the muscle is on the working side (W).
Spik
e x
amplitud
e
pe
r bit
e (xlfT
1 )
Spik
e x
amplitud
e
differenc
e pe
r bit
e (xNT
1 )
Amplitud
e differenc
e
pe
r bit
e
Amplitud
e pe
r bit
e
0
0
_
] I
.
I
1
Fig. 1. Felis catus. Graphs of mean amplitude per bite, mean amplitude difference per bite, spike-times-mean amplitude values per bite and spike-times-mean amplitude difference per bite for the posterior temporalis for cat 1 while masticating cooked and raw beef. All four graphs for cooked beef were derived from a single reduction sequence, as were the graphs for raw beef. W indicates working side and B indicates balancing side. The scales shown here are identical to those shown for Figs 2-5. For amplitude each unit equals 0.084 mV between the electrode tips.
for the working- and balancing-side muscles during most of the reduction sequence. The magnitude of the abrupt changes is evident when the differences in activity are plotted per chewing bite. Whenever the muscle is on the working side, one notes a substantial increase in activity (mean 60%) between the bite with a peak level of activity and the bite preceding it. The bite showing peak activity is then followed by one showing a large decrease in activity (mean 50 % ) . Relatively small differences in activity between bites seem to occur if the posterior temporalis is on the balancing side (mean 25 %) and if it is active near the end of a reduction sequence (mean 15%). In short, the changes in the magnitude of activity per chewing bite of the working-side posterior temporalis produce a very irregular pattern during the chewing of cooked beef; the activity of this muscle undergoes large changes from one bite to the next. These increases and decreases in mean amplitude between successive bites for both the working- and the balancing-side posterior temporales usually show a valley (V), peak (P), decrease (D) and valley (V) sequence. This sequence indicates that the working- and balancing-side muscles are generally active at a peak level during the same bite when cooked beef is reduced.
10
C. G A N S , G. C. GORNIAK AND W . M O R G A NFinally, we used autocorrelation analysis on the only two sequences (feeding on raw beef) which recorded muscle activity for both sides and had bite numbers large enough to make the technique valid. The summed spike-times-mean amplitude per bite values of the two sides showed values that could be classed as high, intermediate and low. The test of the longer series showed a small but significant negative autocorrelation with the same variable two bites in the future (r=0.33). This confirms that, under these circumstances, the summed bite values tended to be low two bites after they had been high.
Anterior temporalis
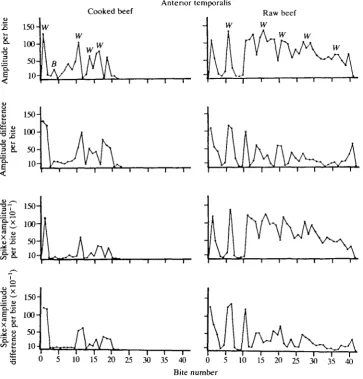
The plots for the anterior temporalis (Fig. 2) show a pattern of changing
Cooked beef
Anterior temporalis W
is a
11 8.
50-c"
[image:10.451.39.403.237.616.2]10-10 15 20 25 30 35 40 Bite number
magnitudes similar to that described for the posterior temporalis. The pattern is irregular during the reduction of cooked beef; high peaks occur when the muscle powers the working side and low peaks when it powers the balancing side. When the muscle is on the working side, activity increases by an average of 65 % between the bite showing peak activity and the one preceding it, and then decreases by an average of 65 % in the bite following that with peak activity. However, the sequence of increases and decreases in activity between bites usually differs from that of the posterior temporalis. For the working-side anterior temporales, a V, I, P, V sequence is usually seen. For the balancing side anterior temporales, the sequence is slightly different, usually V, I, I, P, V. This difference in the sequence indicates that the working- and balancing-side muscles are maximally active during different bites, the working-side muscle reaching a peak level one bite before the balancing-side muscle.
During the reduction of raw beef, the changes in mean amplitude displayed by the anterior temporalis also show a pattern similar to that of the posterior temporalis. The beginning of a reduction sequence is characterized by a high-peak, low-valley profile (i.e. by large changes in magnitude between successive bites). Later, there is a sudden transition to a pattern with relatively small changes in inter-bite magnitude (mean 17%). The overall activity level per bite of the anterior temporalis also decreases gradually from the middle to the end of the reduction sequence.
Superficial masseter
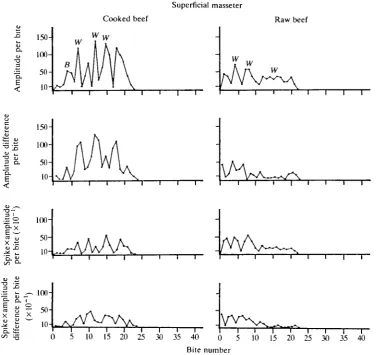
The bite-to-bite patterns exhibited by the superficial masseter (Fig. 3) for cooked and raw beef are similar to those described for the anterior and posterior temporales. When the superficial masseter is on the working side, mastication of cooked beef involves successive bites with relatively large increases (65%) and decreases (61 %) in activity preceding and following a bite of peak activity. The sequence for the working-side muscle shows a V, P or V, I, P pattern, followed by either a P, V or a P, D, V pattern (the V, I, P, D, V pattern is most common). When the muscle is on the balancing side, the magnitude of change between bites is less than on the working side, but the sequence of increases and decreases in activity is similar (V, I, P, D, V). The overall bite-to-bite pattern of the superficial masseter of the working side appears to be more regular than that of the anterior and posterior temporales.
Mastication of raw beef generates a valley-to-peak pattern at the beginning of a reduction sequence. The bites before and after those showing peak activity will increase by an average of 80 % and decrease by an average of 70 %, respectively. This initial pattern is then followed by a relatively flat profile during the middle and end of the sequence, with inter-bite changes averaging 1 3 % .
Deep masseter
12 C. G A N S , G. C. GORNIAK AND W. MORGAN
Superficial masseter
Raw beef
a
u a. •a
li
t
< 150- 1O0- 50-
10-Cooked beef
W w w \ K ,
A
f\hh
B A \ \ \ \ \ M I
AM/
I \
/ V 1/ \l i V \
• i I I 1 1 • 1 1
w. w
w
[image:12.451.38.415.74.429.2]0 5 10 15 20 25 30 35 40 0 5 10 15 20 25 30 35 40 Bite number
Fig. 3. Graphs for the superficial masseter of cat 1 masticating cooked and raw beef. Conventions as in Fig. 1.
of mean amplitude per chewing bite differ noticeably from those of the spike-times-mean amplitude per bite. However, during the reduction of raw beef, plots of mean amplitude per chewing bite and spike-times-mean amplitude per bite are similar.
&
100-Q.
<
•O 5
S O-"E. <
5s
V X>
'5. v
t o "•
3 -0
10-tig
CO I5 50"
10-Deep masseter Cooked beef
\A
[image:13.451.42.413.72.395.2]0 5 10 15 20 25 30 35 40 0 5 10 15 20 25 30 35 40 Bite number
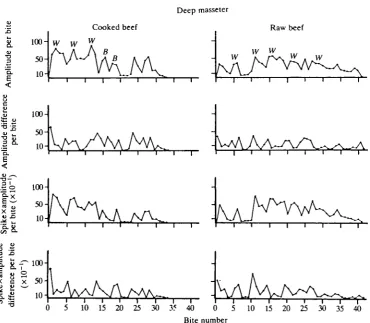
Fig. 4. Graphs for the deep masseter of cat 1 masticating cooked and raw beef. Conventions as in Fig. 1.
mean amplitude per chewing bite does not change noticeably; the pattern is then similar to that observed at the beginning and middle of a reduction sequence. On the working side, the sequence of increases and decreases in activity shows a V, I, P, D, D, V pattern. There is an average increase of 76% between a bite showing peak mean amplitude and that preceding it and an average decrease of 65 % between the peak and the next bite. For the balancing-side muscle, a similar sequence (V, I, P, D, D, V) is seen, as well as the sequence V, I, P, D, V. However, inter-bite differences for the balancing-side muscle average only 18%.
14 C. G A N S , G . C. GORNIAK AND W . M O R G A N
(mean 27%). For both the working- and the balancing-side deep masseter, the sequence of increases and decreases in activity is similar to those described for graphs of mean amplitude per chewing bite.
For mastication of raw beef, the plots of successive bites show a pattern similar to that described for the temporales and superficial masseter. However, the high-peak, low-valley pattern at the start of a reduction sequence is attenuated. The absolute differences between bites decrease during the middle and end of the reduction sequence. The inter-bite differences displayed by the deep masseter (mean 21 %) are greater than those of the temporales and superficial masseter.
Zygomaticomandibularis
During the reduction of cooked beef, the pattern seen in the zygomaticoman-dibularis (Fig. 5) for mean amplitude per chewing bite is quite different from that for spike-times-mean amplitude per bite. The pattern also differs from that observed in the superficial and deep masseters and the temporales.
The plots of the mean amplitude per chewing bite for the zygomaticomandibu-laris indicate a rapid increase (mean 73%) between the bite showing peak mean amplitude and the preceding one. The bite that follows then shows a rapid decrease (mean 77 % ) . This continues throughout most of the reduction process, such that a bite of low mean amplitude is generally followed by a bite of high mean amplitude. In contrast to the working-side temporales and superficial masseter, but like the working-side deep masseter, the magnitude of the low-mean amplitude bites (valleys) remains relatively high throughout, and the pattern resembles that seen during the reduction of raw beef. If the activity level per bite is compared between the working- and balancing-side zygomaticomandibulares, a rapidly increasing then decreasing sequence of bites is observed for both sides; however, the magnitude of activity per bite for the balancing-side muscle is less than that for the working side. In addition, the sequence of increases and decreases in activity differs between the muscles of the working and the balancing side. On the working side, a V, P or V, I, P pattern is seen. The peaks are then followed by either a Vor D, V pattern. On the balancing side, a V, P, Vpattern is the most common.
For mastication of cooked beef, plots of spike-times-mean amplitude per bite show less variation between bites than those of mean amplitude per bite. This difference reflects changes in the number of spikes per bite. Slight changes in spike number per bite are observed in the temporales and masseter pattern; however, the increases in the zygomaticomandibularis are pronounced.
pe
r
Amp
l
3 0 0
-Cooked beef
IV
Raw beef
w
2 5 0
2 0 0
-11 .
•o E
E <
150- 100- 50-
10-i 10-i 10-i r 10-i 10-i 10-i r i i i I i I r
a ° 2
X c X o o
—-1/5
'-6
1 5 0 - 100- 50-
10-i I r
0 5 10 15 20 25 30 35 40 0 5 10 15 20 25 30 35 40 Bite number
Fig. 5. Graphs for the zygomaticomandibularis of cat 1 masticating cooked and raw beef. Conventions as in Fig. 1.
Discussion
16 C. G A N S , G. C. GORNIAK AND W. M O R G A N
1986; Mongini etal 1986; Stohler, 1986; de Gueldre and de Vree, 1988; Nielsen and Miller, 1988). This variability has been attributed to changes in the texture and size of the bolus and to changes in the magnitude of the force generated by the muscles of the working or balancing side. The data from domestic cats in this study show that the level of muscular activity changes markedly between bites. The data suggest minimal probability of predicting the magnitude of the activity from one bite to the next.
Previous studies have indicated that the mean values of the EMGs reflect well the toughness of the food type (Gorniak and Gans, 1980). They also show that the mean EMG values fall during a mastication sequence. The present analysis indicates that the direction of change in activity for a sequence of successive bites can be predicted. In short, the muscles studied here do show some patterns of sequential increases and decreases of activity during multiple bites.
The commonest pattern is one in which a bite of low mean amplitude (valley) is followed by a bite of increasing mean amplitude (increase) and then one of peak mean amplitude (peak). This pattern was seen in all the working-side muscles studied as well as in the balancing-side posterior temporalis and superficial and deep masseters. A pattern in which a bite of low mean amplitude (valley) is followed immediately by a bite of peak mean amplitude (peak) was also seen for the working-side posterior temporalis, superficial masseter and zygomaticomandi-bularis, as well as for the balancing-side posterior temporalis and zygomaticoman-dibularis.
A bite of peak mean amplitude is followed by either of two common patterns. In the first pattern, it is followed by a bite of decreasing mean amplitude (decrease) and then by one of low mean amplitude (valley). This pattern is seen for the working-side posterior temporalis, superficial masseter and zygomaticomandibu-laris, as well as for the balancing-side posterior temporalis, superficial masseter and deep masseter. The second common pattern is one in which a bite of peak mean amplitude (peak) is followed by one of low mean amplitude (valley). This is seen for the working- and balancing-side anterior temporales and zygomaticoman-dibulares and the working-side superficial masseter. In a third pattern, seen only in the deep masseters of the working and balancing-side, a bite of peak mean amplitude (peak) is followed by two successive bites of decreasing mean amplitude and then by one of low mean amplitude.
The patterns observed in this study suggest predictability only of the relative direction in which mean amplitude changes (i.e. whether it increases or decreases) and not of the magnitude of those changes. Predictability also requires infor-mation about the magnitude of the starting level, relative to that of the series. Potentially similar patterns in other carnivores, as well as in herbivores, insecti-vores and omniinsecti-vores, should be documented before generalizing about predictabi-lity.
super-fidal masseter. In a previous study, the activity of neither of the former muscles correlated significantly with food texture, whereas that of the temporales and superficial masseter did (Gorniak and Gans, 1980). Furthermore, the percentage of slow and fatigue-resistant fibers in the former muscles is relatively higher than in the latter ones (Gorniak, 1986) and the former also show a close to normal angle of insertion. These structural differences are apparently reflected in the bite-to-bite variation (Burke, 1978; Herring et al. 1979; Buchthal and Schmalbruch, 1980; Gans, 1982).
The observed variability raises questions about simple models describing the control of the pattern of muscle activity. Traditional comments refer to feedback circuits controlling jaw opening (Dubner and Kawamura, 1971; Byrd, 1985) and it has been suggested that jaw opening is triggered when force development attains some set magnitude. However, these views are called into doubt because the level of EMG activity, and presumably the forces applied, differ with the toughness of the food (Gans and Gorniak, 1979). Furthermore, the degree of jaw opening and closing also changes irregularly during a reduction sequence, making it unlikely that the degree of displacement provides the mechanism triggering jaw opening. Certainly neither of these variables provides the trigger by itself. Nevertheless, it is unlikely that the observed variation in inter-bite activity is random.
The data suggest that each bite imposes a distinct task. The jaws open more widely than is necessary for the cusps to clear. Apparently, this portion of the mastication cycle (i.e. fast open through fast close in the current terminology) allows the tongue to change the quantity and position of food between the crushing teeth. This, in turn, provides a variable and poorly predictable resistance and the variable EMG pattern reflects this.
As the animal masticates at rates approaching 3 bites sT1 the nature of the bite control mechanism becomes of interest. The general correlation between tough-ness of food and EMG magnitude suggests that the overall EMG sequence cannot be random. It is possible that the animal integrates the rate of change of force generated as the tooth penetrates the food. In other words, should the high resistance at the beginning of food contact decrease rapidly, the change may, by itself, trigger jaw opening. However, if the food is tough and the teeth penetrate more slowly, it is possible that the magnitude of bite force provides an alternative triggering mechanism for opening.
18 C. G A N S , G . C. GORNIAK AND W . M O R G A N
that some of these cues serve to determine the general stimulation (EMG) level for subsequent bites.
An alternative hypothesis might be that the bites differ intrinsically. Some might be associated with reduction, others with repositioning or exploration. Such a classification of bites would correspond with the changes in mean amplitude per bite observed in this study. Those bites showing peak levels of activity would be involved with reduction (the cutting, crushing or grinding of food). The bites showing low-level activity (low-valley bites) would be involved with repositioning (the movement of food within the oral cavity). Finally, those bites showing intermediate levels of activity would be involved with exploration. They would immediately precede and follow a bite of peak mean amplitude and occur between a low valley and a bite of peak mean amplitude (designated above as increase and decrease bites) or as a high valley when food such as raw beef is reduced. Exploration bites might check the position and texture of the food and provide a signal that determines the strength of the next bite. If an exploratory bite followed a repositioning bite of low mean amplitude, it would indicate that the food was properly positioned and exceeded a certain resistance; a reducing bite of high mean amplitude would follow. An exploratory bite that followed a bite of peak mean amplitude would then re-check the condition of the food. If the food was markedly reduced, then a repositioning bite of low mean amplitude would follow. However, an exploratory bite which detected food still aligned and unreduced, would be followed by another reducing bite. This latter sequence would produce the high-valley pattern observed during reduction of raw beef.
The inter-bite variations observed in this study may be associated with the rate of change of forces during penetration of the teeth into the food. Alternatively, they may reflect intrinsically different types of bites or a combination of the two approaches. These questions obviously require further investigation. However, the present results suggest that simple, uninvolved pattern generators are unlikely to be acting in mastication.
We thank Peter Ward for developing the data array software, Dr Susan Herring for advice on references and Becky Thomas for typing the data into the computer. Dr Morton Brown helped with evaluation of the several kinds of statistical analyses. This study was supported by DHEW grant PHS-G-IROIDE05112-03, NSF grant G-BSR-850940 and a grant from the office of the UM Vice-President for Research. Mr William Morgan was a participant of the NSF program of Research Experience for undergraduates.
References
BEACH, J., GORNIAK, G. C. AND GANS, C. (1982). A method for quantifying electromyograms.
J. Biomech. 15, 611-617.
Box, G. E. P. AND JENKINS, G. M. (1976). Time Series Analysis: Forecasting and Control. Revised edn. San Francisco: Holden Day.
BURKE, R. E. (1978). Motor units: physiological/histochemical profiles, neural connectivity and functional specialization. Am. Zool. 18, 127-134.
BYRD, K. E. (1984). Masticatory movements and EMG activity following electrolytic lesions of the trigeminal motor nucleus in growing guinea pigs. Am. J. Orthod. 86, 146-161.
BYRD, K. E. (1985). Research in mammalian mastication. Am. Zool. 25, 365-374.
DE GUELDRE, G. AND DE VREE, F. (1988). Quantitative electromyography of the masticatory muscles of Pteropus giganteus (Megachiroptera). J. Morph. 196, 73-106.
DUBNER, R. AND KAWAMURA, Y. (1971). Oral-Facial Sensory and Motor Mechanisms. New York: Appleton-Century-Crofts.
FISH, D. R. AND MENDEL, F. C. (1982). Mandibular movement patterns relative to food types in common tree shrews (Tupaia glis). Am. J. phys. Anthr. 58, 255-269.
GANS, C. (1982). Fiber architecture and muscle functions. Exercise Sport Sci. Revs 10, 160-207.
GANS, C , DE VREE, F. AND GORNIAK, G. C. (1978). Analysis of mammalian masticatory mechanisms: progress and problems. Zbl. Vet. Med. C, Anat. Histol. Embryol. 7, 226-244.
GANS, C. AND GORNIAK, G. C. (1979). Concepts of muscle: an introduction to the intact animal. In Muscle Adaptation in the Craniofacial Region (ed. J. A. McNamara, Jr, and D. S. Carlson), pp. 1-16. Ann Arbor, MI: Center for Human Growth and Development, Monograph 8.
GANS, C. AND GORNIAK, G. C. (1980). Electromyograms are repeatable: precautions and limitations. Science 210, 795-797.
GORNIAK, G. C. (1985). Trends in the actions of mammalian masticatory muscles. Am. Zool. 25, 331-337.
GORNLAK, G. C. (1986). Correlation between histochemistry and muscle activity of jaw muscles in cats. J. appl. Physiol. 60, 1363-1400.
GORNIAK, G. C. AND GANS, C. (1980). Quantitative assay of electromyograms during mastication in domestic cats (Felis catus). J. Morph. 163, 253-281.
HERRING, S. W., GRIMM, A. F. AND GRIMM, B. R. (1979). Functional heterogeneity in a multipinnate muscle. Am. J. Anat. 154, 563-576.
HnEMAE, K. M. (1978). Mammalian mastication: a review of the activity of the jaw muscles and the movements they produce in chewing. In Development, Function and Evolution of Teeth (ed. P. M. Butler and K. A. Joysey), pp. 359-398. London: Academic Press.
JOCH, P. J. W., VON WILLIGEN, J. D., BROEKHUIJSEN, M. S. AND BALLINTUN, C. M. (1984). Masseter, digastric and omohyoidal responses from weak mechanical oral stimuli in the chewing rat. Brain Behav. Ecol. 25, 166-174.
LAUDER, G. V. AND SHAFFER, H. B. (1985). Functional morphology of the feeding mechanism in aquatic ambystomatid salamanders. J. Morph. 185, 297-326.
LOEB, G. E. AND GANS, C. (1986). Electromyography for Experimentalists. Chicago: The University of Chicago Press.
MEIRTE, D. (1986). Functioned morphologische Studie van het Kauwen bij de Afrikaanse Molrat Tachyoryctes splendens (Riippell). PhD dissertation, University of Antwerp.
MONGINI, F., TEMPIA-VALENTA, G. AND BENVEGNU, G. (1986). Computer-based assessment of habitual mastication. J. Prosthet. Dent. 55, 638-649.
NIELSEN, I. AND MILLER, A. J. (1988). Response patterns of craniomandibular muscles with and
without alterations in sensory feedback. J. Prosthet. Dent. 59, 352-362.
STOHLER, C. S. (1986). A comparative electromyographic and kinesiographic study of deliberate and habitual mastication in man. Archs oral Biol. 31, 669-678.