Creative Clusters
Economic Analysis of the Current Status and Future
Clustering Potential for the Crafts Industry in Ireland
Prepared for
The West Cork Development Partnership on behalf of a consortium of Local Development Companies, Ballyhoura Development Ltd, Wexford Development Ltd, Kilkenny LEADER
Partnership and South Tipperary Development Company under the LEADER element of the Rural Development Programme 2007-‐2013 in association with the Crafts Council of Ireland
Prepared by
www.indecon.ie
This project is supported by the West Cork Development Partnership Ltd. on behalf of the
Contents
Page
Executive Summary i
1 Introduction and Background 1
1.1 Introduction 1
1.2 Background to the Study 1
1.3 Scope of the Study 3
1.4 Methodology 3
1.5 Structure of Report 5
1.6 Acknowledgements 5
2 Employment in the Crafts Sector 6
2.1 Introduction 6
2.2 Nature of Employment in the Crafts Sector 6
2.3 Summary of Findings 11
3 Profile of the Crafts Industry 12
3.1 Introduction 12
3.2 Craft Makers and Enterprises in Ireland 12
3.3 Analysis of Sales and Sales Revenue in the Crafts Sector 17
3.4 Analysis of Expenditure on Raw Materials in the Crafts Sector 19
3.5 Outsourcing in Crafts 20
3.6 E-‐commerce 21
3.7 Product Development 25
3.8 Summary of Findings 26
4 Education and Skills in the Crafts Sector 27
4.1 Introduction 27
4.2 Number of Students Enrolled in Craft Courses 27
4.3 Education, Skills and Training Needs 31
4.4 Summary of Findings 35
5 Developing Craft Business 36
5.1 Introduction 36
5.2 Assessment of Current Craft Makers in Ireland 36
5.3 Collaboration in the Sector 45
5.4 Demand for Irish Crafts and Expectations for Future Growth 48
5.5 Crafts and Tourism 49
5.6 Summary of Findings 54
6 Recommended Strategies to Secure the Potential of the Crafts Sector 56
6.1 Introduction 56
6.2 Recommended Strategies 56
6.3 Summary of Recommendations 64
6.4 Concluding Comments 64
Annex 1 Work by CCoI and Five Partnership Companies 66
Annex 2 Details of the Strategic Fit of the Indecon Recommendations with Existing Work of CCoI 77
Annex 3 Details of the Strategic Fit of the Indecon Recommendations with Existing Work of Five
Partnership Companies 79
Table 1.1: Summary of Number of Responses to Indecon Surveys 4 Table 2.1: Trend Analysis of Irish Census of Population 2011 -‐ Labour Force in Detailed Craft related
Categories 6
Table 2.2: Breakdown of Irish Census of Population 2011, Number of People in the Labour force by
Counties in the Five Partner Regions by Detailed Craft related Occupation 7
Table 2.3: Analysis of Irish Census of Population 2011 -‐ Labour Force & Persons at Work in Detailed
Craft related Categories 8
Table 2.4: Breakdown of Persons Employed/Engaged in Craft in 2009 and 2012 ʹ Headcount 9
Table 2.5: Employment Estimates in Craft Enterprises -‐ Employing 3 or more 2012 10
Table 2.6: Overall Estimates of Employment in the Craft Sector 11
Table 3.1: Breakdown of CCoI Registered Craft Enterprises by County in the 12
Table 3.2: Selected Breakdown of Craft Enterprises by Crafts Industry in the of Republic of Ireland
2012 13
Table 3.3: Analysis of Craft Makers in the Five Partner Regions by Type of Craft 2012 14
Table 3.4: Number of Different Craft Categories that Makers from the Five Regions are Active in
2012 15
Table 3.5: Number of Different Craft Categories Makers from the Five Regions are Active in 2012 16 Table 3.6: Channels Through which Craft Makers in the Five Partner Regions Sell their Products
2012 17
Table 3.7: Breakdown of Sales Revenue Reported by Craft Makers 2012 19
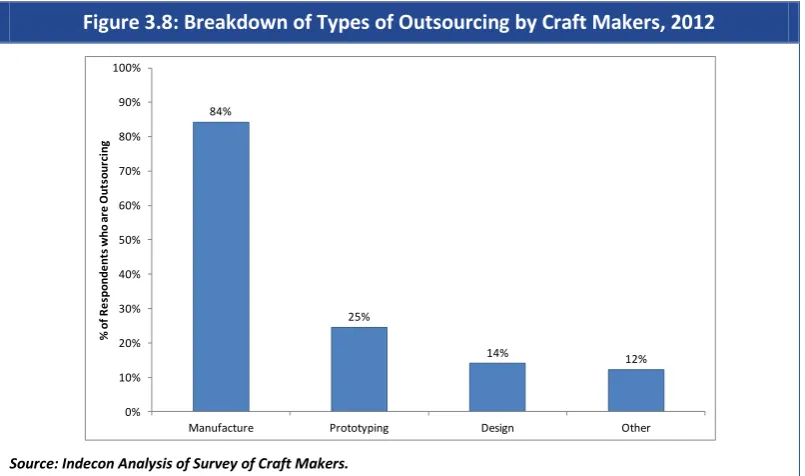
Table 3.8: % of Respondents who Are Outsourcing Part of the Design/Manufacture of their Products
or Other Outsourcing 20
Table 3.9: Proportion of Craft Makers with a Website for their Business 2012 21
Table 3.10: Craft Retailers who have a Website 2012 22
Table 3.11: Breakdown of Craft Makers by 2012 Sales Band and Website Functionality 23
Table 3.12: Breakdown of Craft Makers in the Five Partner Regions by Number of Craft Products
Introduced from 2010 -‐ 2012 25
Table 4.1: Full Time and Part Time Enrolments in Craft and Related Courses of Higher Education
Authority Funded Institutions 2012 27
Table 4.2: New Entrants to Higher Education Authority Funded Institutions 2012 28
Table 4.3: All Levels Awarded in Higher Education Authority Funded Institutions 2011 28
Table 4.4: Craft Related FETAC Major Awards by Award Title and Level 2010 & 2011 29
Table 4.5: 2012/13 NCAD Student Data -‐ Faculty of Design 29
Table 4.6: NCAD Students Studying at Masters Level by Specialist Area 2012/13 30
Table 4.7: Breakdown of Undergraduate NCAD Craft and Textile Design Students by Specialist Area
2012/13 30
Table 4.8: Demand and Shortage Indicators for Selected Craft and Related Occupations 2012 31
Table 4.9: Opinions of Craft Educators on How Well Full-‐time and Part-‐time Crafts and Craft related courses run by Irish Educational Insititutions Prepare Students for Work in the Crafts
Sector in Terms of (i) Creative Skills and (ii) Business Skills 33
dĂďůĞϰ͘ϭϬ͗ŚĂŶŐĞƐŝŶŵƉŚĂƐŝƐƌĂĨƚĚƵĐĂƚŽƌƐƚŚŝŶŬŽƵůĚďĞDĂĚĞŝŶƚŚĞŝƌ/ŶƐƚŝƚƵƚŝŽŶ͛ƐƌĂĨƚ
related Course Curricula to better Equip Craft Students to be Creative and Innovative
Makers with the Multi-‐disiplinary Competencies Required for Craft Enterprises 33
dĂďůĞϰ͘ϭϭ͗ĚƵĐĂƚŽƌƐ͛KƉŝŶŝŽŶƐŽŶ/ĚĞĂƐĨŽƌEĞǁŽƌůƚĞƌĞĚŽƵƌƐĞƐŽƌYƵĂůŝĨŝĐĂƚŝŽŶƐƚŽ&ĂĐŝůŝƚĂƚĞ
Executive Summary
dĂďůĞϰ͘ϭϮ͗ƌĂĨƚĚƵĐĂƚŽƌƐ͛KƉŝŶŝŽŶƐŽŶ/ŶŝƚŝĂƚŝǀĞƐƚŽĞƚƚĞƌƋƵŝƉƌĂĨƚ^ƚƵĚĞŶƚƐƚŽďĞƌĞĂƚŝǀĞ
Innovative Makers and to Give them the Multidisiplinary Competencies Required if they
wish to Establish and Develop Successful New Craft Enterprises 35
Table 5.1: Opinions of Craft Retailers on the Overall Performance of Irish Craft Makers/Enterprises
2012 36
Table 5.2: Opinions of Craft Retailers on the Performance of Irish Craft Makers/Enterprises 2012 37 Table 5.3: Overview of Responses to the Crafts Sector Workshop SWOT Analysis by Partner Region
2012 38
Table 5.4: Overview of Strengths, Weakness, Opportunities and Threats in the Crafts Sector by
Overarching "Theme" -‐ All Partner Regions 2012 38
Table 5.5: DeƚĂŝůĞĚŶĂůLJƐŝƐŽĨ͞^ƚĂŶĚĂƌĚƐ͟ĂƐĂ^ƚƌĞŶŐƚŚŽĨƚŚĞƌĂĨƚƐ^ĞĐƚŽƌ 39
dĂďůĞϱ͘ϲ͗ĞƚĂŝůĞĚŶĂůLJƐŝƐŽĨ͞WĞƌĐĞƉƚŝŽŶƐͬǁĂƌĞŶĞƐƐ͟ĂƐĂ^ƚƌĞŶŐƚŚŽĨƚŚĞƌĂĨƚƐ^ĞĐƚŽƌ 39 Table 5.7: Overview of Strengths of the Crafts Sector Voted Most Important by Overarching Theme
2012 40
Table 5.8: Overview of Weakness Voted Most Important by Theme 41
dĂďůĞϱ͘ϵ͗ĞƚĂŝůĞĚŶĂůLJƐŝƐŽĨ͞&ŝŶĂŶĐĞͬŽƐƚ͟ĂƐĂtĞĂŬŶĞƐƐŽĨƚŚĞƌĂĨƚƐ^ĞĐƚŽƌ 44
dĂďůĞϱ͘ϭϬ͗ĞƚĂŝůĞĚŶĂůLJƐŝƐŽĨ͞&ŝŶĂŶĐĞͬŽƐƚ͟ĂƐĂdŚƌĞĂƚƚŽƚŚĞƌĂĨƚƐ^ĞĐƚŽƌ 44
Table 5.11: DĞƚĂŝůĞĚŶĂůLJƐŝƐŽĨ͞ZĞƐĞĂƌĐŚͬDĂƌŬĞƚŝŶŐ͟ĂƐĂŶKƉƉŽƌƚƵŶŝƚLJĨŽƌƚŚĞƌĂĨƚƐ^ĞĐƚŽƌ 45
Table 5.12: The Extent to which Craft Makers Collaborate/Work Jointly with Other Craft and Non-‐
craft Businesses by Nature of Collaboration 46
dĂďůĞϱ͘ϭϯ͗ĞƚĂŝůĞĚŶĂůLJƐŝƐŽĨ͞ŽůůĂďŽƌĂƚŝŽŶͬEĞƚǁŽƌŬŝŶŐ͟ĂƐĂtĞĂŬŶĞƐƐŽĨƚŚĞƌĂĨƚƐ^ĞĐƚŽƌ 47
dĂďůĞϱ͘ϭϰ͗ĞƚĂŝůĞĚŶĂůLJƐŝƐŽĨ͞ŽůůĂďŽƌĂƚŝŽŶͬEĞƚǁŽƌŬŝŶŐ͟ĂƐĂŶKƉƉŽƌƚƵŶŝƚLJĨŽƌƚŚĞƌĂĨƚƐ^ĞĐƚŽƌ 47
Table 5.15: Irish Households Purchases in Potential Craft Areas -‐ ŶĂůLJƐŝƐŽĨŶŶƵĂů^ƉĞŶĚŝŶŐ;ΦͿ 49
Table 5.16: Tourism Numbers 2009-‐2011 50
Table 5.17: Total Tourism Revenue 2009-‐2011 50
Table 5.18: Breakdown of Tourism Spend 2009-‐2011 51
Table 5.19: Number of Overseas Vistiors Engaged in Cultural Activities by Activity 2009-‐2011 51
Table 5.20: Breakdown of Craft Makers by Sales Band and Expectation for Growth in Sales (2013-‐
2017) 53
Figure 1.1: Catchment Areas of the Five Partner Regions 2
Figure 1.2: Overview of Phases of Methodology/Project Work Plan 3
Figure 2.1: % Change in Full-‐time Equivalent Employees in Craft 2009-‐2012 (Including New
Businesses) 9
Figure 2.2: % Change in Full-‐time Equivalent Employed in Craft Retailing 2009-‐2012 10
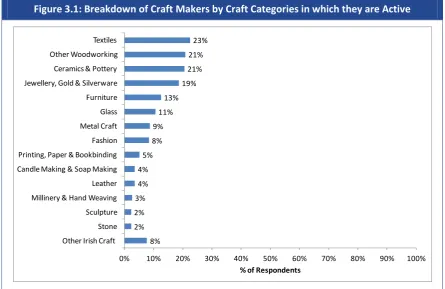
Figure 3.1: Breakdown of Craft Makers by Craft Categories in which they are Active 14
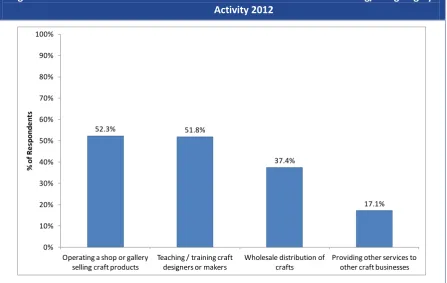
Figure 3.2: % of Craft Makers Involved in Other Activities in Addition to Making/Designing by
Activity 2012 15
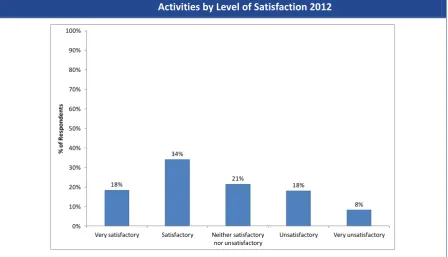
&ŝŐƵƌĞϯ͘ϯ͗ƌĂĨƚDĂŬĞƌƐ͛KƉŝŶŝŽŶƐŽŶthe Quality of Life Afforded to them by their Craft Related
Activities by Level of Satisfaction 2012 16
Figure 3.4: Channels Through Which Craft Makers Sell their Products 2012 17
Figure 3.5: Methods of Delivery Used by Craft Makers Selling Through Retail Outlets/Galleries by
Frequency of Use 18
Figure 3.8: Breakdown of Types of Outsourcing by Craft Makers, 2012 20
&ŝŐƵƌĞϯ͘ϵ͗ƌĞĂŬĚŽǁŶŽĨƚŚĞŽƐƚŽĨƌĂĨƚDĂŬĞƌƐ͛KƵƚƐŽƵƌĐĞĚĞƐŝŐŶƐĂŶĚWƌŽĚƵĐƚƐďLJ^ŽƵƌĐĞ 21
&ŝŐƵƌĞϯ͘ϭϬ͗ĐŽŵŵĞƌĐĞ&ƵŶĐƚŝŽŶĂůŝƚLJŽĨƌĂĨƚDĂŬĞƌƐ͛tĞďƐŝƚĞƐϮϬϭϮ 22
Figure 3.11: Ecommerce Functionality of Craft Retailers Websites 2012 23
Figure 3.12: Breakdown of Craft Retailers by Level of Online Trade Activity 2012 24
Figure 3.13: Proportion of Retailers Sales of Irish-‐produced Craft which is Sold Online 2012 24
Figure 3.14: Breakdown of Craft Makers by Number of New Craft Products Introduced from 2010-‐
2012 25
&ŝŐƵƌĞϰ͘ϭ͗ƌĂĨƚDĂŬĞƌƐ͛KƉŝŶŝŽŶƐŽŶ,ŽǁtĞůů/ƌŝƐŚĚƵĐĂƚŝŽŶĂů/ŶƐƚŝƚƵƚŝŽŶƐWƌĞƉĂƌĞ^ƚƵĚĞŶƚƐĨŽƌ
Work in the Crafts Sector in Terms of (i) Creative and Technical Skills and (ii) Business
Skills 2012 32
Figure 5.1: Brainstorming at the Craft Workshops ʹ Strengths of the Sector 40
Figure 5.2: Brainstorming at the Craft Workshops ʹ Weaknesses of the Sector 41
Figure 5.3: Brainstorming at the Craft Workshops ʹ Opportunities of the Sector 42
Figure 5.4: Brainstorming at the Craft Workshops ʹ Threats to the Sector 43
Figure 5.5: % of Craft Makers Who Agree that Opportunities Exist for Future Useful Collaboration by
Purpose of Collaboration 2011 48
Figure 5.6: Markets Identified by Craft Makers as Main Potential Markets for Developing Business
2013-‐2017 52
Figure 5.7: Breakdown of Craft Makers by Expectations for Future Growth in Craft Sales 2013-‐2017 53
Figure 5.8: Breakdown of Craft Retailers by Expectations for Future Growth in Sales of Irish-‐
produced Craft 2013-‐2017 54
Ždžϭ͗/ŶĚĞĐŽŶ͛Ɛ&ŽƵƌDĂŝŶ^ƚƌĂƚĞŐŝĞƐZĞƋƵŝƌĞĚƚŽ^ĞĐƵƌĞƚŚĞWŽƚĞŶƚŝĂůŽĨƌĂĨƚƵƐŝŶĞƐƐĞƐŝŶƚŚĞ
Five Partner Regions and Nationally 56
Box 2: Specific Actions in Relation to Strategy (A) Assisting Micro-‐enterprises to Achieve Some Benefits from Economies of Scale in the Crafts Sector in the Five Partner Regions and
Nationally 57
Box 3: Specific Actions in Relation to Strategy (B) Assisting the Development of a Limited Number of
Craft Businesses of Scale in the Crafts Sector in the Five Partner Regions and Nationally 60
Box 4: Specific Actions in Relation to Strategy (C) the Attraction of High Potential Start-‐up
Enterprises in the Crafts Sector in the Five Partner Regions and Nationally 61
Box 5:Specific Actions in Relation to Strategy (D) Supporting Craft Businesses who are Commercially
Focused in the Crafts Sector in the Five Partner Regions and Nationally 62
Box 6: Summary of Proposed Recommendations for Consideration 64
Executive Summary
džĞĐƵƚŝǀĞ^ƵŵŵĂƌLJ
Introduction
This report represents Indecon /ŶƚĞƌŶĂƚŝŽŶĂůĐŽŶŽŵŝĐŽŶƐƵůƚĂŶƚƐ͛ŝŶĚĞƉĞŶĚĞŶƚ ĞĐŽŶŽŵŝĐĂŶĂůLJƐŝƐŽĨƚŚĞ
current status and future clustering potential for the crafts industry in Ireland. It must be noted that this report is based on the current and future role of Local Development Companies (LDC) in the strategic growth of the crafts sector in Ireland. It does not reflect the investment and supports provided by Enterprise Ireland, the County and City Enterprise Boards and other key public and private partners in education, enterprise, tourism, culture, and at local and national level whose commitment, energy and ongoing investment is vital
ŝŶƐƵƐƚĂŝŶŝŶŐĂŶĚĚĞǀĞůŽƉŝŶŐ/ƌĞůĂŶĚ͛ƐĐƌĂĨƚƐĞĐƚŽƌ͘
Indecon International Economic Consultants͛ were commissioned on behalf of a consortium of local development companies, led by the West Cork Development Partnership in association with the Crafts Council of Ireland (CCoI), to undertake an independent economic analysis of the current status and future potential for sustainable growth and development of the SME craft sector in Ireland and with particular focus on the five partner regions of the development companies. The five development companies supporting this project under the LEADER element of the Rural Development Programme 2007-‐2013 are West Cork Development Partnership, Ballyhoura Development Company Ltd., Wexford Local Development, Kilkenny LEADER Partnership and South Tipperary Development Company.
Background
CCoI and the five local development companies have a track record of promoting and developing the crafts sector in Ireland and this review is part of the on-‐going development of their work. However, it was felt important to undertake an independent and rigorous examination of the current position and potential of the sector.
The Crafts Council of Ireland is the key development agency for the crafts in Ireland and its role is to foster the growth and commercial strength of the industry, communicating its unique identity and stimulating quality, design, innovation and competitiveness. The vision of CCoI is that Irish craft and design would be recognised and valued worldwide for its excellence in craftsmanship, innovation and marketing.
The West Cork Development LEADER Programme, (WCDP), has been active in supporting development in
the crafts sector. dŚĞtĞƐƚŽƌŬ͞&ƵĐŚƐŝĂ͟ďƌĂŶĚŝƐĐĞŶƚƌĂůƚŽtW͛ƐŝŶƚĞƌĞƐƚŝŶƚŚĞĐƌĂĨƚƐƐĞĐƚŽƌ͘Other
craft or craft ƌĞůĂƚĞĚƉƌŽũĞĐƚƐƚŚƌŽƵŐŚtWŝŶĐůƵĚĞ͞tĞƐƚŽƌŬ/ŶƐƉŝƌĞƐ͟ĐƌĂĨƚŐƌŽƵƉĞdžŚŝďŝƚŝŽŶs, training,
mentoring and supports.
Kilkenny LEADER Partnership has also been engaged in the development of the craft sector and facilitates the creation of an integrated local development strategy to improve the economic, social and cultural quality of life in County Kilkenny. With this in mind, Kilkenny LEADER Partnership places emphasis on realising the sustainable potential for rural areas, supporting craft and other businesses.
South Tipperary Development Company similarly aims to improve the social, socio-‐economic and economic circumstances within the partner region. The development company aims to increase local rural economic activity, support micro-‐enterprises, including crafts, encourages rural tourism and craft businesses and maintains and restores natural and built heritage.
Wexford Local Development promotes economic activity and job creation in order to generate additional
ĂůƚĞƌŶĂƚŝǀĞ ŝŶĐŽŵĞƐ ŝŶ ƌƵƌĂů ĂƌĞĂƐ͘ tĞdžĨŽƌĚ >ŽĐĂů ĞǀĞůŽƉŵĞŶƚ͛Ɛactions specific to the crafts sector are support for existing craft businesses and the development of new craft businesses, as well as networking activities in local crafts and the promotion of crafts including a Wexford Craft Trail.
Ballyhoura Development aims at enhancing the natural and cultural heritage; reinforcing the economic environment in order to contribute to job creation; and improving the local economy in the partner region. Specific enterprise supports that are available to ƚŚĞ ĐƌĂĨƚƐ ƐĞĐƚŽƌ ŝŶĐůƵĚĞ ͚^ƚĂƌƚŝŶŐ LJŽƵƌ ŽǁŶ ďƵƐŝŶĞƐƐ͕͛ ͚ŽŵŵƵŶŝƚLJ ĞŶƚĞƌƉƌŝƐĞ͛ ĂŶĚ ͚ŶƚĞƌƉƌŝƐĞ ĐĞŶƚƌĞƐ͛͘ /Ŷ ƉĂƌƚŝĐƵůĂƌ ĂůůLJŚŽƵƌĂ ƌĞĐŽŐŶŝses a Complementary Attractions Cluster in terms of recreation and heritage.
The analysis and strategies in this report are aligned with the objectives of = CCoI and the partner companies but also identify new initiatives to realise the potential of the crafts sector.
Methodology
As part of this study, Indecon has undertaken rigorous new research on the crafts sector. This included surveys and workshops with a wide range of makers, enterprises, retailers and educators as well as detailed engagement with a number of key stakeholders in the industry. Our primary research was designed to ensure the widest set of views was sought from persons with first-‐hand knowledge and experience of the needs and priorities of the sector. We have also analysed official statistical databases and CCoI information on the sector.
Employment in the Crafts Sector
The majority of craft makers and retailers are working full-‐time in crafts. However, the sector is also an important source of part-‐time and seasonal employment opportunities.
Employment in Crafts Sector
2012 5,351
Source: Indecon Estimates
Indecon estimates that a total of 5,351 persons were employed in craft businesses in 2012. However, it must be noted that there is some uncertainty regarding the precise estimates but they are indicative of the scale of employment in the sector.
Profile of Crafts Industry
It is useful to provide an overview of the size of the sector, the location of craft enterprises, the types of crafts and indicators of the level of activity in the industry.
The number of enterprises registered with CCoI has grown in Ireland reaching a total of 2,399 enterprises in 2012. A significant number of craft enterprises are active in the relevant five partner regions. Ceramics and pottery, jewellery (precious and non-‐precious) and furniture have the highest proportion of registered craft makers in the five regions.
Executive Summary
Selected Breakdown of Craft Enterprises by Crafts Industry in the Republic of Ireland 2012
Crafts Industry Number of Registered Craft Enterprises % Share
Textile Making & Spinning 567 24%
Jewellery Making & Silversmith 391 16%
Ceramics & Mosaics 376 16%
Wood Working 231 10%
Glass Making 179 7%
Furniture Making 172 7%
Paper & Printing 111 5%
Metal Working 92 4%
Stone Working 54 2%
Mixed Media Construction 52 2%
Basketry 36 2%
Leather Working 26 1%
Candle Making 30 1%
Musical Instrument Making 22 1%
Other Craft Industries* 60 3%
Total 2399 100%
Source: Crafts Council Register of Craft Enterprises 2012
*Bookbinding, Fly Tying, Fresco Painting & Soap Making
70.1% of makers have sales of less thĂŶ ΦϮϱ͕ϬϬϬ ƌĞĨůĞĐƚŝŶŐ ƚŚĞ ŵŝĐƌŽ-‐business structure of the sector. However, there are some craft enterprises of scale as indicated below. The small-‐scale nature of many craft businesses presents very specific development challenges but has the advantages of being a very employment-‐intensive sector.
Breakdown of Sales Revenue Reported by Craft Makers 2012
Sales Band % of Respondents in Sales Band
Less ƚŚĂŶΦϭϬ͕ϬϬϬ 49.3%
ΦϭϬ͕ϬϬϬ-‐ ΦϮϱ͕ϬϬϬ 20.8% ΦϮϱ͕ϬϬϭ-‐ ΦϱϬ͕ϬϬϬ 12.4% ΦϱϬ͕ϬϬϭ-‐ ΦϭϬϬ͕ϬϬϬ 8.4% ΦϭϬϬ͕ϬϬϭ-‐ ΦϮϱϬ͕ϬϬϬ 6.2% ΦϮϱϬ͕ϬϬϭ-‐ ΦϱϬϬ͕ϬϬϬ 1.8% ΦϱϬϬ͕ϬϬϭ-‐ Φϭŵ 1.1%
100%
Source: Indecon Analysis of Survey of Craft Makers.
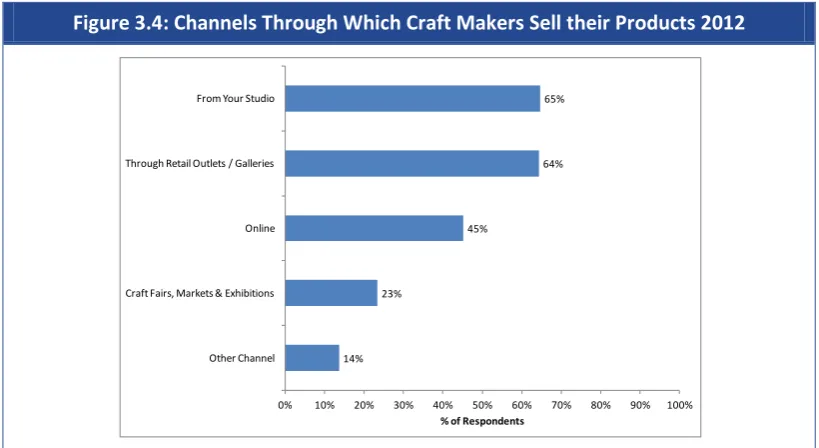
The channels through which craft makers sell their products are most commonly direct from their studio or through a retail outlet or gallery. A significant number revealed that they also sell online or at craft fairs and exhibitions.
Channels Through Which Craft Makers Sell their Products 2012
Source: Indecon Analysis of Survey of Craft Makers.
EŽƚĞ͚͗KƚŚĞƌĐŚĂŶŶĞůƐ͛ŝŶĐůƵĚĞƉŽƉ-‐up shops, repeat business, commissions, shopping channel, CCoI directory, word of mouth and
recommendations from interior designers or architects etc.
The role of e-‐commerce to craft makers and retailers is an important issue in considering the potential of the sector. Most craft makers (83%) and retailers (91%) reported that they have a website for their business, however, fewer of the craft makers have transaction capability on their websites and only 65% of retailers indicated they trade online.
Summary StatisticƐŽŶƚŚĞ&ƵŶĐƚŝŽŶĂůŝƚLJŽĨƌĂĨƚDĂŬĞƌƐ͛ĂŶĚƌĂĨƚ ZĞƚĂŝůĞƌƐ͛tĞďƐŝƚĞƐ
% of Makers with a Website % of Retailers with a Website
Email Enquiry 87% 92%
Product Images & Specifications 86% 92%
Product Pricing 44% 62%
Credit Card/Debit Card/PayPal Payment 43% 54%
Order Placement 38% 51%
Promotional Videos 17% 28%
Gift Cards and Certificates 12% 28%
Marketing and Research Tools 9% 26%
Order Tracking 8% 18%
Mobile App Support 5% 15%
Source: Indecon Survey of Craft Makers and Craft Retailers.
14% 23%
45%
64% 65%
0% 10% 20% 30% 40% 50% 60% 70% 80% 90% 100%
Other Channel Craft Fairs, Markets & Exhibitions Online Through Retail Outlets / Galleries From Your Studio
Executive Summary
Education and Skills in the Crafts Sector
A total of 8,257 students were enrolled in crafts and crafts related courses in HEA funded institutions (universities, colleges and institutes of technology) in 2012. Among those who were enrolled, 1,513 were new entrants. In 2011, 2,444 qualifications in crafts were awarded. This highlights the importance of facilitating emerging trained craft workers to establish and develop commercially viable businesses or to secure employment in other craft businesses.
40% of craft makers who responded to the survey said they felt that Irish educational institutions prepared students very well or well in the area of creative and technical skills, similarly 66% of educators shared this same view. Only 14% of makers felt that craft graduates were prepared for the sector in terms of business skills and even fewer (8%) of educators shared this view. This is a major issue and has important implications for both new and existing micro craft businesses.
Opinions of Craft Educators and Craft Makers on How Well Full-‐time and Part-‐time Crafts and Craft related courses run by Irish Educational Insititutions Prepare Students for Work in the Crafts
Sector in Terms of (i) Creative Skills and (ii) Business Skills
Very well Quite well Mixed results Quite poorly Very poorly
% of Sample % of Sample % of Sample % of Sample % of Sample
Craft Educators
Creative Skills 34% 32% 29% 3% 0%
Business Skills 0% 8% 58% 24% 8%
Craft Makers
Creative Skills 15% 25% 17% 6% 4%
Business Skills 2% 12% 23% 14% 15%
Source: Indecon Analysis of Survey of Craft Educators.
Strengths and Challenges Facing the Crafts Sector
The Irish crafts sector has many strengths, particularly in terms of the design and quality of craft products.
Retailers rated Irish craft makers as good or excellent on many criteria. Product design and quality were considered to be of a very high standard by craft retailers. There are, however, major challenges facing craft makers including the availability of product information, understanding of what consumers want and the quality of packaging. Many of the issues reflect the challenges faced by micro-‐businesses in many sectors.
Opinions of Craft Retailers on the Performance of Irish Craft Makers//Enterprises 2012
Excellent Good
Neither good
nor bad Bad Very Bad
% % % % %
Consistent quality of products 16% 66% 16% 0% 0% Depth of understanding of what consumers want 2% 36% 34% 20% 0%
Packaging quality 5% 41% 32% 18% 5%
Price competitiveness 2% 30% 52% 14% 2%
Product design 23% 53% 21% 2% 0%
Range of products available 10% 54% 22% 15% 0%
Potential for the Sector
/ŶĚĞĐŽŶ͛ƐĂƐƐĞƐƐŵĞŶƚŝƐƚŚĂƚĚĞƐƉŝƚĞƚŚĞƉƌŽŐƌĞƐƐǁŚŝĐŚŚĂs been made in developing the crafts sector there is significant potential for growth in the sector both nationally and in each of the partner regions.
The domestic market and Great Britain offer potential for further development and other markets of significance include the USA and Canada and Continental Europe. The strong connection between the crafts sector and the tourism sector in Ireland is of significance in maximising the impact of the sector. According to data from Fáilte Ireland, over 3.23 million overseas tourists visited places of historical and cultural interest in 2011. A challenge for craft makers in areas where tourist numbers are low is how to achieve sales from tourism spend.
A key issue addressed in this study was whether there were additional cost effective initiatives that could be
taken to enable the sector to realise this potential. /ŶĚĞĐŽŶ͛ƐĂƐƐĞƐƐŵĞŶƚŝƐƚŚĂƚƚŚĞƉŽƚĞŶƚŝĂůǁŝůůŽŶůLJďĞ
realised if innovative measures are taken to help very small-‐scale craft businesses to overcome the barriers to development in addition to supporting the creation of a small number of larger craft enterprises. For most craft makers, however, the challenges are those inherent in operating micro-‐businesses and the scale of the barriers to development should not be underestimated.
Developing Craft Businesses, Collaboration and Clustering
As part of our research we examined whether collaboration and clustering would be of assistance in realising the potential of the sector. Our analysis suggests that existing levels of collaboration among craft makers are low. Joint marketing, advertising and promotion appear to be one area of potential and there is also some potential for improvements to collaboration levels around product development, training sessions, workshops and joint sales initiatives.
% of Craft Makers Who Agree that Opportunities Exist for Future Useful Collaboration by Purpose of Collaboration 2012
Source: Indecon Analysis of Survey of Craft Makers.
11% 13%
16% 16% 19%
21% 23%
23%
0% 10% 20% 30% 40% 50% 60% 70% 80% 90% 100% Joint product shipping
Joint use of manufacturing or other equipment Joint purchasing of raw materials Joint ownership or rental of buildings, and other space
sharing or co-‐location
Joint sales Initiatives, platforms Joint training sessions, workshops Joint product development with other designer or creative
partner
Joint marketing, advertising and promotion
Executive Summary
Clustering may also be of assistance in helping the sector expand. The majority of clustering initiatives in crafts have taken place organically within the crafts sector, often with support from CCoI and local development agencies. In some cases such as in Kilkenny, clustering has occurred because of historical initiatives and in other instances clusters have emerged as a spin-‐off from larger craft businesses or educational institutions, or in areas of great natural beauty attractive to tourists. Indecon believes that there are benefits and synergies to be realised from wider and deeper cross-‐sectoral cooperation. However, we believe that in addition more fundamental initiatives are required to address the barriers to development facing the sector. Our recommendations for strategies needed to realise the potential of the sector are outlined below.
Recommended Strategies to Secure the Potential of Craft Businesses
Indecon͛Ɛ ĂŶĂůLJƐŝƐ suggests four main strategies are required if the potential of craft businesses in the partner regions and nationally are to be realised. The four key areas of action needed are as follows:
Measures to assist micro craft businesses to achieve some of the benefits of economies of scale;
Programme to assist development of a limited number of craft businesses of scale;
Attraction of high potential start-‐up craft enterprises; and
Measures to support commercially focused new craft makers.Many of CCoI͛Ɛ current initiatives as well as those undertaken by the local development companies are already contributing to these strategic objectives. For each of the four high-‐level strategies, Indecon has proposed a number of specific additional targeted actions that would assist realising the potential of the sector. We believe that if these measures are implemented the Crafts Sector has the ability to increase both domestic and export sales and critically to expand employment opportunities, aligned with the skill base of the Irish labour force. Detailed actionable measures under each of the areas identified are discussed in more detail in the recommendations sector of this report.
Summary of Proposed Recommendations for Consideration
Measures to assist existing micro craft businesses to achieve some of the benefits of economies of scale 1. Creation of facilities to boost craft sales at key tourism attractions2. Clustering based co-‐operation to improve efficiency, quality or market access
3. Support expanded supplier programme with selected retailers
4. Craft Enterprise Lounge
5. Develop virtual social networks amongst craft makers
6. Encourage more local collaboration with related sectors
Programme to assist the development of a limited number of craft businesses of scale 7. Support for recruitment and development of key management8. Financial support for investment in technology and R+D
9. Significant branding/marketing supports
Attraction of high potential start up craft enterprises 10. Encouragement of new start-‐ups from related sectors11. Support for craft entrepreneurs with existing business experience
12. Attraction of craft makers currently based in other countries
Measures to support commercially focused new craft makers 13. Develop post graduate course in Arts and Crafts Entrepreneurship14. ͚ŽƌƉŽƌĂƚĞĂĚŽƉƚŝŽŶ͛ŽĨŶĞǁƚĂůĞŶƚĞĚcraft makers by successful existing major companies in region
15. Scholarship scheme for craft graduate(s) to undertake MBA in leading business school
Conclusion
The recommendations are consistent with the existing strategies being implemented by CCoI and the five local development companies. However, effective implementation would require action by a range of other national and local organisations and support by individual craft makers and other businesses. It is essential that there are appropriate resource allocations to support the recommendations. /ŶĚĞĐŽŶďĞůŝĞǀĞƐƚŚĂƚ͚ƚŚĞ ƉƌŝnjĞ͛ǁŚŝĐŚĞdžŝƐƚƐŝŶƚĞƌŵƐŽĨĞŵƉůŽLJŵĞŶƚŽƉƉŽƌƚƵŶŝƚŝĞƐŝŶƚŚŝƐŚŝŐŚůLJƐŬŝůůĞĚŝŶƚĞŶƐŝǀĞƐĞĐƚŽƌũƵƐƚŝĨŝĞƐĂnew co-‐ordinated national approach for this sector.
Acknowledgments
Indecon would like to acknowledge the valuable advice and inputs of a wide range of organisations and individuals. We would in particular like to thank Ian Dempsey West Cork Development Partnership, Jean
K͛^ƵůůŝǀĂŶ tĞƐƚ ŽƌŬ ĞǀĞůŽƉŵĞŶƚ WĂƌƚŶĞƌƐŚŝƉ͕ EŝĂůů DŽƌƌŝƐƐĞLJ ^ŽƵƚŚ dŝƉƉĞƌĂƌLJ ĞǀĞůŽƉŵĞŶƚ ŽŵƉĂŶLJ͕
Declan Rice Kilkenny Leader Partnership, Helena Dempsey Wexford Local Development, as well as Padraig Casey and Claire Horgan Ballyhoura Development Ltd. We would also like to acknowledge the valuable advice and assistance provided by CCoI including Karen Hennessy, Louise Allen, Anastasia Dack, Audrey Kelly, John Tynan, Gus Mabelson and Eimear Conyard. Indecon would also like to thank the wide range of craft makers, retailers, educationalists and government agencies that provided valuable first-‐hand insights into the nature and potential of the sector. Indecon would also like to thank the Crafts Guilds, Associations Networks and Societies (GANS) and other organisations who encouraged co-‐operation with our study and who provided inputs to our analysis. Most of all we would like to thank the many talented craft makers in Ireland who shared their experience and insights.
1 ŇIntroduction and Background
1
/ŶƚƌŽĚƵĐƚŝŽŶĂŶĚĂĐŬŐƌŽƵŶĚ
1.1
Introduction
dŚŝƐ ƌĞƉŽƌƚ ƌĞƉƌĞƐĞŶƚƐ /ŶĚĞĐŽŶ /ŶƚĞƌŶĂƚŝŽŶĂů ĐŽŶŽŵŝĐ ŽŶƐƵůƚĂŶƚƐ͛ ŝŶĚĞƉĞŶĚĞŶƚ economic analysis of the current status and future clustering potential for the crafts industry in Ireland. It must be noted that this report is based on the current and future role of Local Development Companies (LDC) in the strategic growth of the crafts sector in Ireland. It does not reflect the investment and supports provided by Enterprise Ireland, the County and City Enterprise Boards and other key public and private partners in education, enterprise, tourism, culture, and at local and national level whose commitment, energy and ongoing investment is vital in sustaining and
ĚĞǀĞůŽƉŝŶŐ/ƌĞůĂŶĚ͛ƐĐƌĂĨƚƐĞĐƚŽƌ͘
1.2
Background to the Study
In May 2012 the West Cork Development Partnership (on behalf of a consortium of Local Development Companies including Ballyhoura Development Ltd, Wexford Local Development, Kilkenny LEADER Partnership and South Tipperary Development Company) signed a Memorandum of Understanding with CCoI. The Memorandum of Understanding sets out their commitment to work together in order to develop a strategic action plan that will support the growth and development of the crafts sector and contribute to rural development in terms of jobs, economic growth, infrastructure and strategic partnerships.
CCoI, based in Kilkenny, is the key supporter and promoter of the crafts industry in Ireland. Its role
ŝƐ ƚŽ ĨŽƐƚĞƌ ƚŚĞ ŐƌŽǁƚŚ ĂŶĚ ĐŽŵŵĞƌĐŝĂů ƐƚƌĞŶŐƚŚ ŽĨ ƚŚĞ ƐĞĐƚŽƌ͕ ĐŽŵŵƵŶŝĐĂƚŝŶŐ ƚŚĞ ŝŶĚƵƐƚƌLJ͛Ɛ
unique identity and stimulating quality design, innovation and competitiveness. The Local Development Companies are responsible for the Rural Development (LEADER) programme 2007-‐ 2013 in their respective areas and provide direct support for local development initiatives conducive to, and supportive of, local community and enterprise development.
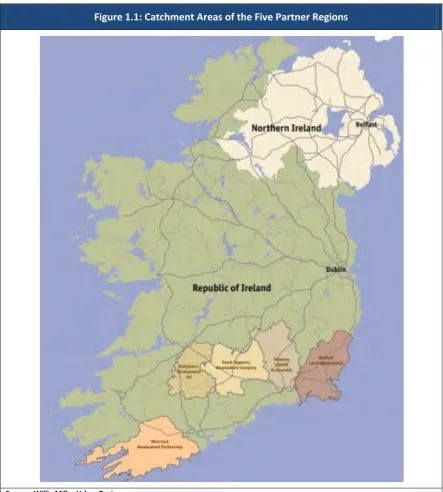
This study is an independent report by Indecon Economic Consultants and represents a rigorous economic analysis of the current status and future potential for sustainable growth and development of the SME craft sector in Ireland, with particular focus on the five partner regions. The catchment area of each the five partner regions (West Cork, Ballyhoura, South Tipperary, Kilkenny and Wexford) are shown in Figure 1.1. The West Cork partner region includes Bandon, Skibbereen, Bantry and parts of the Macroom electoral area. This region is bounded on the east by the town of Carrigaline and Cork Harbour and by the coastline to the south. The Ballyhoura catchment area incorporates East Limerick and North East Cork. The South Tipperary Local
Development CŽŵƉĂŶLJ͛ƐĐĂƚĐŚŵĞŶƚĂƌĞĂŝƐƚŚĞůŽĐĂůĂƵƚŚŽƌŝƚLJĂƌĞĂŽĨ^ŽƵƚŚdŝƉƉĞƌĂƌLJ;ƐŽƵƚŚĞĂƐƚ
region).
[image:16.595.71.515.103.596.2]
Figure 1.1: Catchment Areas of the Five Partner Regions
Source: Willie Miller Urban Design
While the focus of this study is on the potential for expansion of the craft sector in the five partner regions, the analysis has wider national implications. The experience of the sector in these regions and an understanding of the barriers to development which face craft makers provide insights that Indecon believes could be the basis for a model of development for the sector in other regions.
1 ŇIntroduction and Background
1.3
Scope of the Study
A number of particular issues have been addressed in the study as follows:
Economic analysis of the current status of craft enterprise nationally and in the partner study area and of the future potential for the growth and development of the sector;
Inhibitors/enablers to growth;
Education, skills and training needs;
Synergies in respect of cross-‐sectoral collaboration that provide opportunities for growth or alignment of support services between agencies and which could facilitate scalability of craft enterprise.
Particular emphasis has been given to assessing the current and future potential of the sector and to identifying an action plan to realise the opportunities for the sector.
1.4
Methodology
1.4.1
Overview of Methodology
A schematic summary of the five-‐phased methodological approach applied in completing this study is presented in Figure 1.2.
Figure 1.2: Overview of Phases of Methodology/Project Work Plan
Source: Indecon
1.4.2
Primary Research
As part of our approach to this study, Indecon has undertaken significant primary research. This included surveys and workshops with a wide range of makers, enterprises, retailers and educators active in crafts across Ireland as well as detailed engagement with a number of key stakeholders in the industry. Our primary research was designed to ensure the widest set of views was sought from persons with first-‐hand knowledge and experience of the needs and priorities of the sector. These elements are described below. In addition we undertook a detailed analysis of official statistical databases and CCoI information on the sector.
Phase 1: Project Inception. Review
of Previous Research. Identification of Data and Primary
Research Requirements
Phase 2: Primary Research and
Baseline Analysis
Phase 3: Economic
Impact Modelling
Phase 4: Detailed Assessment of
Strengths, Opportunities and Enablers; Weaknesses, Threats and
Inhibitors
Engagement with Key Stakeholders
/ŶĚĞĐŽŶ͛Ɛ ĞŶŐĂŐĞŵĞŶƚ ǁŝƚŚ ŝŶĚƵƐƚƌLJ ƐƚĂŬĞŚŽůĚĞƌƐ ŝŶǀŽůǀĞĚ meetings and other inputs from interested parties including:
CCoI;
The Local Development Companies;
Craft makers or enterprises;
Craft retailers; and
Educational institutions.
Surveys Research
As part of our primary research and baseline analysis, Indecon also undertook, with the assistance of CCoI and the local development companies, targeted and focused surveys as follows:
Survey of Craft Makers and Enterprises
Survey of Craft Retailers
Survey of Craft Educators
Indecon received a large number of responses to these surveys that are shown in the table below. Of particular significance was the larger number of responses (324) received from craft makers and enterprises.
Table 1.1: Summary of Number of Responses to Indecon Surveys
Survey No. of Responses
Survey of Craft Makers
5 Partner Regions 77
Rest of the Republic of Ireland 225
Northern Ireland 22
Craft Makers & Enterprises Total 324
Survey of Craft Retailers
Survey of Retailers of Irish-‐produced Crafts in Ireland and abroad 47
Survey of Craft Educators
Survey of Craft Educators in the Republic of Ireland and Northern Ireland 41
Grand Total 412
Source: Indecon Analysis.
1 ŇIntroduction and Background
Craft Workshops and Consultations
To enable more detailed examination of issues of relevance to craft makers in the partnership areas and to discuss issues emerging from the survey research and stakeholder consultations, Indecon undertook a series of workshops with:
Craft Makers and Enterprises in operation in the five partner areas;
Craft Retailers in operation in the five partner areas; and
Craft Educators in the five partner areas.Indecon͛Ɛ workshop model follows best practice standards in conducting research of this form. Workshop attendees took part in a structured SWOT1 analysis of the crafts industry, encompassing all aspects of the industry relevant to craft design, production, retailing and education. The structure of the workshop ensured that all attendees were given the opportunity to put forward their views through both written and oral submissions.
1.5
Structure of Report
The remainder of this report is structured as follows:
Section 2 presents an overview of the employment significance of the crafts industry.
Section 3 provides an analysis of the profile of the sector including levels of sales, as well as issues such as e-‐commerce and product development.
Section 4 presents a review of education in the sector.
Section 5 focuses on developing the sector.
Section 6 presents our recommendations on securing the potential of craft businesses.1.6
Acknowledgements
Indecon would like to acknowledge the valuable advice and inputs of a wide range of organisations and individuals. We would in particular like to thank Ian Dempsey West Cork Development
WĂƌƚŶĞƌƐŚŝƉ͕:ĞĂŶK͛^ƵůůŝǀĂŶtĞƐƚŽƌŬĞǀĞůŽƉŵĞŶƚWĂƌƚŶĞƌƐŚŝƉ͕EŝĂůůDŽƌƌŝƐƐĞLJ^ŽƵƚŚdŝƉƉĞƌĂƌLJ
Development Company, Declan Rice Kilkenny Leader Partnership, Helena Dempsey Wexford Local Development, as well as Padraig Casey and Claire Horgan Ballyhoura Development Ltd. We would also like to acknowledge the valuable advice and assistance provided by CCoI including Karen Hennessy, Louise Allen, Anastasia Dack, Audrey Kelly, John Tynan, Gus Mabelson and Eimear Conyard. Indecon would also like to thank the wide range of craft makers, retailers, educationalists and government agencies who provided valuable first-‐hand insights into the nature and potential of the sector. Indecon would also like to thank the crafts Guilds, Associations Networks and Societies (GANS) and other organisations who encouraged co-‐operation with our study and who provided inputs to our analysis. Most of all we would like to thank the many talented craft makers in Ireland who shared their experience and insights.
The usual disclaimer applies and the views and analysis in this report are the responsibility of Indecon.
2
ŵƉůŽLJŵĞŶƚŝŶƚŚĞƌĂĨƚƐ^ĞĐƚŽƌ
2.1
Introduction
From a national economic perspective it is important to consider the overall economic significance of the crafts sector particularly in terms of numbers employed.
2.2
Nature of Employment in the Crafts Sector
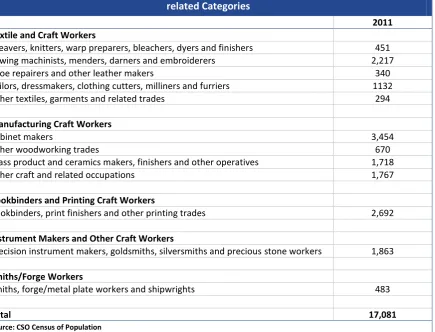
[image:20.595.89.525.341.673.2]The Census of Population provides detailed data on the labour force by detailed occupation that allows us to select a number of crafts and craft related occupations for assessment. The size of the labour force in 2011 for these selected occupations is shown in Table 2.1 below. The evidence suggests that there is a significant labour force in crafts-‐related occupations nationally although some of these categories may not be included in a narrow definition of crafts. There are also other craft sub-‐sectors not included in these categories but the figures highlight the range of skilled employees available.
Table 2.1: Trend Analysis of Irish Census of Population 2011 -‐ Labour Force in Detailed Craft related Categories
2011
Textile and Craft Workers
Weavers, knitters, warp preparers, bleachers, dyers and finishers 451
Sewing machinists, menders, darners and embroiderers 2,217
Shoe repairers and other leather makers 340
Tailors, dressmakers, clothing cutters, milliners and furriers 1132
Other textiles, garments and related trades 294
Manufacturing Craft Workers
Cabinet makers 3,454
Other woodworking trades 670
Glass product and ceramics makers, finishers and other operatives 1,718
Other craft and related occupations 1,767
Bookbinders and Printing Craft Workers
Bookbinders, print finishers and other printing trades 2,692
Instrument Makers and Other Craft Workers
Precision instrument makers, goldsmiths, silversmiths and precious stone workers 1,863
Smiths/Forge Workers
Smiths, forge/metal plate workers and shipwrights 483
Total 17,081
Source: CSO Census of Population
2 ŇEmployment in the Crafts Sector
A special analysis conducted by the CSO for Indecon for this study of the labour force in the counties relevant to the five partner regions is presented below. This shows that there are over 3,800 persons in the five counties who are in these occupational categories.
Table 2.2: Breakdown of Irish Census of Population 2011, Number of People in the Labour force by Counties in the Five Partner Regions by Detailed Craft related Occupation
Kilkenny Wexford
South
Tipperary Cork Limerick
Rest of Ireland
Total
Cabinet makers 115 129 77 420 118 2,595 3,454
Glass product and ceramics makers,
finishers and other operatives 104 77 30 146 44 1,317 1,718
Precision instrument makers, goldsmiths, silversmiths and precious stone workers
46 53 36 307 119 1,302 1,863
Bookbinders, print finishers and
other printing trades 41 47 16 177 74 2,337 2,692
Other craft and related occupations 40 58 25 196 94 1,354 1,767
Sewing machinists, menders,
darners and embroiderers 32 59 29 215 80 1,802 2,217
Other woodworking trades 28 26 21 119 32 444 670
Tailors, dressmakers, clothing
cutters, milliners and furriers 17 24 11 128 31 921 1,132
Smiths, forge/metal plate workers
and shipwrights 12 32 14 73 17 335 483
Weavers, knitters, warp preparers,
bleachers, dyers and finishers 8 17 6 52 9 359 451
Shoe repairers and other leather
makers 6 6 9 40 16 263 340
Other textiles, garments and
related trades 6 2 4 25 8 249 294
Total 455 530 278 1,898 642 13,278 17,081
Source: CSO Special Analysis of Census completed for Indecon
Table 2.3 examines the employment and unemployment rates of each of the occupations. The data suggests there were approximately 12,050 employed in these occupations in 2011. The evidence also suggests that many craft workers are unemployed which highlights the importance of measures to expand the sector and to enhance the viability of existing and new craft enterprises.
Table 2.3: Analysis of Irish Census of Population 2011 -‐ Labour Force & Persons at Work in Detailed Craft related Categories
Labour Force
Unemployment Rate
Persons at Work Textile and Craft Workers 2011 2011 2011
Weavers, knitters, warp preparers, bleachers, dyers and
finishers 451 34.1% 297
Sewing machinists, menders, darners and embroiderers 2,217 44.8% 1,224
Shoe repairers and other leather makers 340 23.8% 259
Tailors, dressmakers, clothing cutters, milliners and
furriers 1132 28.8% 806
Other textiles, garments and related trades n.e.s. 294 46.6% 157
Manufacturing Craft Workers
Cabinet makers 3,454 36.2% 2,204
Other woodworking trades 670 19.6% 539
Glass product and ceramics makers, finishers and other
operatives 1,718 38.2% 1,062
Other craft and related occupations 1,767 19.8% 1,417
Bookbinders and Printing Craft Workers
Bookbinders, print finishers and other printing trades 2,692 23.6% 2,057
Instrument Makers and Other Craft Workers Precision instrument makers, goldsmiths, silversmiths and
precious stone workers 1,863 11.9% 1,641
Smiths/Forge Workers
Smiths, forge/metal plate workers and shipwrights 483 19.7% 388
Total 17,081 12,050
Source: CSO Census of Population
Responses from our survey of craft makers and retailers provide a useful insight into the nature of employment in the industry. An analysis of headcount reveals that the majority of craft makers are working full-‐time. The sector is also an important source of part-‐time and seasonal employment opportunities.
2 ŇEmployment in the Crafts Sector
Table 2.4: Breakdown of Persons Employed/Engaged in Craft in 2009 and 2012 ʹ Headcount
2009 2012
Headcount Headcount
Full-‐time 62% 58%
Part-‐time 31% 33%
Seasonal 8% 9%
100% 100%
Source: Indecon Analysis of Survey of Craft Makers.
Figure 2.1 displays the change in the number of full-‐time equivalent (FTE) persons employed in crafts from 2009 to 2012 for full-‐time, part-‐time and seasonal workers. According to the survey respondents, the number of FTE persons working full-‐time in the craft enterprises increased by almost 5% over the period from 2009 to 2012. Part-‐time and seasonal employed increased at a faster rate according to our survey. These results reflect employment in new start-‐up craft businesses and do not take account of employment losses in craft enterprises that have ceased operation.
Figure 2.1: % Change in Full-‐time Equivalent Employees in Craft 2009-‐2012 (Including New Businesses)
Source: Indecon Analysis of Survey of Craft Makers.
4.4%
18.4%
34.4%
7.8%
0% 10% 20% 30% 40% 50% 60% 70% 80% 90% 100%
Full-‐time Part-‐time Seasonal Total FTE
%
Ch
an
ge
in
F
TE
E
m
p
lo
ye
[image:24.595.85.515.158.423.2]
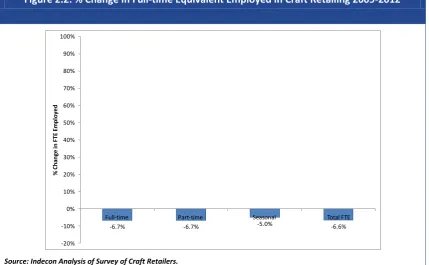
The change in FTEs employed in craft retailing is shown in Figure 2.2 below. Among the respondents to our craft retailing survey, the total number of full-‐time equivalent numbers employed fell by 6.6% from 2009 to 2012. These findings reflect the general decline in consumer expenditure and the pressures on the retail sector.
Figure 2.2: % Change in Full-‐time Equivalent Employed in Craft Retailing 2009-‐2012
Source: Indecon Analysis of Survey of Craft Retailers.
Note: Includes foreign retailers selling Irish Crafts.
The table below shows an update of the Indecon estimates of employment in craft enterprises employing three or more persons in Ireland. The estimates (informed by primary research and survey analysis) indicate the number of persons engaged in craft enterprises employing 3 or more amounted to around 3,887 in 2012. However, there is significant uncertainty regarding these estimates and they should be seen as indicative.
Table 2.5: Employment Estimates in Craft Enterprises -‐ Employing 3 or more 2012
2012
Pottery & Ceramics 751
Graphic Crafts 672
Jewellery 651
Textiles 516
Stone 515
Wood 242
Iron & Metals 195
Heritage & Rural Crafts 154
Glass 145
Other 45
Total Craft 3,887
Source: Update of Indecon Analysis of the Crafts Sector 2009 using Indecon Survey of Craft Makers 2012.
-‐6.7% -‐6.7% -‐5.0% -‐6.6%
-‐20% -‐10% 0% 10% 20% 30% 40% 50% 60% 70% 80% 90% 100%
Full-‐time Part-‐time Seasonal Total FTE
%
Ch
an
ge
in
F
TE
E
m
p
lo
ye
d
2 ŇEmployment in the Crafts Sector
We estimate total employment among craft businesses including those employing less than three as well as employment in the larger enterprises. This suggests total employment of 5,351 in crafts sector.
Table 2.6: Overall Estimates of Employment in the Craft Sector
Employment in Crafts Sector 2012 5,351
Source: Indecon Estimates
2.3
Summary of Findings
The majority of craft makers and retailers are working full-‐time. However, the sector is also an important source of part-‐time and seasonal employment opportunities.
Indecon estimates that there are a total of 5,351 persons employed in craft businesses in 2012. However, it must be noted that there is some uncertainty regarding the precise estimates but they are indicative of the scale of employment in the sector.
3
WƌŽĨŝůĞŽĨƚŚĞƌĂĨƚƐ/ŶĚƵƐƚƌLJ
3.1
Introduction
This section presents a summary profile of the crafts sector. This includes an analysis of the location of craft enterprises, the types of craft and various indicators of the level of activity. It also examines the distribution channels used and other features of the sector.
3.2
Craft Makers and Enterprises in Ireland
An important source of information on the crafts sector is the register of craft enterprises of the Crafts Council of Ireland (CCoI). Table 3.1 presents a breakdown of the number of craft enterprises registered by county. Those counties within the catchment area of the five partner regions are highlighted. The number of enterprises registered with CCoI has grown substantially from 1,842 in 20