Original Article
Biomarkers of non-alcoholic fatty liver disease in
a Chinese population: a cross-sectional survey
Hai-Yan Rong, Cun-Ren Meng, Zhao-Yun Chen, Li Xue
Laboratory Medicine Diagnostic Centre, The First Affiliated Hospital, Xinjiang Medical University, Urumqi, China
Received May 22, 2018; Accepted November 9, 2018; Epub February 15, 2019; Published February 28, 2019
Abstract: Liver biopsy is the gold standard method for diagnosis of non-alcoholic fatty liver disease (NAFLD), but it is invasive. In this study, relationships between common biochemical indexes and NAFLD were analyzed to explore the clinical value of these non-invasive indicators for clinical diagnosis and treatment. Anthropometric data and
biochemical indexes were compared between 204 patients with NAFLD, admitted to the First Affiliated Hospital of
Xinjiang Medical University, between January and August 2017, and 521 contemporaneous healthy controls. Male/ female ratio, age, height, weight, body mass index (BMI), systolic pressure, diastolic pressure, and proportions with hypertension, diabetes mellitus, or hyperuricemia were higher in the NAFLD group than the control group (P<0.05),
Alanine aminotransferase, aspartate aminotransferase (AST), γ-glutamyl transpeptidase, uric acid (UA), fasting
plasma glucose (FPG), triglycerides (TG), and total cholesterol levels were also higher in the NAFLD group (P<0.05). However, serum high-density lipoprotein cholesterol (HDL-C) was lower in the NAFLD group (P<0.05). Logistic regres-sion analysis revealed that BMI, AST, UA, FPG, and TG were associated with susceptibility to NAFLD, while HDL-C
was protective. Finally, receiver operating characteristic curves of BMI and TG/HDL-C ratios identified patients with
NAFLD. Thus, NAFLD was closely associated with glucose and lipid metabolism disorders, along with high FPG, BMI, TG, AST, and UA and low HDL-C. All are risk factors for NAFLD.
Keywords: Biomarkers, non-alcoholic fatty liver disease
Introduction
Non-alcoholic fatty liver disease (NAFLD) is a clinical syndrome characterized by fatty degen-eration on liver histology [1]. NAFLD includes a spectrum of chronic liver disease, ranging from hepatic steatosis or fatty liver to non-alcoholic
steatohepatitis (NASH), liver fibrosis, liver cir -rhosis, and hepatocellular carcinoma (HCC) [2]. Approximately 10%-25% of patients with silent liver disease develop NASH and 5%-8% of these will develop liver cirrhosis within 5 years [3-5]. Furthermore, 12.8% of patients with liver cir-rhosis will develop hepatocellular carcinoma (HCC) within 3 years [6]. Prevalence of NAFLD is increasing. It has become the most common chronic disease among Chinese adults in China, more common than other equally impor-tant epidemics, including obesity, hyperten-sion, and type 2 diabetes. Moreover, NAFLD is associated with an increase in overall cardio-vascular morbidity and mortality [7-10].
Although definitive diagnosis of NAFLD is still
histological, the dramatic rise in prevalence
and the spectrum of severity suggest that liver biopsy has become impractical for use in all potential cases. Therefore, there has been
sig-nificant focus on the development and valida -tion of non-invasive biomarkers of NAFLD in
recent years [11]. Identification of biomarkers
may suggest therapeutic strategies that could
be used to prevent inflammation and fibrosis in
individuals with fatty liver disease, providing a powerful tool for the monitoring of patients wi- th steatohepatitis. The success of a preventi-
on program will depend on early identification,
treatment, and monitoring of high-risk individu-als, achieved by assaying many disease-specif-ic biomarkers. Biomarkers would be partdisease-specif-icularly
useful for the quick identification and treatment
of patients with fatty liver disease and diagno-sis of patients with life-threatening NAFLD and
NASH. This would enable classification and
staging of the disease using a simple blood test, avoiding the necessity of a liver biopsy [12].
investigated the utility of these non-invasive indices for the diagnosis and treatment of NAFLD.
Materials and methods
Study population
Two hundred and four NAFLD patients from the
First Affiliated Hospital of Xinjiang Medical
University, between January and August 2017, were recruited for the present study. They included 144 men and 60 women of 20-74
men and 263 women, aged 18-80 years, with a mean age of 36.3±11.8 years. The study was approved by the Ethics Committee of the First
Affiliated Hospital of Xinjiang Medical University
and written informed consent was provided by each participant.
Collection of clinical data
Subjects were asked to complete a question-naire regarding gender, age, smoking habits, alcohol intake, and current and previous medi-cal history. Height, weight, systolic blood pres-Table 1. Comparison of clinical data between NAFLD and
control groups
Item Control group (n=521) NAFLD group (n=204) P
Sex (male/female) 258/263 144/60 <0.05 Age (years) 36.27±11.83 38.28±12.25 <0.05 Height (cm) 169.37±8.09 171.48±7.63 <0.05 Weight (kg) 67.50±23.46 79.61±12.52 <0.05 BMI (kg/m2) 23.75±3.10 26.93±3.12 <0.05
Systolic pressure (mmHg) 120.98±15.10 125.97±15.01 <0.05 Diastolic pressure (mmHg) 72.52±11.90 75.24±12.54 <0.05 Smoke n (%) 130 (25.0) 65 (31.9) >0.05 Exercise n (%) 350 (67.2) 127 (62.3) >0.05 Hypertension n (%) 39 (7.5) 38 (18.6) <0.05 Diabetes mellitus n (%) 10 (1.9) 28 (13.7) <0.05 Hyperuricemia n (%) 79 (15.2) 49 (24.0) <0.05
[image:2.612.91.360.96.281.2]NAFLD: non-alcoholic fatty liver disease; BMI: body mass index.
Table 2. Comparison of biochemical indexes between NAFLD and control groups
Item Control group (n=521) NAFLD group (n=204) P
ALT (U/L) 25.61±17.74 35.53±22.04 <0.05 AST (U/L) 23.77±17.55 31.75±23.28 <0.05 GGT (U/L) 29.09±26.50 42.16±33.90 <0.05 BUN (mmol/L) 4.77±1.47 4.98±1.24 >0.05 CRE (μmol/L) 73.31±17.64 74.30±15.17 >0.05 UA (μmol/L) 298.95±90.08 343.44±93.78 <0.05 FPG (mmol/L) 5.08±0.79 5.58±1.62 <0.05 HDL-C (mmol/L) 1.56±0.44 1.34±0.30 <0.05 LDL-C (mmol/L) 2.63±0.85 2.68±0.88 >0.05 TG (mmol/L) 1.35±0.88 2.04±1.40 <0.05 TC (mmol/L) 4.61±1.00 4.83±0.95 <0.05
NAFLD: non-alcoholic fatty liver disease; ALT: alanine aminotransferase; AST:
aspartate aminotransferase; GGT: γ-glutamyl transpeptidase; BUN: blood urea
nitrogen; CRE: creatinine; UA: uric acid; FPG: fasting plasma glucose; HDL-C: high-density lipoprotein cholesterol; LDL-C: low density lipoprotein cholesterol; TG: triglyceride; TC: total cholesterol.
years of age (mean 38.3±12.3 years). NAFLD was diagnosed on the basis of ultrasound criteria listed by the Chinese Medical Association [13]. These criteria included: 1) Diffuse enhancement
of near field echo in the hepatic
region (stronger than in the kid-ney and spleen region) and
gradu-al attenuation of the far field echo;
2) Lack of clarity of the intra-hepatic lacunae; 3) Mild-to-mo- derate hepatomegaly with round and blunt borders; and 4) Color Doppler ultrasonography showing
a reduction in the blood flow sig
-nal or a sig-nal that was difficult to
display, but with the distribution
of blood flow in the liver being nor -mal. NAFLD was diagnosed if item 1 and any one or more of items 2-4 were present. Hepatic ultra-sonographic examinations were performed and conducted by a tr- ained ultrasonographer in a blind-ed manner.
Patients were excluded from the study if: 1) They consumed too much alcohol (women >70 g/wk, men >140 g/wk); 2) Had other liver diseases, such as viral hepa-titis, autoimmune hepahepa-titis, pri-mary biliary cirrhosis, alcoholic liver disease, drug or
toxin-associ-ated liver disease, or liver fibrosis;
[image:2.612.91.360.340.509.2]sure, diastolic blood pressure, and body mass index (BMI) were measured.
Specimen collection and analysis
Fasting venous blood was collected from sub-jects in the early morning (5 mL/sample). Se- rum was separated and stored at -80°C until analysis. Blood urea nitrogen (BUN), creatinine (CRE), uric acid (UA), aspartate aminotrans- ferase (AST), alanine aminotransferase (ALT), gamma glutamyl transpeptidase (GGT), fasting plasma glucose (FPG), high-density lipoprotein cholesterol (HDL-C), low-density lipoprotein ch- olesterol (LDL-C), triglycerides (TG), and total cholesterol (TC) were measured using an auto-matic biochemistry analyzer (DXC800, Beck- man Coulter Inc., CA). Effective quality control measures were used and manufacturer instruc-tions were followed.
Statistical analysis
Statistical analyses were conducted using SP- SS software version 13.0 for Windows (IBM,
were no significant differences in smoking or
exercise habits between NAFLD and control groups (P>0.05) (Table 1).
Comparison of blood biochemical indexes
ALT, AST, GGT, UA, FPG, TG, and TC were all
sig-nificantly higher in the NAFLD group than the
control group (all P<0.05). However, serum HDL-C concentrations were lower in the NAFLD group than the control group (P<0.05). There
were no significant differences in serum BUN,
CRE, or LDL-C levels between NAFLD and con-trol groups (P>0.05) (Table 2).
Logistic regression analysis of potential risk factors for NAFLD
A stepwise binary logistic regression model was used to identify independent risk factors for NAFLD. All 23 variables listed in Tables 1 and 2 were included in the original equation. Six
vari-ables remained in the final equation after 17
had been eliminated. These six variables were
[image:3.612.89.373.97.199.2]significantly associated with the presence of
Table 3. Logistic regression analysis of potential risk factors for NAFLD
Item B S.E. Wald P Exp (B) 95% CI FPG (mmol/L) 0.275 0.090 9.249 0.002 1.316 1.103-1.571 BMI (Kg/m2) 0.256 0.037 148.971 0.000 1.292 1.202-1.388
TG (mmol/L) 0.241 0.102 5.620 0.018 1.272 1.043-1.553 AST (U/L) 0.012 0.005 5.454 0.020 1.012 1.002-1.022 UA (μmol/L) 0.003 0.001 5.629 0.018 1.003 1.001-1.006 HDL-C (mmol/L) -0.816 0.310 6.943 0.008 0.442 0.241-0.811
NAFLD: non-alcoholic fatty liver disease; FPG: fasting plasma glucose; BMI: body mass index; TG: triglyceride; AST: aspartate aminotransferase; UA: uric acid; HDL-C: high-density lipoprotein cholesterol.
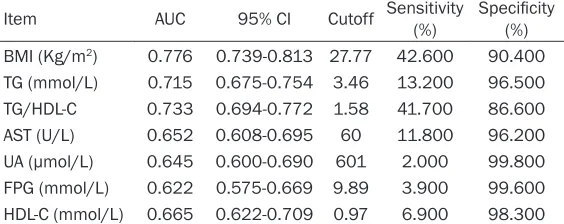
Table 4. Predictive value of biochemical indexes for NAFLD, as-sessed using receiver operating characteristic curves
Item AUC 95% CI Cutoff Sensitivity (%) Specificity (%) BMI (Kg/m2) 0.776 0.739-0.813 27.77 42.600 90.400
TG (mmol/L) 0.715 0.675-0.754 3.46 13.200 96.500 TG/HDL-C 0.733 0.694-0.772 1.58 41.700 86.600 AST (U/L) 0.652 0.608-0.695 60 11.800 96.200 UA (μmol/L) 0.645 0.600-0.690 601 2.000 99.800 FPG (mmol/L) 0.622 0.575-0.669 9.89 3.900 99.600 HDL-C (mmol/L) 0.665 0.622-0.709 0.97 6.900 98.300
NAFLD: non-alcoholic fatty liver disease; BMI: body mass index; TG: triglyceride; AST: aspartate aminotransferase; UA: uric acid; FPG: fasting plasma glucose; HDL-C: high-density lipoprotein cholesterol.
Armonk, NY, USA). Continuous data are summarized as me- an ± standard deviations, with
normality being confirmed
us-ing the Kolmogorov-Smirnov te- st. Independent-samples t-test was used for comparisons be- tween two groups and Chi-squared test was used for com-parisons between enumerated data. Correlation analysis of ri- sk factors for NAFLD was per-formed using logistic regres-sion analysis and receiver ope- rating characteristic (ROC) cur- ves were used to assess the performance of variables. P< 0.05 indicates statistical signi-
ficance.
Results
Comparison of clinical data
[image:3.612.91.373.283.395.2]NAFLD, with FPG, BMI, TG, AST, and UA asso- ciated with greater susceptibility and HDL-C being protective (Table 3).
Receiver operating characteristic curve analy-sis of the indexes
This study also plotted receiver operating char-acteristic (ROC) curves to analyze the predic-tive value of the above indexes for NAFLD (Table 4). ROC curves of BMI and TG/HDL-C ratios were found to effectively identify patients with NAFLD. BMI had an area under the curve
of 0.776, sensitivity of 42.6%, and specificity of
90.4%, with a cut-off value of 27.77 (Figure 1). BMI could, thus, be used to diagnose NAFLD (P<0.05), with higher BMIs suggesting the gre- ater likelihood of a patient having NAFLD. TG/
HDL-C ratios gave an area under the curve of
0.733, sensitivity of 41.7%, and specificity of
86.6%, with a cut-off value of 1.58 (Figure 2). TG/HDL-C ratios could, therefore, be used to diagnose NAFLD (P<0.05), with higher TG/ HDL-C ratios indicating the greater likelihood of a patient having NAFLD. The value of the other indexes was lower for diagnosis of NAFLD. Discussion
Fatty liver that does not develop secondary to excessive alcohol consumption is now recog-nized as the most common cause of chronic asymptomatic liver enzyme elevation in the United States and Europe [14]. It has also become prevalent in China following rapid eco-nomic development [15-18], affecting
~5%-24% of the population [19]. Identification of
patients that are at risk of developing steato-hepatitis that may advance to cirrhosis and are associated with the complications of end-stage liver disease remains a challenge. However, non-invasive biomarkers are being developed to replace liver biopsies. Present results indi-cate that male/female ratio, age, height, wei- ght, BMI, systolic pressure, diastolic pressure, ALT, AST, GGT, UA, FPG, TG, and TC were higher in the NAFLD group than the control group, while serum HDL-C was lower. Notably, present data did not reveal a difference in LDL-C be- tween the NAFLD and control groups. The rea-son for this is unclear, although it is possible that a difference in LDL-C between the groups was masked by the numerous other variables being considered. Therefore, multivariate logis-tic regression analysis was used to study the effects of single factors on NAFLD and to improve the reliability of results, following the exclusion of other confounding factors. Results revealed that FPG, BMI, TG, AST, UA, and HDL-C are independent risk factors for NAFLD. A previous 8-year follow-up study that investi-gated prevalence and risk factors for NAFLD in a Chinese population found that 337 partici-pants that did not have NAFLD, at baseline, subsequently developed it. They had greater increases in BMI, serum UA, FPG, and very low-density lipoprotein cholesterol (VLDL), as well as a considerable decrease in high-density lipo-protein cholesterol during the study. In addi-tion, 123 participants that had NAFLD at base-line no longer had it at the end of the follow-up period. These participants had greater reduc-tions in BMI, FPG, TG, TC, low-density lipopro-Figure 1. Receiver operating characteristic curve of
[image:4.612.91.287.68.243.2]BMI for NAFLD patients.
[image:4.612.92.288.300.474.2]tein cholesterol, ALT, AST, and GGT than the other participants [20]. Thus, analysis showed that age, BMI, platelet count, UA, FPG, TG, VLDL cholesterol, HDL cholesterol, ALT, and AST are independent risk factors for NAFLD. FPG is a major risk factor for NAFLD. In this study, the odds ratio of GLU was 1.32. Fur-
thermore, previous findings have shown that
up to 50% of patients with type 2 diabetes mel-litus also have NAFLD, whereas the prevalence of NAFLD is as high as 100% in patients with diabetes mellitus complicated with obesity [21].
BMI is a known independent predictor of the
degree of hepatic fatty infiltration [22]. In this
study, the BMI of the NAFLD group was 26.9± 3.1 kg/m2, while that of the control group was
23.8±3.1, with an odds ratio of 1.29. Iacobellis et al. [23] reported a study of 69 children with
NAFLD, 60% of whom had fibrosis. They found that BMI was the only significant predictor of fibrosis, according to multivariable analysis of
simple clinical parameters. In this study, BMI had an odds ratio of 5.85 for predicting the
presence of fibrosis. NAFLD has been strongly
linked to obesity, with reported prevalences as high as 80% in obese patients, but only 16% in individuals with a normal BMI and no meta-bolic risk factors [24, 25]. Moreover, many re- ports have emphasized the importance of wei- ght loss in controlling progression of NAFLD [26, 27].
Metabolic Syndrome (MS) and NAFLD share associations with diabetes, hypertriglyceride-mia, and obesity. Because metabolic risk fac-tors are so common in patients with NAFLD, NAFLD may be a hepatic manifestation of MS. Indeed, nearly 90% and 33% of NAFLD patients have at least one feature of MS, respectively. Furthermore, the presence of MS increases the risk of NAFLD by 4-11 times and makes its remission less likely [28, 29]. Present results demonstrate that TG and HDL-C are relevant to NAFLD. High TG was associated with suscep-tibility to NAFLD, while HDL-C appeared to be protective. Consistently, a previous study also revealed that hypertriglyceridemia and low HDL-cholesterol were present in 62% and 54% of NAFLD patients, respectively [30].
In the present study, AST was also associated with presence of NAFLD, However, ALT was not
incorporated into the final regression equation and further studies are needed to confirm the
roles of ALT in the development of NAFLD. High liver enzymes are detected in approximately
20% of NAFLD patients [31], reflecting non-spe
-cific hepatocellular damage. In NAFLD/NASH,
aminotransferase levels may be two to four times higher than the upper limit of the refer-ence range [32]. Elevations in liver enzymes have, therefore, been used as non-invasive indicators of NAFLD [33, 34].
Present data indicates a strong association between high serum UA concentrations and the presence of NAFLD. Hyperuricemia is known to
significantly increase the risk of NAFLD and
insulin resistance. Wan et al. analyzed the impact of UA on the development of hepatic steatosis and insulin resistance in mice and in
two cell models, HepG2 and L02, finding that
UA regulates hepatic steatosis and insulin
resistance through an NLRP3
inflammasome-dependent mechanism [35]. In addition, Jeffrey examined the association between serum UA and NAFLD in a large population-based study
conducted in the United States, finding that
higher UA was associated with more severe NAFLD on ultrasonography [36]. Association be- tween serum UA and NAFLD may be the result of one or more of several underlying mecha-nisms. Multiple studies have shown that when
UA enters cells via specific transporters it has pro-inflammatory effects. Intracellularly, it can
act as a pro-oxidant, inducing the release of
inflammatory mediators and growth factors
[37, 38]. Furthermore, UA has been shown to
contribute to lipoprotein oxidation and inflam -mation [39, 40], two “stressors” which are thought to play important roles in the develop-ment and progression of NAFLD.
ROC curves were used to determine the predic-tive values of biochemical indexes for NAFLD. Results showed that BMI and TG/HDL-C ratios could be used to diagnose NAFLD. HDL-C, TG, and other lipid metabolism indexes can be used to predict occurrence of NAFLD. However, the use of HDL-C and TG as early diagnostic indicators of NAFLD has shortcomings, such as
large numerical changes, difficulty in grading,
controllable and the number of factors influenc -ing it is smaller.
There were several limitations to the present study. First, biomarkers were not measured on multiple occasions to assess the relationship between changes in these parameters and pro-gression of NAFLD. Second, samples were col-lected and measured at a single institution. Biomarker values will likely be slightly different in other populations and regions. Third, a lack of information regarding lifestyle and diet may
have influenced the relationship between bio -markers and NAFLD. However, despite these limitations, this study provides an extensive and complete dataset regarding the relation-ship between a wide range of potential risk factors, particularly serum biomarkers, and NA-
FLD. In conclusion, the present study identified
risk factors for NAFLD in a Chinese population that may be useful in risk analysis for the devel-opment of NAFLD in patients.
Acknowledgements
We gratefully acknowledge the staff that par-ticipated in this study. This work was supported
by Changji Scientific Research and Technology
Development Project of China (No. 2016 ZY-18).
Disclosure of conflict of interest
None.
Address correspondence to: Dr. Li Xue, Laboratory
Medicine Diagnostic Centre, The First Affiliated
Hospital, XinJiang Medical University, 137, Liyushan South Road, Xin’shi Region, Urumuqi 830011, XinJiang, China. Tel: 86-18099220520; Fax: +86-991-4361445; E-mail: 2579948260@qq.com
References
[1] Zhang Z, Wang J, Wang H. Correlation of blood glucose, serum chemerin and insulin resis-tance with NAFLD in patients with type 2 dia-betes mellitus. Exp Ther Med 2018; 15: 2936-2940.
[2] Willebrords J, Pereira IV, Maes M, Crespo Yan-guas S, Colle I, Van Den Bossche B, Da Silva TC, de Oliveira CP, Andraus W, Alves VA, Coglia-ti B, Vinken M. Strategies, models and bio-markers in experimental non-alcoholic fatty liver disease research. Prog Lipid Res 2015; 59: 106-125.
[3] Milić S, Lulić D, Štimac D. Non-alcoholic fatty
liver disease and obesity: biochemical,
meta-bolic and clinical presentations. World J Gas-troenterol 2014; 20: 9330-9337.
[4] Milić S, Stimac D. Nonalcoholic fatty liver dis -ease/steatohepatitis: epidemiology, pathogen-esis, clinical presentation and treatment. Dig Dis 2012; 30: 158-162.
[5] Ekstedt M, Franzén LE, Mathiesen UL, Thore-lius L, Holmqvist M, Bodemar G, Kechagias S. Long-term follow-up of patients with NAFLD and elevated liver enzymes. Hepatology 2006; 44: 865-873.
[6] White DL, Kanwal F, El-Serag HB. Association between nonalcoholic fatty liver disease and risk for hepatocellular cancer, based on sys-tematic review. Clin Gastroenterol Hepatol 2012; 10: 1342-1359,e2.
[7] Hu XY, Li Y, Li LQ, Zheng Y, Lv JH, Huang SC, Zhang W, Liu L, Zhao L, Liu Z, Zhao XJ. Risk factors and biomarkers of non-alcoholic fatty liver disease: an observational cross-sec-tional population survey. BMJ Open 2018; 8: e019974.
[8] Dunn W, Xu R, Wingard DL, Rogers C, Angulo P, Younossi ZM, Schwimmer JB. Suspected non-alcoholic fatty liver disease and mortality risk in a population-based cohort study. Am J Gas-troenterol 2008; 103: 2263-2271.
[9] Ong JP, Pitts A, Younossi ZM. Increased overall mortality and liver-related mortality in non-al-coholic fatty liver disease. J Hepatol 2008; 49: 608-612.
[10] Targher G, Day CP, Bonora E. Risk of cardiovas-cular disease in patients with nonalcoholic fatty liver disease. N Engl J Med 2010; 363: 1341-1350.
[11] Fitzpatrick E, Dhawan A. Noninvasive biomark-ers in non-alcoholic fatty liver disease: current status and a glimpse of the future. World J Gastroenterol 2014; 20: 10851-10863. [12] Neuman MG, Cohen LB, Nanau RM.
Biomark-ers in nonalcoholic fatty liver disease. Can J Gastroenterol Hepatol 2014; 28: 607-618. [13] Zeng MD, Fan JG, Lu LG, Li YM, Chen CW, Wang
BY, Mao YM; Chinese National Consensus Workshop on Nonalcoholic Fatty Liver Disease. Guidelines for the diagnosis and treatment of nonalcoholic fatty liver diseases. J Dig Dis 2008; 9: 108-112.
[14] Luyckx FH, Lefebvre PJ, Scheen AJ. Non-alco-holic steatohepatitis: association with obesity
and insulin resistance, and influence of weight
loss. Diabetes Metab 2000; 26: 98-106. [15] Liao XH, Cao X, Liu J, Xie XH, Sun YH, Zhong
BH. Prevalence and features of fatty liver de-tected by physical examination in Guangzhou. World J Gastroenterol 2013; 19: 5334-5339. [16] Wang Z, Xu M, Peng J, Jiang L, Hu Z, Wang H,
liver disease in the elderly. Exp Gerontol 2013; 48: 705-709.
[17] Yan J, Xie W, Ou WN, Zhao H, Wang SY, Wang JH, Wang Q, Yang YY, Feng X, Cheng J. Epide-miological survey and risk factor analysis of fatty liver disease of adult residents, Beijing, China. J Gastroenterol Hepatol 2013; 28: 1654-1659.
[18] Xiao SJ, Fu GJ, Lv YL, Zhong XN, Wang RH. Prevalence and risk factors of fatty liver dis-ease in young and middle-aged population: one center study in Southwestern China. J Gas-troenterol Hepatol 2014; 29: 358-364. [19] Amarapurkar DN, Hashimoto E, Lesmana LA,
Sollano JD, Chen PJ, Goh KL; Asia-Pacific Work -ing Party on NAFLD. How common is
non-alco-holic fatty liver disease in the Asia-Pacific re -gion and are there local differences? J Gastroenterol Hepatol 2007; 22: 788-793. [20] Lu ZY, Shao Z, Li YL, Wulasihan M, Chen XH.
Prevalence of and risk factors for non-alcoholic fatty liver disease in a Chinese population: An 8-year follow-up study. World J Gastroenterol 2016; 22: 3663-3669.
[21] Chitturi S, Wong VW and Farrell G.
Nonalco-holic fatty liver in Asia: firmly entrenched and
rapidly gaining ground. J Gastroenterol Hepatol 2011; 26: 163-172.
[22] Popkin BM, Udry JR. Adolescent obesity
in-creases significantly in second and third gen -eration U.S. immigrants: the national longitudi-nal study of adolescent health. J Nutr 1998; 128: 701-706.
[23] Iacobellis A, Marcellini M, Andriulli A, Perri F, Leandro G, Devito R, Nobili V. Non invasive
evaluation of liver fibrosis in paediatric pa -tients with nonalcoholic steatohepatitis. World J Gastroenterol 2006; 12: 7821-7825. [24] Williams CD, Stengel J, Asike MI, Torres DM,
Shaw J, Contreras M, Landt CL, Harrison SA. Prevalence of nonalcoholic fatty liver disease and nonalcoholic steatohepatitis among a largely middle-aged population utilizing ultra-sound and liver biopsy: a prospective study. Gastroenterology 2011; 140: 124-131. [25] Bellentani S, Saccoccio G, Masutti F, Crocè LS,
Brandi G, Sasso F, Cristanini G, Tiribelli C. Prev-alence of and risk factors for hepatic steatosis in Northern Italy. Ann Intern Med 2000; 132: 112-117.
[26] Xu C, Yu C, Ma H, Xu L, Miao M, Li Y. Prevalence and risk factors for the development of nonal-coholic fatty liver disease in a nonobese Chi-nese population: the Zhejiang Zhenhai study. Am J Gastroenterol 2013; 108: 1299-1304. [27] Nishioji K, Sumida Y, Kamaguchi M, Mochizuki
N, Kobayashi M, Nishimura T, Yamaguchi K, Itoh Y. Prevalence of and risk factors for non-alcoholic fatty liver disease in a non-obese
Japanese population, 2011-2012. J Gastroen-terol 2015; 50: 95-108.
[28] Duseja A, Singh SP, Saraswat VA, Acharya SK, Chawla YK, Chowdhury S, Dhiman RK, Jayaku-mar RV, Madan K, Misra SP, Mishra H, Modi SK, Muruganathan A, Saboo B, Sahay R, Upad-hyay R. Non-alcoholic fatty liver disease and metabolic syndrome-position paper of the In-dian national association for the study of the liver, endocrine society of India, Indian college of cardiology and Indian society of gastroenter-ology. J Clin Exp Hepatol 2015; 5: 51-68. [29] Almeda-Valdés P, Cuevas-Ramos D,
Aguilar-Salinas CA. Metabolic syndrome and non-alco-holic fatty liver disease. Ann Hepatol 2009; 8: S18-S24.
[30] Athyros VG, Bouloukos VI, Pehlivanidis AN, Pa-pageorgiou AA, Dionysopoulou SG, Symeonidis AN, Petridis DI, Kapousouzi MI, Satsoglou EA, Mikhailidis DP; MetS-Greece Collaborative Group. The prevalence of the metabolic syn-drome in Greece: the MetS-Greece multicentre study. Diabetes Obes Metab 2005; 7: 397-405.
[31] Gao X, Fan JG; Study Group of Liver and Me-tabolism, Chinese Society of Endocrinology. Diagnosis and management of non-alcoholic fatty liver disease and related metabolic disor-ders: consensus statement from the study group of liver and metabolism. Chinese society of endocrinology. J Diabetes 2013; 5: 406-415.
[32] Fracanzani AL, Valenti L, Bugianesi E, Andreo-letti M, Colli A, Vanni E, Bertelli C, Fatta E, Big-namini D, Marchesini G, Fargion S. Risk of se-vere liver disease in nonalcoholic fatty liver disease with normal aminotransferase levels: a role for insulin resistance and diabetes. Hep-atology 2008; 48: 792-798.
[33] Ruhl CE, Everhart JE. Determinants of the as-sociation of overweight with elevated serum alanine aminotransferase activity in the United States. Gastroenterology 2003; 124: 71-79. [34] Ioannou GN, Boyko EJ, Lee SP. The prevalence
and predictors of elevated serum aminotrans-ferase activity in the United States in 1999-2002. Am J Gastroenterol 2006; 101: 76-82. [35] Wan X, Xu C, Lin Y, Lu C, Li D, Sang J, He H, Liu
X, Li Y, Yu C. Uric acid regulates hepatic steato-sis and insulin resteato-sistance through the NLRP3
inflammasome-dependent mechanism. J Hep -atol 2016; 64: 925-932.
[37] Kang DH, Han L, Ouyang X, Kahn AM, Kanellis J, Li P, Feng L, Nakagawa T, Watanabe S, Ho-soyamada M, Endou H, Lipkowitz M, Abramson R, Mu W, Johnson RJ. Uric acid causes vascu-lar smooth muscle cell proliferation by entering cells via a functional urate transporter. Am J Nephrol 2005; 25: 425-433.
[38] Kanellis J, Watanabe S, Li JH, Kang DH, Li P, Nakagawa T, Wamsley A, Sheikh-Hamad D, Lan HY, Feng L, Johnson RJ. Uric acid stimu-lates monocyte chemoattractant protein-1 pro-duction in vascular smooth muscle cells via mitogen-activated protein kinase and cyclooxy-genase-2. Hypertension 2003; 41: 1287-1293.
[39] Baldwin W, McRae S, Marek G, Wymer D, Pan-nu V, Baylis C, Johnson RJ, Sautin YY.
Hyperuri-cemia as a mediator of the proinflammatory
endocrine imbalance in the adipose tissue in a murine model of the metabolic syndrome. Dia-betes 2011; 60: 1258-1269.
[40] Sautin YY, Nakagawa T, Zharikov S, Johnson RJ. Adverse effects of the classic antioxidant uric acid in adipocytes: NADPH oxidase-medi-ated oxidative/nitrosative stress. Am J Physiol Cell Physiol 2007; 293: C584-596.