Electrical Models of Excitation-Contraction
Coupling and Charge Movement in Skeletal Muscle
R. T . M A T H I A S , R. A. L E V I S , a n d R . S. E I S E N B E R G From the Department of Physiology, Rush University, Chicago, Illinois 60612
A B ST R A C T The consequences of ionic current flow from the T system to the sarcoplasmic reticulum (SR) of skeletal muscle are examined. The Appendix analyzes a simple model in which the conductance gx, linking T system and SR, is in series with a parallel resistor and capacitor having fixed values. The conductance gx is supposed to increase rapidly with depolarization and to decrease slowly with repolarization. Nonlinear transient currents computed from this model have some of the properties of gating currents produced by intra- membrane charge movement. In particular, the integral of the transient current upon depolarization approximates that upon repolarization. Thus, equality of nonlinear charge movement can occur without intramembrane charge move- ment. A more complicated model is used in the text to fit the structure of skeletal muscle and other properties of its charge movement. Rectification is introduced into gx and the membrane conductance of the terminal cisternae to give asymmetry in the time-course of the transient currents and saturation in the curve relating charge movement to depolarization, respectively. The more complex model fits experimental data quite well if the longitudinal tubules of the sarcoplasmic reticulum are isolated from the terminal cisternae by a sub- stantial resistance and if calcium release from the terminal cisternae is, for the most part, electrically silent. Specific experimental tests of the model are proposed, and the implications for excitation-contraction coupling are discussed.
T h e steps by which a voltage change across the surface m e m b r a n e initiates contraction in skeletal muscle include m a n y unknowns. These unknowns persist despite the large body of experimental information describing the structural, electrical, a n d mechanical aspects of excitation a n d contraction (Costantin, 1975; Endo, 1977; Caputo, 1978; Liittgau and.Moisescu, 1978).
T h e step that links a voltage change across the m e m b r a n e of the T system to the release of calcium ions from their internal store in the sarcoplasmic reticulum (SR) is not understood, even though the experimental evidence available is extensive, a n d only a few mechanisms seem possible.
Three types of mechanism were considered soon after discovery of the T system, the SR, a n d the T - S R j u n c t i o n : Peachey arid Porter (1959), elaborated in Birks (1965), Freygang (1965), a n d Peachey (1965 a, p. 228-230), suggested that ionic current might flow from T system to SR, spreading the m e m b r a n e potential change into the SR much as an action potential is spread down the J. GEN. PHYSIOL. (~) T h e Rockefeller University Press 9 0022-1295/80/07/0001/31 $1.00 1
V o l u m e 76 J u l y t980 1-31
on January 5, 2005
www.jgp.org
2 T H E J O U R N A L O F G E N E R A L P H Y S I O L O G Y 9 V O L U M E 7 6 9 1 9 8 0 length of a muscle fiber. Ford and Podolsky (1972), following the lead of Bianchi a n d Shanes (1959), postulated that a small a m o u n t of calcium might cross from the t u b u l a r lumen into the gap between T system and SR, the calcium being a transmitter that triggers massive calcium release from the SR. Hodgkin and Horowicz (1960), and then Adrian et al. (1969), suggested that a change in potential across the T-system m e m b r a n e might release an activator substance, which, in turn, would induce calcium release.
T h e activator hypothesis has received m u c h attention. It has been expanded by Schneider and C h a n d l e r (1973) and by C h a n d l e r et al. (1976 b) into a model that includes the properties of nonlinear charge movement. T h e model supposes that the m o v e m e n t of a charged macromolecule e m b e d d e d in the T- system m e m b r a n e controls the opening of a calcium channel in the SR some 20 n m distant. T h e mechanism of coupling between charge m o v e m e n t and calcium release emphasized in the model (Chandler et al., 1976 b; Fig. 11) is simple mechanical coupling. A "rigid rod" is supposed to link the motion of a voltage sensor in the T-system m e m b r a n e to the motion of a gate, which controls the flow of calcium through a channel in the SR membrane. T h e voltage-sensing charged macromolecule and rigid rod serve as the activator molecule originally proposed by Hodgkin and Horowicz (1960): the rigid rod allows the calcium channel of the SR to be remotely controlled by the voltage sensor in the T-system m e m b r a n e .
T h e r e is some structural evidence consistent with the rigid rod hypothesis. Bridges or pillars connecting T system and SR, suggested by Porter and Franzini-Armstrong (1965, p. 77), have now been seen by Somlyo (1979), B. Eisenberg and Gilai (1979), and B. Eisenberg et al., (1979). (See also Figs. 11 and 12 of Kelly and Kuda, 1979.) But the structural evidence does not provide strong support for a mechanical link between T system and SR. O n e can just as well suppose that other mechanisms (such as chemical diffusion; see C h a n d l e r et al., 1976 b, p. 314) provide the action at a distance required to remotely control calcium release.
An important feature of all models invoking remote control is that a change in potential across the SR m e m b r a n e is not the cause of calcium release. A change in that potential might well be induced by calcium release, but calcium release occurs in these models even if the potential across the SR m e m b r a n e s is held at its resting value.
T h e r e is some reason to disbelieve each of the above hypotheses, and little direct evidence for any of them. T h e trigger calcium hypothesis appears incompatible with experimental data on the effects of extracellular calcium (e.g., Spiecker et al., 1979; Ldttgau and Spiecker, 1979). T h e "remote control" hypothesis describes a great deal of data; but it is a novel mechanism without precedent in other tissues. Furthermore, remote control models need modifi- cation if the normal mechanism of calcium release is similar to that found in skinned fibers (Endo, 1977), namely, if normal release is the result of a change in SR potential.
T h e hypothesis of electrical coupling has been discounted (Peachey, 1968; Franzini-Armstrong, 1970, 1971, and 1974) for a n u m b e r of reasons:
on January 5, 2005
www.jgp.org
MATHIAS ET AL. Excitation-Contraction Coupling and Charge Movement in Muscle
(a) T h e j u n c t i o n between the T system and SR is impermeable to molecules visible in the electron microscope.
(b) T h e structure of the j u n c t i o n between T system and SR was thought to consist of diffuse material (feet), bearing no resemblance to the structure of the gap junctions, which are likely to be the path for current flow between electrically coupled cells. This objection is weakened by the recent observation of electron-lucent pillars connecting T system and SR, mentioned just above. (c) T h e effective capacitance of resting muscle fibers is much smaller than the contribution usually expected from the membranes of the SR. Conversely, it has been thought that the capacitance of the SR membranes would severely " l o a d " the action potential, drastically reducing its rate of rise and conduction velocity.
(d) It has been supposed that the potential change within the SR produced by current flow from the T system would necessarily be too small to trigger calcium release. Some have thought that amplification of SR potentials by changes in ionic conductances would produce an "all-or-none" release of calcium, in conflict with the experimental finding that the contraction of a single myofibril is graded by T-system potential (Costantin and Taylor, 1973; Costantin, 1975, p. 212).
(e) Current flow into the SR has been considered an unlikely explanation for certain of the nonlinear electrical properties of skeletal muscle, particularly the nonlinear transient properties called charge movement (Chandler et al.,
1976 a; Adrian and Almers, 1976 a and b).
In this paper we examine in detail the hypothesis (mentioned in Franzini- Armstrong, 1971, p. 202, and in Huxley, 1971, p. 14) that a transient ionic current might couple T system and SR (Fig. 1). We show that this hypothesis, in suitable form, can survive the above criticisms. It is consistent with the electrical properties and action potential of skeletal muscle and can account for m a n y aspects of excitation-contraction coupling. We are unaware, how- ever, of convincing evidence that ionic current actually flows between T system and S R in skeletal muscle; new experiments are needed to settle this point.
B A C K G R O U N D A N D P R O C E D U R E
Electrical Properties
Our procedure is to construct a circuit model, compatible with the known morphology of a skeletal muscle fiber, which includes current flow from T system, across the T-SR junction into the Sl~-(see Figs. 1 and 2). We adjust the paramdters of the model to predict the measured electrical properties of skeletal muscle as well as possible, particularly the nonlinear "capacitive" properties recently reviewed by Almers (1978). Two kinds of current flow occur across membranes: one is produced by the movement of ions across the membrane and therefore is called ionic or transmembrane current; the other is called capacitive or intramembrane current because it is produced by the accumulation and depletion of net charge on' either side of the membrane, without the transfer of ions across the membrane. Capacitive current is most easily measured in preparations treated with blocking agents that remove transmembrane
on January 5, 2005
www.jgp.org
T H E J O U R N A L O F G E N E R A L P H Y S I O L O G Y 9 V O L U M E 7 6 9 1 9 8 0
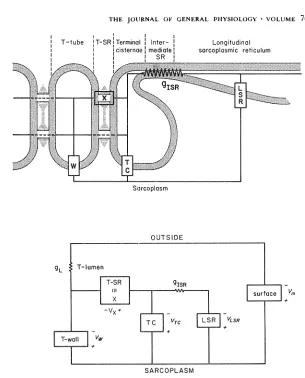
FIGURE 1. T h e circuit model. T h e upper panel shows a circuit model of the tubular system, terminal cisternae, and sarcoplasmic reticulum of skeletal mus- cle. T h e properties of specialized structures are indicated by boxes and are identified in more detail in Fig. 2 and in the text. Noteworthy features of the model are the presence of a conductive path gx for ionic current flow from the lumen of the T system to the terminal cisternae and the presence of a substantial resistance 1/glsR iso|ating terminal cisternae from the longitudinal sarcoplasmic reticulum. T h e lower panel shows the circuit representation of a complete fiber, including the luminal conductance of the T system and the properties of the surface membrane. In our corfiputations the T system is treated as a lumped circuit element; distributed properties are approximated by including gL. This approximation will not be particularly accurate at very short times or during an action potential.
currents. Because capacitive current represents i n t r a m e m b r a n e charge movement (by definition), the capacitive charge that moves after a depolarizing step in potential must equal the capacitive charge that flows after repolarization to the resting potential. This property is not expected in ionic currents, and, therefore, the equality
on January 5, 2005
www.jgp.org
[image:4.612.149.454.93.471.2]MATHIAS ET AL. Excitation-Contraction Couphng and Charge Movement in Muscle
of O N and O F F charge movements is one of the defining features of capacitive c u r r e n t s .
T h e capacitive current across single m e m b r a n e s has several components. One component would be present if the m e m b r a n e were replaced with a vacuum. T h a t c o m p o n e n t is called pure displacement current and can be described by a capacitance of ~0.1 # F / c m 2 in a m e m b r a n e 8 nm thick. Pure displacement current flows at the speed of light; and it is strictly linear, showing no saturation. O t h e r components of capacitive current are called polarization currents and are modulated by the move- ment of charges and molecules bound within the membrane. T h e ratio of the total capacitive current (polarization plus pure displacement) to the pure displacement current is the relative dielectric constant, ranging from a value near 2 for pure lipids to a value of 80 for water. Polarization currents are nonlinear and show saturation at large electric field strengths. T h e time-courses of such currents m a y be determined by
_L
"Ca" counter "Ca" counter
ion ion
[image:5.612.160.451.280.448.2]elements of passive model - - additional elements in active model
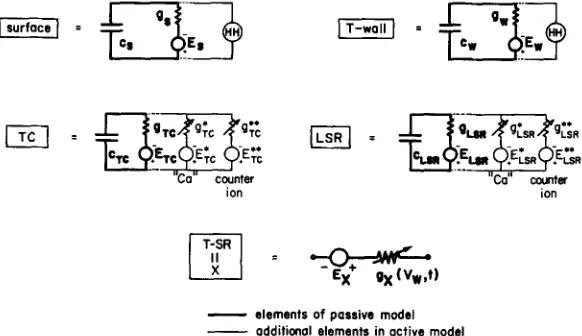
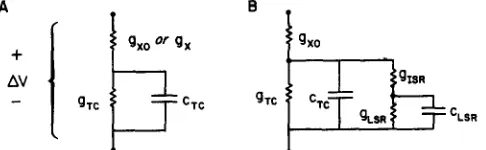
FIGURE 2. Description of the membranes of the circuit model. Each m e m b r a n e is represented as a fixed (voltage-independent) capacitance in parallel with ionic pathways. In the passive model, the ionic p a t h w a y is a conductance in series with a battery. In the active model, a conductance for Ca ++ and a counterion are included in the m e m b r a n e s of the terminal cisternae and longitudinal SR. T h e circle containing H H represents the Hodgkin and Huxley conductances for Na + and K § as modified by Adrian and Peachey (1973) for skeletal muscle. These H H conductances are used only in the computations of the action potential shown in Fig. 6.
the probability of a change of conformation in m e m b r a n e macromolecules or by the speed of m o v e m e n t o f charges trapped within the membrane.
T h e movement of a large charged group within the m e m b r a n e has long been a candidate for the voltage sensor that controls the ionic conductances underlying the action potential (Hodgkin and Huxley, 1952). For that reason, Schneider and Chandler (1973), Armstrong and Bezanilla (1974), and Keynes and Rojas (1974) introduced an experimental paradigm to unveil the "gating" currents expected from m o v e m e n t of a voltage sensor. Such gating currents are nonlinear polarization currents defined by several properties. T h e integrals of such currents (i.e., the charge move- ment) will be equal during a depolarization and subsequent repolarization to the
on January 5, 2005
www.jgp.org
6 T H E J O U R N A L O F G E N E R A L P H Y S I O L O G Y , V O L U M E 7 6 9 1 9 8 0 initial potential. Such currents are expected to show substantial nonlinearity in the voltage range in which the ionic conductance is nonlinear, namely, a threefold change in conductance for about a 5-mV change in potential, which corresponds to a change in electric field of tens of thousands of volts per centimeter in a m e m b r a n e 8 nm thick.
T h e paradigm introduced is a pulse schedule that removes displacement and linear polarization currents, thus unveiling gating currents previously hidden within the total transient current. T h e paradigm involves two measurements. T h e first measure- ment estimates the linear transient currents thought to be irrelevant to the gating process and is made at a potential at which the residual (unblocked) ionic current is expected to be resistive and linear, and at which the nonlinear component of polarization is expected to be absent. T h e second measurement is made in the range of voltages in which both linear and nonlinear polarization currents should be present. Subtraction of the two measurements, after scaling for any difference in size of applied voltage, gives estimates of the physiologically interesting nonlinear charge movement. If the residual ionic current is in fact linear, as was assumed, and if the O N charge movement equals the O F F charge movement, the subtracted records are used directly to measure gating or nonlinear polarization current. If the residual ionic current is nonlinear, measures are taken to separate the nonlinear polarization current from the nonlinear ionic current. If the O N charge movement does not equal the OFF, it has sometimes been shown (Armstrong and Benzanilla, 1977) that part of the charge movement has become immobilized or too slow to observe experimentally.
Computations
We compute the electrical properties of a circuit model (Mathias, 1979) that might represent a skeletal muscle fiber. T h e circuits are solved by analytical techniques when appropriate (see the Appendix). Straightforward numerical methods are used in other cases. Starting from the initial conditions, we compute the potentials and currents at later times by simple iteration of steps in time At, replacing derivatives by first order forward differences. T h e step size At was decreased until results were insensitive to further reduction.
Nonlinear conductances of the surface and T-system membranes are described by the kinetic schemes introduced by Hodgkin and Huxley (1952) as used for skeletal muscle by Adrian and Peachey (1973). T h e conductances and equilibrium potentials are indicated by the abbreviation H H in Fig. 2. T h e nonlinear conductances of the T - S R junction and SR m e m b r a n e s are computed using simpler analytical descrip- tions, which seemed better suited for selection of optimal parameters than the Hodgkin-Huxley formulation. Fig. 3 illustrates m a n y of the properties of the hypo- thetical channel g~, at the T - S R junction, using variables described in Eqs. 2-8.
T h e nonlinear time-dependent ionic current through the T - S R j u n c t i o n is described by a scaling conductance gx; a rectification factor ~(Vx) describing the nonlinearity of the instantaneous current voltage" relation; a probability density function
px( Vw, t)
for the conducting state; and a probability density function
plx(Vw, t)
for an intermediate nonconducting state. T h e probability density functions are determined byax(Vw),
the probability, per unit time, of a change in state, and Nx(Vw), the fraction of the total n u m b e r of channels able to open at voltage Vw. 1Variables of the same form were used to describe the nonlinear conductances of the SR membranes in the active and passive models (Figs. 2 and 5 C).
on January 5, 2005
www.jgp.org
MATHIAS ET AL. Excitation-Contraction Coupling and Charge Movement in Muscle T h e current is then
is(t, Vw, Vx) = {gx~( Vx)p.(t, Vw) + g.o}{ V . - E~}Agx(t, V){ V ~ - s (t) where Ex is the equilibrium potential of the pathway. Note that the conductance g. is controlled by the potential in the T system. In other computations, not illustrated in this paper, g. was controlled by the potential across the T - S R junction. Because there were no significant differences in the results of the calculations, only the former
gX (t ,Vw) rnmho/cm m
1.2
0,9
O.e
;
gxo~0.3
~'o Jo
T I M E ( m s )
-2O Vm(mY), j- - - l _ _
-I00 15Oral
I I I 9 120 140 160 t
B ( x { V x )
. . . RC2.3
.... ~ 2 . 0 1 . 5
-~o -~o -~o go
V x ( m v )
-I00 -CO -60
-40
-20V w ( m V )
N x ( V w) "1.2
I.O .. . .
-o8
-os
-OA
[image:7.612.162.455.214.439.2]i 20
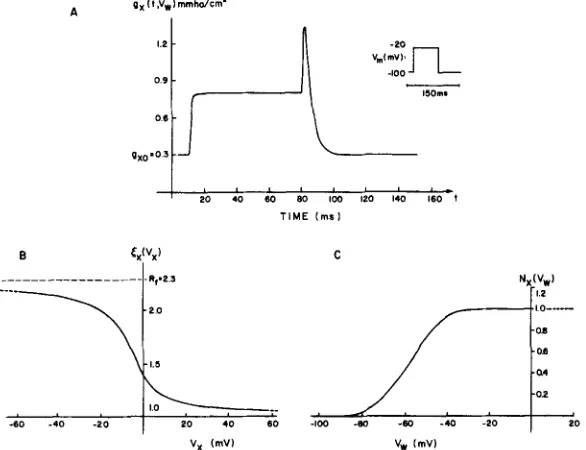
FIGURE 3. T h e time a n d voltage dependence of the ionic p a t h w a y postulated from T system to SR. A shows the time-course of the conductance g, for the step of potential (of 70 ms duration and height AI/") illustrated symbolically. Note the rapid increase in the conductance and the rather slower decline (more evident in Fig. A 2). A j u m p in the conductance occurs when the pulse is turned off because of instantaneous rectification, which depends, in effect, on the direction of current flow. B and C illustrate the functions that describe the instantaneous and time-dependent rectification ofg~, respectively, as described in Eqs. 1-8.
are presented here. T h e probability density functions are defined by
d/~x
- - - - - - a x ( V w ) (px - - p l y ) dt
dpx~
- - - ax(Vw){p]x - Nx(Vw)}. dt
(2)
(3)
T h e probability of a change in state ranges from ami~ to amax and has voltage dependence determined by the constant K..
a m a x ~ a m i n
a~(V~) -- a~i~ + l'+ exp((P. -
Vwl/K.}
(4)on January 5, 2005
www.jgp.org
8 THE JOURNAL OF GENERAL PHYSIOLOGY 9 VOLUME 76 9 1980 T h e v o l t a g e d e p e n d e n c e o f t h e n u m b e r o f o p e n c h a n n e l s is d e s c r i b e d b y
N~(Vw) -- 1 + e x p { ( ITs -- V w ) / K ~ } (5) N o t e t h a t p~(oo, Vw) = N~(Vw) or, in o t h e r words,
g~(o0, Vw) ---* gxNx(Vw), as t ~ o0 if ,~ = 1. (6) T h e i n s t a n t a n e o u s r e c t i f i c a t i o n is d e t e r m i n e d b y
{ 1 1 / ( R f - 1 ' ~ 2 ( 4 , 2 + } .
~x(V) - R f + 1 1 + - - - 1 + 2q,) (7)
---5--
4, 4,
\R-5-T-F/
T h i s h y p e r b o l i c d e f i n i t i o n o f r e c t i f i c a t i o n d e p e n d s o n t h e a b s o l u t e v a l u e o f p o t e n t i a l s , a n d , therefore, t h e e x p r e s s i o n (Eq. 7) s h o u l d be e v a l u a t e d in t h e form p r e s e n t e d . T h e
T A B L E I
L I N E A R O R R E S T I N G M U S C L E P A R A M E T E R S
Capacitance Conductance Equilibrium potential
IsF/crn 2 I~mho / crn ~ m V
Fiber cen = 7 gen = 330 E~t = - 9 0
Surface membrane ca= 1 g~= 140 E~=-90
Isolation --- gL = 650 ---
T-system membrane Cw = 4.5 g~ = 30 E . = - 9 0
Isolation --- g~o = 300 E~ ~ - 9 0
Membranes of terminal cis- C T C = 8 gTC=250 E'rc=0 ternae
Isolation --- gISR = 100 ---
Membranes of longitudinal cusR=30 g~R=700 ELSR~0 SR
Values are computed for the area of structure associated with 1 cm 2 of outer surface, assuming the muscle fiber is a right circular cylinder of radius a = 40/tm.
r e c t i f i c a t i o n factor Rf is
Rf -- g~( V, oo)m.x
gx( V, m ) , ~ " (8)
T h e n o r m a l i z e d p o t e n t i a l is 4, = ( V - V)/K, w h e r e K sets t h e p o t e n t i a l r a n g e , in m V , o v e r w h i c h ~, c h a n g e s from 1 to Rf. P is t h e p o t e n t i a l , in m V , a b o u t w h i c h t h e r e c t i f i c a t i o n is c e n t e r e d .
T h e p a r a m e t e r s o f t h e m o d e l s h o w n in T a b l e s I a n d II seem to o p t i m i z e t h e fit b e t w e e n t h e o r y a n d e x p e r i m e n t , t h e o p t i m i z a t i o n b e i n g d o n e b y h a n d . T h e m o r p h o - m e t r i c p a r a m e t e r s o f t h e m o d e l were c o n s t r a i n e d to t h e v a l u e s m e a s u r e d b y M o b l e y a n d E i s e n b e r g (1975). C o n s t r a i n t s were p l a c e d o n t h e electrical p a r a m e t e r s : t h e specific c a p a c i t a n c e o f m e m b r a n e s was r e q u i r e d to b e close to 1 ~ F / c m 2 ; t h e specific c o n d u c t a n c e o f m e m b r a n e s was less c o n s t r a i n e d b u t was kept b e t w e e n 7 a n d 300 / ~ m h o / c m 2. A s u i t a b l e o p t i m i z a t i o n p r o g r a m m i g h t c o n c e i v a b l y reveal q u i t e d i f f e r e n t sets o f p a r a m e t e r s c o m p a t i b l e w i t h e x p e r i m e n t .
R E S U L T S
T h e r e s u l t s o f o u r c a l c u l a t i o n s a r e a set o f c u r v e s t o b e c o m p a r e d d i r e c t l y w i t h e x p e r i m e n t a l d a t a o f S c h n e i d e r a n d C h a n d l e r ( 1 9 7 3 ) , C h a n d l e r e t a l . , ( 1 9 7 6
on January 5, 2005
www.jgp.org
M A T H I A S ET AL. Excitation-Contraction Couphng and Charge Movement in Muscle 9
a), and Adrian and Almers (1976 a and b). We choose to fit electrical data because it has been taken as the main evidence against ionic current flow from T system to SR. Such data depend primarily on the early st'ages of excitation-contraction (EC) coupling, but are physically, mechanistically, and temporally distant from the later stages. It is not surprising that our analysis becomes progressively more difficult, arbitrary, and perhaps unconvincing as we move from the T system to the terminal cisternae and then into the longitudinal SR.
T h e choice of experimental data is somewhat arbitrary since so m u c h descriptive information is available concerning EC coupling. M u c h of that d a t a is indirect, however, involving measurements of tension that are the o u t c o m e of u n k n o w n mechanisms in the filaments and cross-bridges as well as
T A B L E I I
N O N L I N E A R P A R A M E T E R S
Instantaneous Recitification
T e r m i n a l c i s t e r n a e T - S R j u n c t i o n
~ve (Vvc) ~, (V.)
Rf, unitless 2.5 2.3
V', m V 70 0
~, rn V - 2 3
Time-dependent Recitification
Nx (Vw) ax (Vw)
R a t e c o n s t a n t s , s -1 --- a m i n ~ 3 5 0
--- a , , . ~ 2 , 2 2 0 0
fd, mV - - 6 5 - - 5 5
x, rnV 8 9.5
T h e scaling parameter ~ , = 5 0 0 # m h o / c m 2.
V a l u e s are computed for the area o f s t r u c t u r e a s s o c i a t e d w i t h 1 c m 2 o f o u t e r s u r f a c e , a s s u m i n g t h e m u s c l e f i b e r is a r i g h t c i r c u l a r c y l i n d e r o f r a d i u s a = 40 # m .
EC coupling. Indirect d a t a cannot be used to analyze EC coupling unless the contribution of contractile processes is known.
We have also chosen to ignore some electrical phenomena, namely, multiple components of charge m o v e m e n t and the slow p h e n o m e n a , called inactivation, reactivation, a n d / o r repriming, because they almost certainly involve multiple processes known too vaguely to model (Chandler et al., 1976 b; Adrian et al., 1976; Adrian and Rakowski, 1978; Rakowski, 1978; Adrian and Peres, 1977 and 1979; Adrian, 1978).
T h e p h e n o m e n a we seek to explain are:
(a) T h e linear electrical properties o f a muscle fiber, in particular the effective capacitance of ~7 #F and an effective resistance of ~3 kohm for each cm 2 of outer surface in a fiber of 40 #m radius at a sarcomere length of 2.5 #m (Valdiosera et al., 1974; Hodgkin and Nakajima, 1972 a and b; Schneider and Chandler, 1976; C h a n d l e r and Schneider, 1976).
(b) T h e control of calcium release by the potential across the T-system m e m b r a n e . Calcium release can be t u r n e d on a n d turned off by changes in T-
on January 5, 2005
www.jgp.org
1 0 T H E J O U R N A L O F G E N E R A L P H Y S I O L O G Y 9 V O L U M E 7 6 9 1 9 8 0 system potential u n d e r a variety of experimental conditions (Costantin, 1975; Endo, 1977; Caputo, 1978).
(c) T h e change in SR potential when a potential is applied across the surface membrane. If calcium release is to be produced by a voltage-dependent change in the properties of the SR membrane, as in the models considered here, there must be a reasonable change in SR voltage when the T system is depolarized.
(d) T h e time-course, amount, and voltage dependence of the nonlinear transient currents described as charge movement. These should have a natural role in the model, we hope as a direct part of EC coupling.
(e) T h e time-course, amplitude, and rate of rise of the muscle action potential.
Models
We have considered m a n y forms of the circuit model shown in Figs. 1 a n d 2. T h e Appendix (Fig. A l) presents the simplest situation, in which gx is the only time- or voltage-dependent conductance in the circuit: all membranes are treated as linear constant elements. C h a n d l e r et al. (1976 a, Figs. 16 and 17) have considered similar simple models but with different properties of gx.
T h e properties of gx assumed in that paper did not produce equality of the
nonlinear charge m o v e m e n t at the O N and O F F of a depolarizing pulse. We suppose that the conductance linking T system and SR increases rapidly soon after a depolarization and decreases slowly after a subsequent repolari- zation (Fig. A 2). T h e circuit shown in Fig. A 1, with the properties of gx shown in Fig. A 2, we call the "linear" model. W h e n compared with experi- mental data, the linear model differs in two ways. (a) If charge is plotted as a function of voltage, the curve is found to bend but not saturate at large
depolarizations (Fig. A 3). (b) T h e assumed properties of gTC and gx imply
(through Eqs. A 2 and A 3) that the time-course of the O N and O F F transient currents are similar; the OFF charge m o v e m e n t is not faster than the ON. (In the linear model the c o n d u c t a n c e gTc is constant, and the conductance gx is supposed to remain large for a long time after repolarization (see Fig. A 2). Thus, the time-course of the O F F transient is determined in large measure by the same p a r a m e t e r values that determine the time-course of the O N tran- sient.)
T h e linear model does not include processes quite likely to be present in the real SR. In particular, it is likely (Endo, 1977; Stephenson, 1978) that the SR includes a voltage-dependent calcium conductance. An "active" model was therefore constructed, which includes time- and voltage-dependent conduct- ances as shown in Fig. 2. This model was analyzed i/a some detail and conclusions from that analysis are described in the Discussion. T h e properties of the "passive" model, described below, could be m a d e similar to those of the active model. For that reason, the calculations on the more complex and arbitrary active model are not presented here. T h e passive model, defined by the heavy lines in Fig. 2, includes instantaneous rectification in gx and gTC (see Figs. 3 and 5"C), which produces, respectively, (a) a faster time-course of the O F F transient than the O N transient and (b) saturation in the curves relating charge to voltage.
on January 5, 2005
www.jgp.org
MATHtAS ET AL. Excitation-Contraction Coupling and Charge Movement in Muscle 11
Elements of the Passive Model.
Fig. 3 shows the voltage and time dependence that we have assigned to g~ in the passive model to c o m p u t e the nonlinear charge movement shown in Fig.
4. T h e abrupt increase in g~(t, Vw) after repolarization (Fig. 3 A) is a
consequence of the instantaneous rectification function ~x(Vx) shown in Fig. 3 B. T h e instantaneous rectification in g~ allows inward current to flow more
easily than outward. Because gx is m u c h more conductive during the O F F
phase o f charge movement, the time constant for the O F F transient current is faster than that for the ON, as predicted semiquantitatively by Eq. A 3. However, ifgx is more conductive during the O F F phase of charge movement, Eq. A 4 or A 7 predicts an increase in Qa,fr without an increase in Qon. Such an increase is not found experimentally. To reconcile theory with experiment, we adjust the rate constant for the turn offofgx. We use a value ofami~ (Table II and Eq. 4) faster than that used in the Appendix (cf. Figs. 3 A and A 2). In this m a n n e r , some of the charge m o v e m e n t that would otherwise flow through gx is cut off. Thus, the time-course of Qoer depends, in part, on the speed with which gx turns off. This procedure m a y seem quite arbitrary and delicate, requiring an artificial and unlikely balance between arnm and ~x, but such is not the case. T h e ratio of O N to O F F charge m o v e m e n t is near unity for a wide variation in either parameter. In this regard, one should also be aware that the experimental values of Q0n/Qofr often differ noticeably from unity.
In Fig. 3 C we show the sensitivity function N~(Vw) for the fraction of channels that eventually would become conductive at a given T-system potential. Note that the change from the resting to the more conductive state is a function o f the T-system potential Vw, while the instantaneous rectification depends on V~. We m a d e the second choice on the presumption that the instantaneous rectification would be a function of current flow through the channel; the first choice is arbitrary because we do not know which voltage is sensed by, a n d thereby controls, the time-dependent component o f the con- d u c t a n c e gx.
Nonlinear Transients in the Passive Model
Fig. 4 is a compilation of our results, comparable and similar to the experi- mental d a t a we have tried to describe. T a b l e I presents the linear parameters used in these computations. T h e specific capacitance of the m e m b r a n e of the T system a n d longitudinal SR was taken to be 1.0 # F / c m 2, and the specific capacitance o f the m e m b r a n e of the terminal cisternae was 0.74 g F / c m 2, using the estimates of m e m b r a n e areas given by Mobley and B. Eisenberg (1975). Computations using a specific cal3acitance of 0.9 # F / c m 2 for all membranes can give almost the same results.
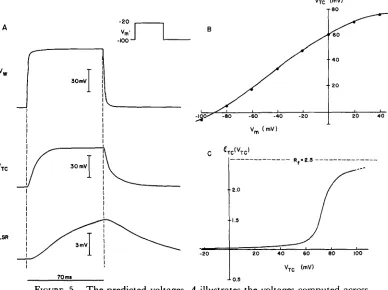
T h e resting effective resistance of this theoretical fiber (radius, 40 #m) was about 3 k o h m - c m 2, referred to the outer surface of the fiber 2(see Table I and Eq. A 3). T h e resting effective input capacitance is ~7 p F / c m of outer surface (see T a b l e I a n d Eq. A 6). Fig. 4 A is the time-course of charge m o v e m e n t for steps of m e m b r a n e potential from a holding potential o f - 1 0 0 inV. Fig. 4 B, C, and D summarize several properties of the charge movements shown in Fig. 4 A.
on January 5, 2005
www.jgp.org
12 T H E J O U R N A L O F G E N E R A L P H Y S I O L O G Y , V O L U M E 76. 1980 Fig. 4 B shows t h e d e p e n d e n c e o f c o m p u t e d c h a r g e m o v e m e n t on t h e p o t e n t i a l across t h e s u r f a c e m e m b r a n e . W e see t h a t t h e passive m o d e l c a n p r o d u c e n o n l i n e a r c h a r g e m o v e m e n t t h a t s a t u r a t e s . T h e s a t u r a t i o n o f c h a r g e m o v e m e n t is p r e d i c t e d in a s e m i q u a n t i t a t i v e m a n n e r b y Eq. A 7, w h i c h shows
v m , ~
-100 mV AV m mV
A 2O B
40
6o
100 - ~
120 " ~
140 ~
V
/
/
25ms
AQ (n C/p.F) 3o o
-,oo ~o-~o ' ' '
v m (mY)
Ageff (mmho/cm = )
If>
.I= - ~ , i i i i I
-~oo -80 4 o -4o -2o | 20 40 V m (mY)
"r-' (ms)
~
i 0"2 0 0 0
;o'o~o'
'o ,o~o;oVrn (mY)
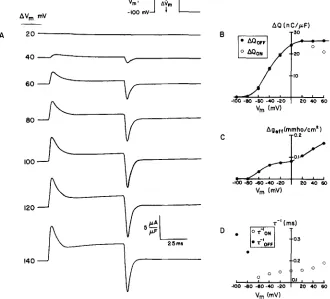
FIGURE 4. T h e predicted nonlinear transient currents. These records are to be directly c o m p a r e d with the experimental results of Chandler et al., 1976 a, and Adrian and Almers, 1976 a and b. T h e currents shown in A are the sum of the currents produced by the pulse shown (of 70 ms duration and height AV) and a pulse of the same size in the hyperpolarizing region. Because the circuit elements are assumed to be independent of voltage in the hyperpolarizing region, the summation emphasizes the nonlinear component~ of current. B illustrates the integrals of the transients shown in A, c o m p u t e d after subtraction of a constant baseline. T h e area represented by this procedure is illustrated in Fig. A 2. Note the rough equality of O N and O F F charge and the saturation of charge movement. Because of the slope of the baseline at depolarizations to +20 m V and +40 m V , we underestimate the values of AQo~. T h e solid line is therefore drawn through the filled circles representing ~Qoef. C shows the amount of nonlinear ionic current (graphically identified in Fig. A 2) accompanying the nonlinear transient current. Note the increase in nonlinear ionic current that accompanies the saturation of nonlinear charge movement. D illustrates the estimated time constants of the nonlinear transient currents.
on January 5, 2005
www.jgp.org
[image:12.612.156.486.189.488.2]MATHIAS ET AL. Excitation-Contraction Couphng and Charge Movement in Muscle 13
that an increase in gTC (Fig. 5 C) causes a decrease in ceff (if gx is constant) and, thereby, produces saturation in charge movement. T h e increase in gTC is reflected in the sloping baseline seen in the response to step changes of 120 m V and 140 m V (Fig. 4 A). The increase in gTC also introduces errors in our c o m p u t a t i o n of Qon (because a constant baseline was subtracted before inte- gration). Therefore, we have drawn the solid line in Fig. 4 B through the points representing Qoer, which is a more accurate estimate of the charge movement.
T h e change in input conductance necessary to produce the charge move- ment Fig. 4 A and B is shown in Fig. 4 C. T h e increment in gen between Vm - - 1 0 0 m V and Vm -- - 2 0 m V is almost entirely caused by the increase in gx. T h e increment in geer at potentials (across the surface membrane) more positive than - 2 0 mv is caused by the rectification in gTC. In this voltage range, gx is fully activated (i.e., N~[ Vw] has reached its m a x i m u m value of one), a n d gay begins to increase as a function of VTC. As previously mentioned,
the increase in gTC is reflected in the charge movement transients (Fig. 4 A) as a change in the slope of baseline current (the current labeled A/leak in Fig. A 2). T h e slope of the baseline current is associated with saturation of charge m o v e m e n t and both should occur in the same voltage range (in our passive model c o m p u t e d with the parameters presented in Tables I and II). The situation for more general values of the parameters is discussed in the Appendix, after Eq. A 9.
Experiments on skeletal muscle show a slope in baseline current that has been attributed to the residual potassium conductance not removed (at positive potentials) by the blocking agent applied (usually tetraethylammo- nium ion). In our computations, the nonlinear leakage current, or change in c o n d u c t a n c e Agefr, is less than that found experimentally by Chandler et al. (1976 a, Fig. 6) and by Adrian and Almers (1976 b, Figs. 2, 3, and 8). In our s c h e m e - - t h e passive model with parameters used h e r e - - s o m e fraction of the experimentally observed leakage current would be ascribed to residual ionic current across the t u b u l a r or surface membranes and some to current flow into the SR.
Kinetics of O N and OFF Transients in the Passive and Active Models
T h e rate constants of the charge movement are shown in Fig. 4 D. These have been estimated by plotting the charge movements on semilogarithmic paper and are subject to the same substantial errors as experimental measurements of rate constants, and for the same reasons: the movement of charge during the depolarization is not well described by a single exponential, and the procedure for fitting a single exponential to such records is necessarily arbi- trary. T h e O N rate constants (C)) are c o m p u t e d from the response to steps of potential from a holding potential o f - 100 inV. The O F F rate constants (O) were c o m p u t e d for a step of potential from - 8 0 m V to a positive potential and back to - 8 0 m V (with the appropriate subtraction of the response in the hyperpolarized range of potentials) and for a step from - 1 0 0 m V to a positive potential and back to - 1 0 0 mV. T h e O F F rate contants were insensitive to the positive potential chosen.
on January 5, 2005
www.jgp.org
1 4 T H E J O U R N A L O F G E N E R A L P H Y S I O L O G Y 9 V O L U M E 7 6 9 1980
T h e voltage and time dependence of the experimental O N transient fits naturally with the passive model: the kinetics of the O N transient are a necessary consequence of those features of the passive model introduced to give equality of O N and O F F charge and a saturating dependence of charge m o v e m e n t on voltage (Fig. 4 B). For small depolarizations, the increase in gx (which is a property of all the models considered here; see Figs. 3 C and A 2) produces an increase in rate constant as described by Eqs. A 2 and A 3. For larger depolarizations, the increase in gTc (introduced into the passive model to produce saturation of charge movement at large depolarizations; see Fig. 5 C) becomes significant and produces a progressive increase in the O N rate constant, even in the voltage range in which charge movement has saturated. T h e experimental O F F transient is harder to fit. T h e linear model, presented in the Appendix (Fig. A 3), seriously misfits the O F F kinetics. T h e rather complex properties of gx in the passive model (Fig. 3) allow a reasonable fit, but the reality of such unprecedented and complex properties m a y be doubted. T h e active model introduces voltage- and time-dependent properties into the conductance gTc to achieve a good fit of the O F F response. In the active model, which is not presented in detail here, the conductance for counterions (labeled g'rc** in Fig. 2) was m a d e to turn off more slowly with repolarization than the calcium conductance gTc*. Thus, upon repolarization, the negative equilibrium potential ETc* pulled VTC back to its resting value quite rapidly. In this way, the active model could fit the experimentally determined kinetics of the O F F response without introducing instantaneous rectification into the
properties of
gx.
Computations of Potential Changes
Fig. 5 illustrates the potential changes in the T system, terminal cisternae, and longitudinal SR c o m p u t e d from the passive model. T h e dependence of the potential of the terminal cisternae on depolarization is shown, as is the rectification postulated in the m e m b r a n e of the terminal cisternae.
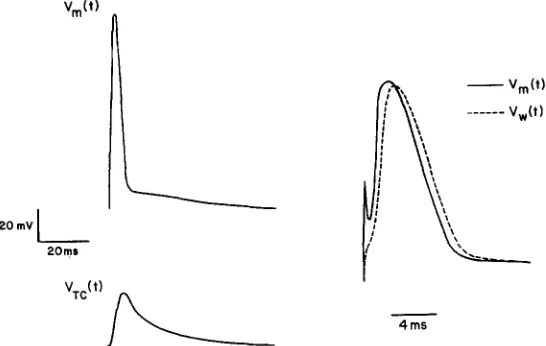
An action potential can be calculated using the model just presented. Fig. 6 shows, at two different time scales, the action potential calculated for a preparation in which there is no propagation. T h e dashed curve shown at the faster time scale is the action potential across the T-system membrane. It is apparent that the current flowing from T system to SR does not slow the rising phase or lead the action potential. Indeed, the shape of the action potential is actually m a d e more realistic by the inclusion of such currents.
T h e computations shown in Fig. 6 were m a d e using. Hodgkin-Huxley parameters at 3~ (Adrian and Peachey, 1973). Therefore, the surface action potential is slow and almost coincides with the T-system waveform. The expected change in potential within the terminal cisternae of the SR is also shown. A simple l u m p e d model has been used to represent the T system in these calculations because the purpose of the calculation is to show the effects of current flow into the SR. T h e shape of the action potential c o m p u t e d including current flow into the SR is nearer to that experimentally recorded (Adrian et al., 1970 a and b) than the shape c o m p u t e d without such current.
on January 5, 2005
www.jgp.org
MArinAS ET AL. Excitation-Contraction Coupling and Charge Movement ,n Muscle 15 However, a n y c o m p u t a t i o n incorporating charge movement would produce m u c h the same action potential. We imagine that calculations of propagating action potentials that include charge movement and increased amounts ofgNa in the tubules will give action potentials of realistic shape a n d conduction velocity, without invoking an access resistance at the m o u t h of the tubules.
VTC
-2O
A
Vm'_l
1
"
;
'~176
v w ]
30mV i
I
-t~o~ - e o - e o -4o -2o
V m (mY)
VTC
/
3~176
Vt.s.
my)
" 8 0
40
20
~o ~o
2.0
"1,5
~o
~rc(Vrc)
. . . Rf-2,5 . . .
'~0 40 60 80 100
V-rc (my)
?Ores 0.5
FIGURE 5. The predicted voltages. A illustrates the voltages computed across the wall of the tubules (Vw), across the membranes of the terminal cisternae (VTc), and across the membranes of the longitudinal SR (V~a) for the 70-ms pulse of voltage Vm illustrated across the surface membrane. B illustrates the variation of the steady-state value of VTc with Vm. C illustrates the rectification assumed in the terminal cisternae for the calculations of the passive model. The symbols are identified and used in Eqs. 1-8.
D I S C U S S I O N
Other Phenomena
EC coupling includes m a n y p h e n o m e n a not discussed here. A correct model should account for all of these. Some can, in fact, be interpreted or explained easily by our model. O t h e r phenomena, such as slow currents, immobilization of charge, a n d so on, require additional specific properties ofgx, the conduct- ance linking the T system and the SR.
on January 5, 2005
www.jgp.org
[image:15.612.117.505.205.495.2]16 THE JOURNAL OF GENERAL PHYSIOLOGY 9 VOLUME 76 9 1 9 8 0
There are m a n y electrical p h e n o m e n a that might reflect current flows or changes in ionic concentrations in SR compartments. Slow ionic currents (Adrian et al., 1970 a and b), components of charge movement (Adrian, 1978), calcium currents (Sanchez and Stefani, 1978; Palade and Almers, 1978), and slow p h e n o m e n a of charge movement (Chandler, et al., 1976 b; Adrian et al., 1976; Adrian and Rakowski, 1978; Rakowski, 1978) might all have counter- parts in current flows or concentration changes in the SR. T h e interpretation of such currents would be complicated by their flow through at least two serial s y s t e m s - - t h e T - S R junction and the SR m e m b r a n e s - - o f presumably different properties. Similar complications would appear in the interpretation of faster currents if they flowed into the SR. For example, if some of the current usually
Vm(t)
20 mv [
2om$
~'~,
Vm(t)
~,, ...
Vw(I)
VTC( t)
/ ~ 4 ms
FIGURE 6. Computed action potentials. The waveforms shown illustrate the computed nonpropagating action potential as seen across the surface membrane (Vm), across the wall of the tubular system (Vw), and across the membranes of the terminal cisternae. The calculations are done with the values of the Hodgkin- Huxley parameters used by Adrian and Peachey (1973) at a temperature of
3~ The action potentials on the right are shown on a fast time scale to
illustrate the T system and surface voltages.
identified as " K § currents through the delayed rectifier" flowed into the SR (Freygang, 1965), total K + current and EC coupling would have a real but confusing relationship (Adrian, 1964; Adrian et al., 1969; Kao and Stanfield,
1968 and 1970).
T h e optical signals thought to reflect the m e m b r a n e potential of the SR (Benzanilla and Horowicz, 1975; Baylor and Oetliker, 1977; Vergara et al., 1978; Baylor et al., 1979) should correspond to the weighted average of potentials across the membranes within the model. The weights would depend on the areas (Mobley and B. Eisenberg, 1975) and optical properties of each m e m b r a n e of the SR.
T h e detailed phenomenology of EC coupling (reviewed in Costantin, 1975; C a p u t o , 1978; Liittgau and Moisescu, 1978), including the properties of K §
on January 5, 2005
www.jgp.org
[image:16.612.171.444.266.439.2]M A T H I A S ET AL. Excitatzon-Contraction Couphng and Charge Movement in Muscle 17
contractures and the relation of charge m o v e m e n t and contraction (Kovacs et al., 1979), should be explicable. Note that the usual identification of K + contractures and depolarlzation-induced contractures would need reexami- nation if K + were the main carrier of current from T system to SR.
Structural observations (Somlyo, 1979; B. Eisenberg et al., 1979), including experiments showing the apparent formation of pillars at the T-SR junction upon depolarization (B. Eisenberg and Gilai, 1979; B. Eisenberg et al., 1979), should give results congruent with the properties of the conductance gx. (At least, that is so if one adopts the additional hypothesis that changes in gx correspond to the formation or breakage of pillars.)
Linear Model
T h e linear model, described in the Appendix, seems minimally complicated. It allows only one circuit element gx to vary with potential and time; not surprisingly, it does not describe all the experimental data. Nonetheless, the analytical constraints derived for the linear model are applicable, in large measure, to more complicated models. If current flow into the SR is in fact the correct explanation of charge m o v e m e n t in muscle, the eventual descrip- tion o f that current is likely to be more complicated than the models we present. It seems to us, however, that the linear model will always be useful in deriving analytical approximations and providing intuitive insights, if EC coupling does indeed include significant current flow into the SR.
Passive Model
T h e inadequacies of the linear model can be removed with a few changes, which define the passive model. T h e passive model includes instantaneous rectification in gx and the SR membranes (see Results) and fits experimental results. T h e saturation and a s y m m e t r y in the time-courses of charge m o v e m e n t are caused by the rectification in g'vc and g=~, respectively. Because potential changes in the SR are quite slow compared with an action potential, it would not be easy to distinguish an instantaneous rectifier in the SR m e m b r a n e from a typical potassium conductance. T h e particular current voltage characteristic used here to describe the instantaneous rectifier is certainly not u n i q u e - - indeed, it m a y not even be the optimal location to introduce the rectification. For example, the rate constants c o m p u t e d and illustrated in Fig. 4 D do not quite m a t c h those reported by C h a n d l e r et al. (1976 a, Fig. 13) and by Almers and Best (1976, Fig. 3). If the charge m o v e m e n t at m e m b r a n e potentials between - 6 0 m V and - 4 0 m V were produced by a decrease in gTc rather than an increase in g~, then the rate constants would be slower at - 4 0 m V than at - 6 0 mV, as was measured.
Active Model
T h e active model (Results and Figs. 1 and 2) introduces and examines the consequences of an SR calcium current. We assume a voltage- and time- d e p e n d e n t calcium selective channel, with conductance described by equa- tions of the form of Eqs. 1-7, letting ~ --= 1. T h e calcium current is presumed to be driven by the calcium equilibrium potential. Difficulties arise if the
on January 5, 2005
www.jgp.org
18 T H E J O U R N A L O F G E N E R A L P H Y S I O L O G Y 9 V O L U M E 76 9 1980
calcium conductance is the only "active" conductance. Once such a calcium current is turned on, the potential across the SR m e m b r a n e tends to be c l a m p e d at the calcium equilibrium potential, which removes the driving force for calcium m o v e m e n t and makes the SR m e m b r a n e potential rather i n d e p e n d e n t of the T-system potential. Therefore, we include a conductance for a counterion, also described by Eqs. 1-7, with ~ - 1. This ion is assumed to have an equilibrium potential in the opposite direction from that for calcium; thus, the potential across the SR membranes is kept away from the calcium equilibrium potential. T h e SR potential is thereby kept under the control of the T-system potential, even when substantial active calcium currents flow across the SR membranes.
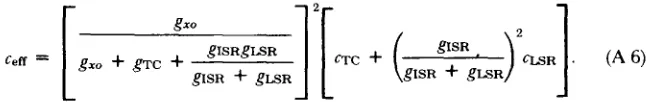
T h e computations of the active model were in large measure successful. T h e y replicated the experimental curves of charge movement, including a more rapid time-course for the O F F transient current and saturation of charge m o v e m e n t at large depolarizations. (Note that the active model could repro- duce these properties without the instantaneous rectification used in the passive modeI, i.e., with ~x -= 1.) T h e constraints implicit in Eq. A 5 (with the measured values of geil, Ceil, and ~') are more important to the linear and passive models than to the active model. We relaxed the constraints consid- erably in our calculations with the active model, hoping to produce enough active calcium current to charge the membranes of both the terminal cisternae and the longitudinal SR, without needing a small value of the conductance glSR. T h e active model did allow the charging of a larger a m o u n t of SR capacitance in a shorter time period than simpler models, but the computation of realistic charge m o v e m e n t still required a small value ofgIsR.
T h e computations of the active model were unsuccessful in an important respect. T h e calcium currents that we c o m p u t e d were too small, by a factor of ~ 100, to account for the 100-/~M release of calcium in a twitch (Costantin, 1975; Endo, 1977; Luttgau and Moisescu, 1978). W h e n the calcium conduct- ance was increased enough to produce such fluxes, the counterion conductance had to be adjusted so that the calcium current and counterion current were almost equal ( + 1 % deviation in magnitude) at all potentials and times. We could not achieve this balance with independent conductances. If the current generated by the release of calcium were balanced charge for charge by an exactly equal a n d opposite current of another ion, then there would be no electrical effect of calcium release. Calcium release produced by this kind of "electrically silent" process would be easy to include in our model. It would not disturb our predicted currents because it would not produce current flow. It could still be controlled by a voltage sensing macromolecule (in the SR membrane) and, so, could have the necessary voltage dependence.
If the current generated by the release of calcium were mostly, but not entirely, balanced by the flow of another ion, then there would be a residual current associated with calcium release. T h e residue of unbalanced current in this type of electrically silent process would be sensitive to and produce potential changes within the SR. It would contribute significantly to the c o m p u t e d nonlinear charge m o v e m e n t but would not disturb the agreement with experimental data, if it carried < 1% of the total flux of calcium.
on January 5, 2005
www.jgp.org
MATFIIAS ET AL. Excitation-Contraction Coupling and Charge Movement in Muscle 19
We conclude that calcium release in the active and passive models must be electrically silent if excitation spreads to the SR by ionic current flow through the T-SR junction (see the mechanism proposed for cardiac muscle by Morad and Goldman, 1973).
Other Models
This paper considers models of electrical coupling between T system and SR in which the coupling conductance has a time-course and voltage dependence of the general type illustrated in Fig. A 2. We consider such models because they easily satisfy one of the defining characteristics of charge movement, namely, the equality of charge movement at the O N and OFF of a depolar- izing pulse. Other models of electrical coupling have not been investigated in detail, although they have been considered in a qualitative way. For example, there might be satisfactory models in which gx has rather simple properties and the current through gTC has an N-shaped voltage dependence and complex kinetics.
Evaluation of Models
There are a n u m b e r of features of the models we have considered that are quite specific and perhaps implausible. For example, we have assumed that all of charge movement is a consequence of ionic current flow from T system to SR. It seems more likely that a component of charge movement is produced by m e m b r a n e - b o u n d charge (for example, that involved in controlling gN, or gx) and another component produced by charging the capacitance of the terminal cisternae. O u r assumptions have been made to show that electrical coupling between T system and SR is possible. We are fully aware that our model and assumptions require experimental check. Indeed, these models may well contribute to our knowledge of the mechanism of EC coupling only by exclusion.
T h e value of gx used in all of our calculations represents quite a small coupling between T system and SR. The m a x i m u m coupling conductance is < 1 0 -3 m h o s / c m 2, which gives a conductance of 10-x4-10 -15 mhos per pillar, assuming that all the T - S R sites described by Franzini-Armstrong (1970) contain conducting pillars. This figure is much less than the figure usually quoted for the conductance associated with a single-gap junction particle, but of course depends on the several levels of assumptions. If, for example, only a few of the T - S R sites contained conducting pillars (B. Eisenberg, et al., 1979), the conductance per pillar would be much higher. O u r model is consistent with the view that the T - S R junction is a specialized junction, with structure and properties distinct from gap junctions (e.g., Peachey, 1968).
T h e passive and active models both separate the SR into two compartments, electrically isolated by a small conductance gxsR. The value of this conduct- ance, when it refers to one sarcomere of one myofibril, implies that the membranes of the intermediate region of the SR are nearly touching.
There is m u c h evidence that terminal cisternae and longitudinal SR of frog twitch muscle are separated by a diffusion barrier:
(a) Winegrad (1968), using autoradiographic techniques, found that calcium
on January 5, 2005
www.jgp.org
2 0 T H E J O U R N A L O F G E N E R A L P H Y S I O L O G Y 9 V O L U M E 7 6 9 1 9 8 0 movements from longitudinal tubules to terminal cisternae can take more than 20 s after a tetanus, suggesting a diffusion barrier between those structures.
(b) Kirby et al. (1975), using tracer experiments on single muscle fibers and small muscles, conclude that calcium washes out of the terminal cisternae with a time constant of 2.7 min, whereas it washes out of the longitudinal SR with a time constant of 1,244 min. Winegrad (1970) also found that calcium in the terminal cisternae exchanges with the external m e d i u m much more quickly than calcium in the SR. T h e quantitative agreement between Wine- grad (1970) and Kirby et al. (1975) is important because their techniques are subject to different artifacts: autoradiography determines the anatomical site of the c o m p a r t m e n t s rather convincingly, whereas flux measurements con- vincingly determine the time constants of wash out. Calcium binding within the longitudinal tubules is another explanation of these results.
(c) Costantin et al. (1965) observed that precipitate of calcium oxalate is found in only the terminal cisternae and concluded that the cisternae are "differentiated regions" of the sarcoplasmic reticulum.
(d) T h e ultrastructure of the intermediate region of the SR suggests a diffusion barrier to some authors (e.g., Peachey, 1965 a, using conventionally fixed material; Howell, 1974, using ruthenium-treated material; and S o m m e r et al., 1978, using frozen material); but images of the intermediate cisternae in frog muscle are sufficiently variable that it is difficult to be sure which describes the living state.
(e) T h e findings of Huxley and Taylor (1958), showing much more extensive radial than longitudinal spread of local contractions, are also consistent with a constriction between terminal cisternae and longitudinal tubules.
No constriction is seen in certain other preparations (in, e.g., the b l a c k
mollie Mollienesia sp. [Franzini-Armstrong and Porter, 1964; Peachey, 1965
b]). Unfortunately, charge m o v e m e n t has not been measured in preparations without constrictions. In this regard, it should be r e m e m b e r e d that the low value of g~sn in our model is needed only to reconcile the measured time- course and q u a n t i t y of charge movement with the morphology of frog muscle. T h e low value is not needed to produce a substantial voltage change in the SR.
W e have not specified the current carrier through the conductance gx in our model. T h e requirement is simply m a d e that no current flows at rest: the sum of the resting potentials across the T - S R junction and across the SR m e m b r a n e must be zero. This requirement would be satisfied if K § were the principal carrier of current. T h e idea that a c o m p o n e n t of potassium current is related to EC coupling has a certain appeal in view of the similarity, mentioned before, between some properties of potassium current, some prop- erties of EC coupling, and some properties of charge movement (see also Adrian and Peres, 1977; Adrian, 1978; and Adrian and Peres; 1979). By no means, however, is K + the only possible current carrier through the conduct- ance gx. Both CI- and Ca ++ might well have equilibrium potentials of the right polarity to be the principal current carrier (Somlyo et al., 1977). In fact,
on January 5, 2005
www.jgp.org
M A T H I A S ET AL. Excitation-Contraction Coupling and Charge Movement in Muscle 21
gx might be a rather nonselective conductance in which most any ion would carry current according to its free solution concentration a n d mobility.
T h e r e is experimental data supporting and detracting from each of the candidates for current carrier. Proving the existence of a coupling conductance gx a n d d e t e r m i n i n g the current carrier through gx are experimental problems that m a y have the same solution. Unfortunately, one must expect that identification o f the mobile species will be impeded by the series connection of the T - S R j u n c t i o n and SR membranes, with the resulting complexity in selectivity a n d other properties.
Experimental Tests
It is useful to consider experiments that might distinguish between the m o v e m e n t of i n t r a m e m b r a n e charges and current flow from T system to SR. T h e experiments we have considered fall into three categories.
First, there are purely electrical experiments in which the response to multistep pulse schedules are evaluated. Consider an experiment in which the potential is c h a n g e d from the holding potential to a depolarized potential (e.g., 0 mV) and then r e t u r n e d to a potential Vretum. T h e passive model, with the parameters given in Tables I and II, predicts that the charge movement associated with the change of potential from 0 to V~etu~n will increase as Vretu~ is m a d e more negative t h a n the holding potential. An increase is not expected in models explaining the O F F transient as the m o v e m e n t of a m e m b r a n e - b o u n d charge. Such experiments m a y distinguish between the two models, but it m a y also be possible to modify the passive model to make the increase in charge m o v e m e n t rather small. In any case, experiments of this type will better specify the properties ofgx. T h e properties of charge m o v e m e n t - - a n d , thus, o f the circuit elements in our m o d e l s - - n e e d to be investigated in the frequency domain. Measuring the impedance (and thus the equivalent circuit) of a muscle fiber at various holding potentials should specify the properties of charge m o v e m e n t in great detail and, thus, aid in distinguishing between models.
A n o t h e r class of experiments we have considered might serve to falsify the class of models considered here. Models that involve ionic current flow from T system to SR, and that seek to explain all of charge m o v e m e n t as a consequence of that ionic current flow, seem to require substantial isolation of the longitudinal tubules from the terminal cisternae and seem to require that calcium release be electrically silent, as defined above. If it were found that calcium release is accompanied by a substantial net current, or that the longitudinal tubules were not isolated from the SR, it seems likely that the class of models considered here could not explain the charge m o v e m e n t measured in frog skeletal muscle.
T h e last class of experiments are designed to detect the m o v e m e n t of an extracellular substance into the SR. Unfortunately, a c o m p a r t m e n t a l analysis of flux measurements seems unable to provide such a demonstration (Neville, 1979). But flux measurements might be able to detect the m o v e m e n t of a labeled impermeable solute, such as sucrose, from extracellular space into the
on January 5, 2005
www.jgp.org