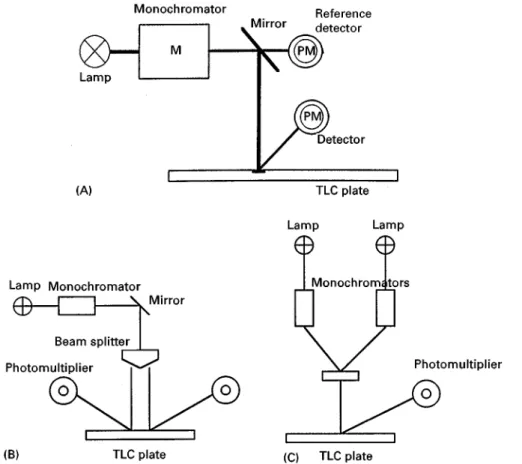
Table 1 Sample loadability ratios for different distribution coef-ficients
KD Lp
Lc
1 31
10 101
100 373
Packed column: Lf"20 cm; dp"5m; dpc"1 mm; i"0.5;
e"0.4; T"0.7. Open tubular column: Lc10 m; dc"50m; dF"0.2m.
Rlled by injector or detector or detector volume:
c"
Ni
N
n k1/2
[21]
From eqn [21], an expression has been derived linking fractional loss of resolution,Rs, due to the
injector or detector volume to column and retention characteristics:
vi"0.866dc2(LH)1/2
1 (1!Rs)2
!1
1/2
(1#k)
[22]
where vi is the injection volume and L is column
length. SinceH is a function ofdc,viis proportional
tod5/2
c and for a 10 m;50m column operated under
practical conditions, a 1% loss of resolution requires an injection volume of only 50 nL.
For equal distribution coefRcients,KD, an equation
relating the maximum loadabilities, Lp and Lc, for
packed and open tubular columns has been derived:
Lp
Lc
"1.24
dpcdc
2 1#KDi(1!e) T1#4KDd$
dc
LpLc
1/2 dpdc
1/2[23]
whered
is the diameter of the packed column;, and
2are intraparticle, interstitial and total
poros-ities, respectively; andLpandLcare the lengths of the
packed and open tubular columns, respectively. Table 1lists the maximum sample loadability ra-tios for different KD values for typical packed and
open tubular columns; as might be expected, sample loadabilities are much greater on packed columns.
Increasing the column diameter is the simplest ap-proach to increasing the sample capacity of packed columns, since the surface area of stationary-phase support particles is generally maximized. However, for capillary columns, sample capacity can be in-creased by increasing the stationary phaseRlm thick-ness,dF. This should also lead, in theory, to a reduction
in column efRciency but in practice such a reduction is only small, withRlm thickness up to 1m.
Further Reading
Anton K and Berger C (eds) (1998) Supercritical Fluid
Chromatography with Packed Columns. New York: Marcel Dekker.
Berger TA (1995)Packed Column SFC. Cambridge: Royal
Society of Chemistry.
Heaton DM, Bartle KD, Clifford AA, Klee MS and Berger TA (1994) Retention prediction based on molecular
interactions in packed-column supercritical Suid
chromatography.Analytical Chemistry66: 4253.
Lee ML and Markides KE (1990)Analytical Supercritical
Fluid Chromatography. Provo, Utah: Chromatography Conferences.
Smith RM (ed.) (1988) Supercritical Fluid
Chromato-graphy. London: Royal Society of Chemistry.
CHROMATOGRAPHY:
THIN-LAYER (PLANAR)
Densitometry and Image
Analysis
P. E. Wall, Merck Limited, Poole, Dorset, UK
Copyright^ 2000 Academic Press
Introduction
reproducible, but also highly accurate (&1% stan-dard deviation). Scanning is a fast process (up to a scan speed of 100 mm s\1) with a spatial resolution
in steps from 25 to 200m. Full UV/visible spectra (190}800 nm wavelength) of separated analytes can be recorded at high speed and peaks can be checked for purity by obtaining and comparing spectra from the start, middle and end of the peaks. With the use of highly sensitive charged coupled device (CCD) cameras, the photographic image of the developed TLC/HPTLC plate can be stored as a video image. This can be video-scanned to determine the concentra-tion of separated components or can be printed when required as part of a document for a permanent re-cord of the results. Many images can be stored on the computer hard drive and archived whenever required.
The Development of Modern Scanning
Densitometry
The results of a developed TLC/HPTLC plate or sheet can be quantiRed in a number of ways. Visually, an estimate of concentration can be made. Many related substance tests in the pharmacopoeias rely on the concentration of the sample impurities being less than the standard concentration as seen visually. These are limit tests which depend on the eye of the observer determining that the concentration of the unknown is less than that of the standard. It has been estimated that the human eye can detect down to about 1g of a coloured spot on a TLC plate with a reproducibility of about 10}30%.
Better quantiRcation can be obtained by eluting the relevant chromatographic zone from the adsorbent followed by spectrophotometry. The position of the zone can be marked out with a sharp bradawl and a microspatula used to scrape away the zone. These scrapings are then transferred to a container where a suitable solvent can be used to dissolve the com-pounds of interest from the particles of the adsorbent. The mixture isRltered and the concentration of the analyte in solution determined by transmittance/ ab-sorption spectrophotometry. There is little to recom-mend in this procedure as it is both tedious and time-consuming. It also requires meticulous care as errors can easily creep into the procedure. It is difR -cult to ensure that all the sample is completely re-moved from the TLC layer and is transferred from the chromatographic zone for further work-up if it is not easily seen in the visible or UV parts of the spectrum. The technique of scanning densitometry deter-mines the concentrationin situ. It scans at set spectral wavelengths and does not rely on removal of any of the chromatographic zones from the TLC/HPTLC plate. Hence the previous problems and errors are
eliminated. Scanning densitometry dates back to the 1950s when it was used to scan thin strips of paper chromatograms containing separated amino acids. Since then these primitive instruments have under-gone considerable change, to the extent that they are now advanced analytical tools of similar capabilities to modern HPLC instrumentation.
Today’s scanning densitometer measures reS ec-tance, quenchedSuorescence orSuorescence induced by electromagnetic radiation. For this reason, the instrument is now described as a spectrodensito-meter. Although all three detection modes are com-monly used,Suorescence is limited by the fact that fewer substances can be induced toSuoresce. Many spectrodensitometers also have an attachment for scanning electrophoresis gels by transmission.
The principle of operation is based on light of a predetermined beam size and wavelength striking the thin-layer surface perpendicularly whilst the TLC plate moves at a set speed under the stationary beam, or alternatively the beam traverses the stationary plate. Some of the electromagnetic radiation passes into and through the layer (transmitted light) whilst the remainder, due to the opaqueness of the layer, is reSected back from the surface. When the light beam passes over an absorbing chromatographic zone, there is a difference in optical response and less of the light is reSected (or transmitted). A photoelectric cell is used to measure the reSected light. When this receives a re-duced amount of reSected light due to the presence of an absorbing chromatographic zone, a means is pro-vided of detecting and quantifying the analyte.
When separated analytes naturally Suoresce under UV light, the spectrodensitometer can be used to scan in the Suorescence mode. The UV light provides the en-ergy in these instances to excite electrons in molecules of the analytes from a ground state to an excited singlet state. As the excited electrons return to the ground state, energy is emitted as radiation at a longer wavelength, usually in the visible range. For best results in using this technique, it is important to use TLC/HPTLC plates which do not contain a phosphorescent ofSuorescent indicator to minimize background inteference.
Theory of Spectrodensitometry
In spectrophotometric measurements where the ab-sorbance is measured as a result of a beam of light of set wavelength passing through a Rxed pathlength of solution, a direct relationship exists between the observed absorbance and the concentration of the solution. This is known as Beer’s law. However, it should be pointed out that this relationship is not linear over the whole range of concentration, and it depends on the sample solution being transparent.
As TLC/HPTLC plates are opaque, a somewhat different approach is required. In the 1930s Kubelka and Munk investigated the relationship between ab-sorbance, transmission and reSectance, deriving math-ematical expressions to explain the effects of absorb-ance and reSectance. When a ray of incident light comes into contact with the surface of the opaque TLC layer, some light is transmitted, some is reSected in all directions at the surface and some rays are propagated in all directions inside the adsorbent. The theory which explains to a large degree what is happening in this process is known as the Kubelka}Munk theory. Cer-tain assumptions can be made which simplify the mathematical equations derived. The theory assumes that both the transmitted and reSected components of incident light are made up only of rays propagated inside the sorbent in a direction perpendicular to the plane of the surface. All other directions will lead to longer pathways and hence stronger absorption. These rays therefore contribute little to either the transmitted or reSected light and their contribution can be treated as negligible. When light exits from the sorbent at the layer}air boundary, light scattering occurs, and it is distributed over all possible angles with the surface. The coefRcient of light scatter (S), can therefore be proposed; this depends on the layer thickness. If we assume that this is unchanged in the presence of a chromatographic zone, the following equation can be derived for an inRnitely thick opaque layer:
(1!R
)2
2R
"
2.303
S )am)C [1]
where R
is the reSectance for an inRnitely thick
opaque layer,amis the molar absorptivity of the
sam-ple,cis the molar concentration of the sample andSis the coefRcient of scatter per unit thickness.
This equation is clearly less than ideal as the layer has aRnite thickness. More meaningful expressions for the intensity of the reSected light, IR, and the
transmitted light, IT, for a layer of thickness (l) are
given by the following hyperbolic solutions:
IR"
sinh(b)S)l)
a)sinh(b)S)l)#b)cosh(b)S)l) [2]
IT"
b
a)sinh(b)S)l)#b)cosh(b)S)l) [3]
where
a"S)l#KA)l S)l
and
b"(a2!1)1/2
KAis the coefRcient of absorption per unit thickness.
The application of the equations to quantitative analysis in TLC is quite complex, but it can be greatly simpliRed by making a number of reasonable assumptions that would hold true for TLC. One thing that eqn [2] immediately reveals is that the relationship between the reSected light and the concentration of the chromatographic zone is nonlin-ear. This is what is found in practice over the full range of concentrations. The data when graphically displayedRt a polynomial curve (eqn [4]).
y"a0#a1)x#a2)x2 [4]
However, over a narrow concentration range the relationship is seen to be linear. This means that if it is necessary to have a calibration curve over the whole range of concentrations, at least four but no more than six standards will be required for the determination of one separated analyte. Of course, only two standards may be needed if the concentra-tions are close to that of the analyte, because it can be assumed that the curve is linear over a small range.
deviation is normally below 2% and quite often well below 1%.
For a wide concentration range, the Michaelis} Menten regression curve can be used. The calibration is calculated as a saturation curve:
y"
a1)x a2#x[5]
and is theoretically only permitted within the calib-ration range (between the largest and the smallest standard amounts applied). This regression always passes through the origin.
In some cases there is a better curveRt to the data if the Michaelis}Menten regression does not pass through the origin. Better resolution is therefore ob-tained if the data produce a function that does not tend towards zero:
y"a0#
a1)x
a2#x
[6]
As before, this is theoretically admissible only within the calibration range.
It is also possible to linearize the data graphically. The simplest transformation procedures involve con-verting the data on reSectance and concentration into reciprocals, logarithms or squared terms. The follow-ing equations can thus be proposed:
logRe"a0#a1)logc [7]
1
Re"
a0#a1
1
c
[8]R2
e"a0#a1)c [9]
whereReis the reSectance signal andcis the sample
concentration.
Eqns [7] and [9] result in linearization over the middle of the concentration range, whereas eqn [8] showed better linearization, but even this fails at very low concentration. None of these methods is able to linearize the data over the whole concentration range. A solution to the above is to use nonlinear regres-sion analysis based on second-order polynomials. These can be described by the following equations:
lnRe"a0#a1)lnc#a2)(lnc)2 [10]
Re"a0#a1)c#a2)c2 [11]
Over the whole concentration range, eqn [10] gives the best results. In fact, it has been shown that the
data Rt is not compromised when as few as three standards are used over the whole concentration range.
The mathematical treatment of the data forS uores-cence intensity can be expressed according to the well-known Beer}Lambert law. The Suorescence emission (F) is given by the equation:
F")I0(1!e\amlc) [12]
where F is the Suorescence emission and is the quantum yield.
For low sample concentrations the following as-sumption can be made:
e\amlc"1!a
m)l)c [13]
Therefore:
F")I0)am)l)c [14]
It follows that, for low concentrations, theS uores-cence emission is linearly dependent on the sample concentration. In practice this proves to be the case even though this equation was derived without taking into consideration the inSuence of absorption or scatter.
Pre-Scanning Considerations
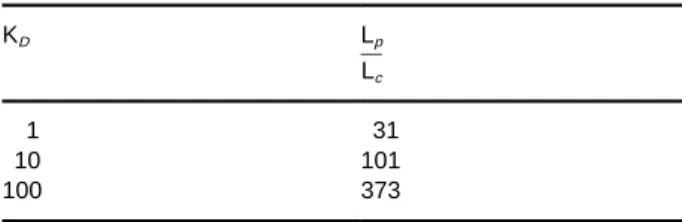
Figure 1 Linear scan of individual tracks using a scanning den-sitometer. Slit length and width, track length and speed of scan are all pre-selected.
Instrumentation
A number of different types of scanning spectroden-sitometers are available. Most are now either par-tially or fully computer-controlled. The parameters such as track length, number of tracks, distance be-tween tracks, slit length and width, scanning wave-length and speed can all be programmed into the computer. Some spectrodensitometers can perform a pre-scanning run to determine the position of max-imum absorption for the separated components on the track: this is particularly useful where spot ap-plication has been used. After scanning, the spectro-densitometer generates massive amounts of data from all the tracks, including peak height and area and position of zones (start, middle and end), for every component. Usually a chromatogram can be dis-played for all tracks. This can be baseline-adjusted and excess noise from the background of the layer can be subtracted. All peaks can be integrated, ready for possible quantiRcation. Although a number of scann-ing modes are available, such as linear, radial (scann-ing from the centre for circular chromatograms) and circular scanning around a ring (circular develop-ment), by far the most popular is the linear mode, as shown inFigure 1.
Normally, three light sources are used in scanning densitometry: a deuterium lamp (190}400 nm), a tungsten halogen lamp (350}800 nm), and a high pressure mercury vapour or xenon lamp for intense line spectra (254}578 nm), usually required forS u-orescence determinations.
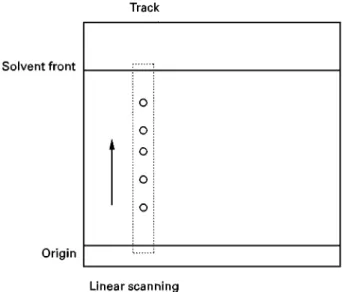
Three optical methods (Figure 2) have been used in the construction of scanning densitometers:
1. single wavelength, single beam 2. single wavelength, double beam 3. dual wavelength, single beam
Construction 1 requires little explanation and is the type manufactured by most commercial TLC com-panies. Construction 2 divides the single beam into two by means of a beam splitter, so that one half scans over the chromatographic zone whilst the other scans over the background. Both beams are detected by matched photomultipliers and the difference in the signal measured. In construction 3, two wavelengths as close together as possible are chosen, such that Suctuations caused by light scattering at the light-absorbing wavelength are compensated for by sub-tracting theSuctuations at the different wavelength at which there is no absorption by the chromatographic zone.
InRxed-beam spectrodensitometers, the stage hold-ing the TLC plate under the light beam moves at a constant rate, propelled by stepping motors. Where the light beam moves, it does so in a zigzag fashion over the surface of the stationary plate. Usually the zigzag scanners incorporate a curve linearization technique for absorption measurements. This uses the hyperbolic solution in eqn [2].
Applications
As the chromatogram is permanently or semiperma-nently held in the layer after development is complete, a number of useful techniques can be used with a scanning spectrodensitometer both to improve the evaluation of the chromatogram and to collect more important data on the separated analytes.
1. The TLC plate can be scanned at a range of different wavelengths. The optimum wavelength can therefore be chosen for maximum absorption of individual sample components. Of course, if two analytes are not completely resolved, but absorb at different wavelengths, then it is possible to quantify the results without further resolution.
2. UV/visible absorption spectra can be obtained for each separated component. Some commercial software then allows the comparison of such spectra with a library of spectra in order to ident-ify unknowns.
Figure 2 Scanning modes: (A) single beam; (B) single wavelength, double beam in space; (C) dual wavelength, single beam in time. PM, photomultiplier.
4. Background subtraction is another useful feature of most spectrodensitometers. Some background noise will always be present, hence the scanner software can subtract a background scan of the TLC plate before quantiRcation.
5. Some instruments can scan and image an entire plate, enabling two-dimensional chromatograms to be evaluated (scan time less than 5 min).
The widespread use of planar chromatography means that the applications of spectrodensitometry are almost limitless. Hence, there are extensive publi-cations on the use of scanning densitometry in all types of industry and research. Many of the instru-ment and plate manufacturers also provide applica-tion methods and extensive bibliographies. For example, in all of the following areas scanning den-sitometry has been used for quantiRcation.
1. Biomedical: organic acids, lipids, steroids, carbo-hydrates, amino acids
2. Pharmaceutical: stability and impurities of syn-thetic drugs, antibiotics, drug monitoring, alkaloids 3. Food science: mycotoxins (including aSatoxins), drug residues, antioxidants, preservatives, natural pigments, food colours, spices,Savonoids
4. Forensic: drugs of abuse, poisons, alkaloids, inks 5. Clinical: therapeutic drug monitoring, identiR
ca-tion of metabolic drug disorders
6. Environmental: pesticide residues in crops, crop protection agents in drinking water, industrial hygiene
7. Industrial: product uniformity, impurity proRle, surfactants, synthetic dyes
To give aSavour of the capability of the technique, the following examples can be considered.Figure 3 shows the scan obtained from the separation of a number of sulfonamides and antibiotics from a complex animal feed matrix on an HPTLC silica gel plate. Scanning at Rve different wavelengths allows each of the components to be quantiRed by measure-ment at its absorption maximum. The three-dimen-sional presentation also allows the minor impurities to be more clearly identiRed. Multi-wavelength scanning is also illustrated inFigure 4with an auto-mated multiple development (AMD) separation of pesticides in tap water on HPTLC silica gel plates. Figure 5illustrates theSuorescence scan of a range of saturated fatty acids from C6 to C24, an important
Figure 3 (See Colour Plate 26). Separation of sulfonamides in a complex animal feed matrix on an HPTLC silica gel plate. The plate has been scanned at five different wavelengths and the chromatogram overlaid in a three-dimensional presentation. Reprinted from Camag literature, CAMAG, Muttenz, Switzerland.
Figure 4 (See Colour Plate 27). Separation of pesticides in tap water on an HPTLC silica gel plate by AMD. Multi-wavelength (six wavelengths) evaluation permits resolution by optical means of fractions insufficiently separated. Reprinted from Camag literature, CAMAG, Muttenz, Switzerland.
acids were derivatized before separation by a unique on-layer technique. The acids are resolved as their dansylcadaverine derivatives on an HPTLC RP18 layer.
The use of spectral identiRcation of an unknown is demonstrated inFigure 6. The unknown was event-ually identiRed as morphine, but because ethylmor-phine and codeine have such similar spectra (as shown in the overlay), it was necessary to search the spectrum library for the best-Rt recorded spectra, and also to check the correlation with theRFvalue. This
enabled a correlation with morphine of 98.4% to be
obtained for the unknown. This example illustrates the need for the analyst not only to search for the best Rt, but also to check the correlation with theRFvalue.
Had the search been limited to the spectrum library, ethylmorphine could well have been chosen as the unknown.
Video Densitometry
imag-Figure 5 Fluorescence scan of dansylcadaverine derivatized fatty acids separated on an HPTLC silica RP18 plate.
Correlation of spectra withoutRFvalue Correlation of spectra withRFvalue
Substance Correlation Substance Correlation
Ethylmorphine 0.9924 Morphine 0.9839
Codeine 0.9905 Atenolol 0.9223
Nalorphine 0.9848 Salbutamol 0.9174
Morphine 0.9839 Sotalol 0.8939
Figure 6 (See Colour Plate 28). UV spectra of codeine, ethylmorphine and unknown (morphine) overlaid. Spectra of codeine and ethylmorphine taken from spectral library. Spectrum of morphine taken from chromatogram. Reprinted from Camag literature, CAMAG, Muttenz, Switzerland.
ing system consisting of a high resolution CCD cam-era with a zoom attachment to focus and enlarge the chromatogram, if required and a suitable illumina-tion system. The camera is linked to a computer (usually a PC) and a video printer. The software controls the camera, as well as all parameters such as brightness, contrast, colour balance and intensity. These can be saved for future use or kept as a record of the results. The chromatogram can be presented as an image on the video printer and can be quantiRed to
Figure 7 Video scan of separation of corticosteroids on an HPTLC silica gel plate. Detection reagent: blue tetrazolium solu-tion. Spot application with automatic equipment.
Track 3 Sample a
Peak Start Maximum End Area Subst
no name
RF H RF H [%] RF H A [%]
1 0.016 0.0 0.065 606.4 10.76 0.097 50.9 5076.4 9.53 8
2 0.097 50.9 0.126 488.3 8.67 0.146 87.9 3432.6 6.44 7
3 0.146 87.9 0.174 780.2 13.85 0.206 12.1 5353.3 10.05 6
4 0.227 0.0 0.271 1094.6 19.42 0.316 13.8 9440.8 17.72 5
5 0.324 0.0 0.368 844.7 14.99 0.397 240.7 7487.0 14.05 4
6 0.397 240.7 0.417 555.2 9.85 0.462 6.1 4914.6 9.22 3
7 0.543 26.1 0.587 509.7 9.05 0.640 10.6 6065.0 11.38 2
8 0.794 70.3 0.854 755.8 13.41 0.915 46.6 11519.2 21.62 1
Total height, 5634.96; total area, 53288.8.
Figure 8 Video scan of separation of corticosteroids on an HPTLC silica gel plate.
Figure 10 Separation of dye mixture developed on an HPTLC silica gel plate with toluene as mobile phase. Comparison of spectrodensitometric scan with video scanning.
Table 1 Comparison of coefficient of variance (CV) with video scanning and spectro-densitometric scanning. Separation of dyes on an HPTLC silica gel plate using toluene as mobile phase
Dye RF Video scan with white light Spectrodensitometric scan at 592 nm Mean value (%) CV (%) Mean value (%) CV (%) Black 0.04
Grey 0.10 99.4 3.50 101.5 0.83
Red 0.17 102.8 3.10 97.8 0.31
Blue 0.23 103.0 3.52 101.2 1.90
Pink 0.36 99.7 3.46 98.3 0.96
Yellow 0.51 98.6 1.30 98.8 0.56
readiness in annotating further images. Such images can be stored in a variety ofRles which can then be used in a number of well-known ofRce programs, such as Word, and PowerPoint.
The illumination system needs a number of features in order to get the best results from the CCD camera unit. Illumination from above is necessary, both vis-ible light and UV light at 254 and 366 nm (depending on the chromatogram). However, it is essential that the light Rttings do not interfere with the camera’s Reld of view. Lighting from below the plate can in some cases also prove advantageous in giving a bright image.
Figure 7illustrates a video print of a separation of corticosteroids developed on an HPTLC silica gel plate. The steroids were detected with blue tetra-zolium reagent.Figure 8shows the scan taken using the software option available.RFdata is recorded in
the table below. Figure 9 illustrates a further video print, this time ofSuorescent chromatographic zones, photographed under UV light (366 nm). This is a
separation of derivatized saturated fatty acids from C6to C24 (conditions as in Figure 5).
Future Trends
It seems unlikely that video densitometry will ever replace spectrodensitometry as both techniques have unique advantages. On the one hand spectroden-sitometry allows the scanning of TLC/HPTLC plates at selectable wavelengths, the acquisition of UV/ vis-ible spectra, the determination of peak purity and high accuracy of results. On the other hand, video scanning provides a computer or printed image that can serve as a permanent record of the results ob-tained which can be documented at any time in a re-port. Also, for some requirements the accuracy of scanning is sufRcient for quantitative evaluation.
With improved software, both densitometric and video scanners are likely to become still more user-friendly. However, more dramatic improvement in the accuracy and reliability of results is more likely to come from the continual improvements taking place in the quality of adsorbents making up the layer. With the introduction of smaller (4m) spherical particle sizes, the quality of separation will improve, hence this will be reSected in the scans and quantitative results obtained with both spectrodensitometry and video scanning.
See also: III/In-Depth Distribution in Quantitative
Thin-layer Chromatography.
Further Reading
Frei MP and Zeiloff K (1992)Qualitativ und Quantitativ
Du(nnschicht-Chromatographie. Weinheim: VCH.
Geiss F (1987)Fundamentals of Thin Layer
Chromatogra-phy. Heidelberg: Alfred HuKthig Verlag.
Jork H, Funk W, Fischer W and Wimmer H (1989, 1994)
Thin-layer Chromatography, Reagents and Detection Methods, vols 1a and 1b. Weinhein: VCH.
Poole CF and Poole SK (1992) Chromatography Today.
Amsterdam: Elsevier.
Sherma J and Fried B (1994)Thin-layer Chromatography,
Techniques and Applications, 3rd edn. Chromatographic Science Series, vol. 66. New York: Marcel Dekker.
Touchstone JC (1992)Practice in Layer Chromatography,
3rd edn. New York: Wiley-Interscience.
Touchstone JC and Sherma J (1979)Densitometry in Thin
Layer Chromatography Practice and Applications. New York: Wiley-Interscience.
Wall PE and Wilson ID (1995) Thin-layer
chromatogra-phy}techniques. In:Encyclopedia of Analytical Science.
London: Academic Press.
Zlatkis A and Kaiser RE (1977)HPTLC High Performance
Thin-layer Chromatography. New York: Elsevier.
Historical Development
E. Reich, CAMAG, Muttenz, Switzerland
Copyright^ 2000 Academic Press
History
Today the term planar chromatography is commonly used as a synonym for high performance thin-layer chromatography (HPLTC) and conventional thin-layer chromatography (TLC). Originally it referred more generally to a family of techniques including TLC, some types of electrophoresis and paper chromatography, which all have in common a sta-tionary phase in the form of a Sat thin layer rather than packed into a column. Modern planar chrom-atography is a form of liquid chromchrom-atography and its history is closely linked to the development of chromatography as an analytical tool.
Early roots go back to Beyrinck who in 1889 separ-ated hydrochloric and sulfuric acid by diffusion through a thin layer of gelatine on a glass plate. With the same technique, Wijsman in 1898 was able to demonstrate the presence of two enzymes in malt diastase. When at the end of the 1930s Tswett’s column chromatography became successful, research
focused on a faster microchromatographic method, which allowed the exact identiRcation of adsorbed substances. This situation encouraged the transition from a regular column to an open column, a thin layer of adsorbent.
Izmailov and Shraiber are regarded as the inventors of TLC (Table 1). In 1938 they described a method in which microscopic slides were coated with 2 mm layers of a slurry made of chalk, talc, magnesium oxide, lime aluminium oxide or other adsorbents and water. On drying, a thin adsorbent layer was formed. The authors investigated belladonna and other plant extracts by placing a drop of the extract on to the layer. This resulted in the so-called ultra chromato-gram that was visualized under ultraviolet light. The chromatogram was then developed with several drops of solvent. The most important advantage of the new method in comparison to column chromatography was the short time of analysis and the low consumption of adsorbents, solvents and samples.