We can define oligopoly as a market model type of imperfect competition, which is characterized by a small number of companies in the sector and by a relatively high degree of interdependence of their decisions. If the oligopolistic firm thinks about the change of price (or amount) of its production, it will take into account not only the reaction of the prospective purchasers, but also the response of the competing firms. The oligopolistic firm must take into account how, as a result of their choice, the competitors change the price (quantity) of their output. The reactions of that firm are affected not only by what the competitors are doing now, but also what the firm is expecting of them. Firms in oligopoly react not only with each other to the change the prices of production, but also to the change their quantity, quality, advertising, etc. for each of the competing firms. (Severová and Šrédl 2010a). One of the behaviour models of oligopolistic companies is a duopoly. Depending on the indicator the duopolistic companies change, we differentiate the competition as output based or price based. An example of a
du-opolistic price based competition in an oligdu-opolistic market is the Sweezy model, which is mentioned by the renowned economists in their publications, e.g. Frank (1995), Varian (1995), Samuelson and Nordhaus (2007); new views on the application of the model in an oligopolistic environment are described by Schiller (2004).
It is necessary to say that new classical economists, e.g. George Stigler, worked to discredit these kinked demand models. Stigler in his work “The Literature of Economics: The Case of the Kinked Oligopoly Demand Curve” (1978) argues that the kinked de-mand models are not useful because the kinked demand analysis only suggests why prices remain stable and it does not describe the mechanism that establishes the kink and how the kink can reform once prices change.
However, the aim of the paper is not to describe the mechanism but to verify and explain the actual effects of the Sweezy oligopoly model and its eventual impact on the consumer demand and the structure of the food supply of chain stores.
The Sweezy model of price competition among private
labels of chain stores
Roman Svoboda*, Lenka Kopecka
Faculty of Economics and Management, Czech University of Life Sciences, Prague, Czech Republic
*Corresponding author: svobodar@pef.czu.cz
Svoboda R., Kopecka L. (2017): Th e Sweezy model of price competition among private labels of chain stores. Agric. Econ. – Czech, 63: 299–307.
Abstract: Th e aim of the paper is to verify and explain the actual eff ects of the Sweezy oligopoly model and its eventual im-pact on the consumer demand and the structure of the food supply of chain stores. Th e methodology of the paper is based on a comparative analysis of the structure of commodities of chain stores in the Czech Republic in terms of consumer demand and its change over time. An example of this model behaviour of fi rms may be the competition between two super-market chains Billa and Kaufl and in the super-market with private label products (e.g. pork meat). Results of the analysis of the Sweezy model imply that the change in company costs due to higher prices of inputs does not aff ect product prices and this is the reason behind the rigidity of prices in the oligopolistic markets in the Sweezy model.
Keywords: consumer demand, food, oligopoly, pork neck, rigidity of prices
METHOD
The Sweezy model of oligopoly
“This model was developed by Paul M. Sweezy in the late 1930s, to explain why prices in the oligopo-listic environment markets usually remain stable, despite the frequent and significant changes in terms of costs” (Frank 1995). When applying and analysing duopolistic models on food production examples, we usually assume that oligopolistic companies produce a homogenous product range, which they then offer for the same market price. “However, the product homogeneity is not at all typical for oligopolies. In P.M. Sweezy’s model, the product of each company is similar, but not an exact substitute of the competing company’s product” (Frank 1995).
Let us assume that the Sweezy model has two com-panies offering differentiated (distinct) products, e.g. pork meat products, and the company expects that the competing company will not react to the increased market price, but will react to its decrease by decreas-ing its own price as well. Duopolistic behaviour in the Czech food market can be shown in two multi-national retail chains like the Billa and Kaufland, and their pork meat products (for example, pork neck).
Figure 1 shows two demand curves d1 and d2. The first demand curve d1 is based on the assumption that the competing company will not react to the price change (P) made by the first of the two duopolistic companies. The second demand curve d2 is based on the assumption that the competing company will react to the price change of pork meat made by the first company. “Each demand curve has its own marginal revenue curve, as shown in Figure 1” (Schiller 2004).
If the existing market price level of pork meat of the first company is P*, then with a price of P1 > P*, the expected demand function will have a gentler gradi-ent (demand has a bigger price flexibility) in terms of the competition’s price P2 = const., since even a slight increase of P1 will cause a larger decrease of demand q1 due to the loss of a large portion of buyers. But when lowering the price P1 < P*, the pork meat demand function will have a steeper gradient (lower price flexibility), because the competing company will react to the decreased P1 by decreasing its P2, so the number of gained buyers will be smaller than the number of the lost ones during the increase of P1. The following conditions apply (Mach 1999):
0
2 1
P P
for P1 > P* (1)
0
1 2
P P
for P1 < P* (2)
“Sweezy explains these assumptions convincingly. If a certain company lowers its prices, it will take over the market shares of its rival companies until such a time that these companies react by adequately lowering their own prices. However, should any of these companies increase the price of their products, other rival companies, without having to do anything, may take over the market share just by maintaining their current prices” (Frank 1995).
The result of competing companies behaving in such a manner is a kinked demand curve, which consists of two segments: the first segment (less elastic) represents the reaction of a rival company to the decrease of the pork meat price by the first company; the second segment (more elastic) repre-sents the absent reaction of the rival company to the increase of the pork meat price by the first company (Severová and Šrédl 2010b).
[image:2.595.61.287.556.735.2]The kink of the demand curve AED is located at the point E. Due to the unusual shape of the demand curve, the marginal revenue curve (MR1, MR2) is not continuous. “The space between the marginal revenue curve means that the marginal costs may substantially change without changing the level of the output for which revenue is maximized” (Frank 1995). “Notice that this space only exists under the kink of the demand curve. It creates a cost cushion. If the marginal cost curve runs through the space in the marginal revenue curve, then a slight shift of the cost curve will not influence production deci-sions of the oligopolistic company. This means they do not have to decrease the output level, should Figure 1. Sweezy model
the costs increase slightly, or increase the level of output, should the costs decrease. This is why the output of oligopolistic companies does not change, neither does it change for a company in a competitive market, nor for a monopolistic company maximizing revenue” (Schiller 2004). We are also interested in what amount of the pork meat production q will the company maximize its revenue. If we introduce a marginal cost curve MC into the graph, we will dis-cover that the marginal revenue (MR) and marginal costs (MC) will not reach an equilibrium under any amount of the pork meat production (q).
“The cost cushion, represented by the space in the MR curve, will allow the oligopolistic company to maintain a given price for a longer period and to spend a larger amount on marketing (e.g. advertise-ments), when this need arises. In other words, the kinked demand curve means rigid prices” (Schiller 2004). We will assume the optimal amount of the pork meat production q is the output q*; if the company offers a larger amount of the produced pork meat than q*, then the growth of the company would be smaller than the growth of its costs and vice versa.
The Sweezy model of a duopoly with a kinked de-mand curve was created due to the need to explain the tendency of price rigidity, which occurred in some oligopolistic markets, e.g. in the case of food produc-ers, but it does not explain how the prices themselves are determined. The oligopoly model with a kinked demand curve and discontinuous marginal revenue curve can also be used for analysing the oligopolistic market situations, where more than two companies exist in the market, e.g. the food supply chains.
Methodology
The methodology of the paper is based on a com-parative analysis of the structure of commodities of chain stores in the Czech Republic in terms of the consumer demand and its change over time. The length of the time period is eight years from 2008 to 2015.
RESULTS
The food supply chains’ fight for customers, who are increasingly price conscious, has led to the crea-tion of private labels. The recent increase of the value added tax has also added to the renaissance of lower priced generic product brands. Due to the unrealistic increasing of prices in this model of the
oligopolistic competition, food supply chains expand their product range in the agrarian sector, including the above-mentioned meat products, and sell them under their own private labels. They expect that the demand will increase for private label products, as they are cheaper (lower MC) than the original brands.
Analysis of pork meat prices in the CZ with an international comparison
Numbers of pigs in Czech agriculture
By the end of 2009, farmers in the Czech Republic kept the lowest number of pigs in more than 60 years. As of December 1st, there were 1.913 million animals; only in 1946 were there less. Farmers in 2009 lowered the number of pigs in the Czech Republic by more than 10%. The production of pork meat decreased at a similar pace as well. It reached 284 572 tons in 2009, which is a year-on-year decrease of 10.2% (CSO 2015). The production of pork meat in the Czech Republic continued to decrease for five years in a row. It was only in 2014 that it was possible to stop this drop and to increase production by less than one percent to 236 thousand tons. The result of this long standing trend was the decrease of self-sufficiency of the Czech Republic in pork to 53%, while other agricultural products reached values exceeding 80%. This has lately been reflected in the purchase prices of slaughter pigs, which have been the lowest in four years and are lower than the costs of the farmers. According to the data from the Agricultural Association, farmers are now selling slaughter pigs to the meat processing companies for prices that are more than by 2 Czech Crowns lower than their production costs. After banning the export of pork meat into the Russian Federation, the purchase prices in the Czech Republic also began to drop to a critical level of less than 30 CZK per kg (Kütner 2015).
the imported meat are caused by the highly subsi-dized farming abroad. According to the Agricultural Association of the Czech Republic, increasing the budget of the fund is a good way to go, even though it is not enough to stabilize the pig farming situation; however, it will contribute to lowering the losses of farmers (Urban 2015).
Pork neck and its price
There is no need to introduce pork neck to meat lovers. When cooked with the bone, it keeps its shape and juiciness. Pork neck with bone can be baked in
rosemary, garlic, mushrooms, beer, together with chilli peppers, etc.; it can also be filled or marinated.
A comparison of private label prices of pork neck has been made in sales points of the selected food supply chains during two time periods. The initial period of research began in early 2009 (when the economy was influenced by the worldwide recession) or the peak of the crisis in 2010. The following period for the comparative analysis was 2014, when the Czech economy began reviving (Figure 2).
Figure 3 shows certain price policy differences of the pork meat product offered by the food supply chains – pork neck with bone.
The food supply chain Globus, during the period of 2009–2010, even decreased its price from 89.90 CZK to 79.00 CZK at the end of 2010. In 2014, the price of the pork neck with bone stabilized at 99.00 CZK and remained so for the entire year, while the price of this commodity is practically the same as the price offered by the food supply chain Billa.
The Billa chain is supplied by the monitored com-modity by the Czech company Vocílka and it most prominently shows the trends described in the Sweezy model. As the sales price of this commodity was fixed to 99.90 CZK for the entire monitored period of 2014– 2015, it is obvious that the price of the pork neck with bone did not change, i.e. the company did not react to the price changes of its competition (Figure 4). However, on the other hand, this price was the highest.
101.49 99.16 97.81 97.43 111.38 114.13 115.1 85 90 95 100 105 110 115 (CZK) 120
[image:4.595.68.286.96.211.2]2008 2009 2010 2011 2012 2013 2014
Figure 2. Average prices of 1 kilogram of pork neck from 2008–2014 (in CZK)
Source: Czech Statistical Office (2015)
Figure 3. Price development of the pork neck with bone in the chain Globus in 2010 and 2014–2015 (in CZK)
Source: own price survey
– 20.00 40.00 60.00 80.00 100.00 120.00 01/0 1/2014 01/0 3/2014 01/0 5/2014 01/0 7 /2014 01/0 9 /2014 01/1 1 /2014 01/0 1 /2015 01/0 3 /2015 01/0 5 /2015 01/0 7/2015 01/0 9/2015 01/1 1/2015 Globus 2014–2015 – 20.00 40.00 60.00 80.00 100.00 (CZK) 120.00
4 4 4 4 4 4
[image:4.595.65.289.444.709.2]– 20.00 40.00 60.00 80.00 100.00 120.00 01/0 1 /2014 01/0 3 /2014 01/0 5 /2014 01/0 7 /2014 01/0 9 /2014 01/1 1 /2014 01/0 1 /2015 01/0 3 /2015 01/0 5 /2015 01/0 7 /2015 01/0 9 /2015 01/1 1 /2015 Billa 2014–2015 Kaufland 2014–2015
Figure 4. Price development of the pork neck with bone in the chain Billa and Kaufland in 2014–2015 (in CZK)
Source: own price survey
– 20.00 40.00 60.00 80.00 100.00 (CZK) 120.00
[image:4.595.309.531.480.709.2]Besides the differences caused by the costs of the sale itself, the following competing chains – the Kaufland and Tesco – have also been influenced by the discount sales in 2015, ranging between 10–20 CZK per kg of the pork neck. The price of the pork neck stayed the same, in average, as in 2014, at the price of 89.90 CZK (Figure 4). However, this changed in the second half of 2015, when the price dropped to a stable 78.90 CZK. This was caused by the international connection of the K-Purland products, as the meat processing plant in Modletice near Prague also processes meat for the sales points in Germany (600 department stores) and in Slovakia. Here we can see a much greater influence of the price drops of pork meat in Europe due to the increased offers caused by the export embargo of meat into the Russian Federation.
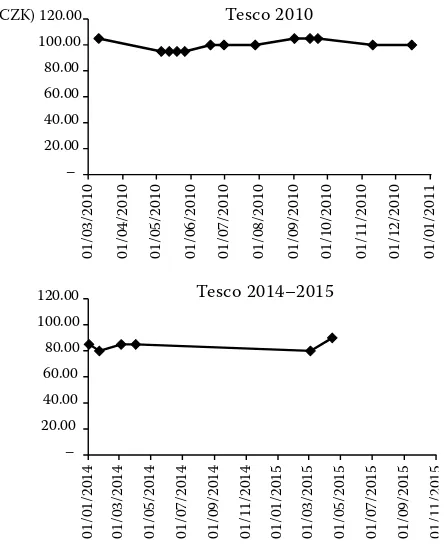
Th e Tesco, a food supply chain with the British capital, also uses discount sales; however, the basic price of its private label pork neck was 79.90 CZK, the same as in the Kaufl and in 2015. Unlike the Kaufl and, the Tesco increased its basic price to 84.90 CZK in 2015 (Figure 5). In the case of the Kaufl and, the infl uence of its own production plant is visible in the price of the product. It is possible to say that even though the prices of input materials during the monitored period changed (fuel, breeding, etc.), the prices of the
com-modities off ered did not change in relation to the price reactions of the rival companies. Th ey show a certain rigidity (best seen in the Billa), but, at the same time, they are distinct, due to the various trade costs of the companies. “Th e elasticity of price in demand of agri-products is generally low, though diff erent in the particular products” (Bielik and Šajbidorová 2009).
Number of food products offered under private labels of retail chains
For example, the Ahold company has placed more than 1000 new private label products (Euro Shopper and Albert Quality) on the shelves of its Albert stores. In early 2008, it only offered 550 private label products in its Albert and Hypernova stores; the Euro Shopper offers the lowest prices, and the Albert Quality is a label promising high quality products. During the current economic situation, it is possible to see the increased interest in the range of the Ahold private label products, which, in terms of the price-quality ratio, represent a good alternative to so-called brand name products. According to the sellers, the customers are most interested in the commodity food items, i.e. milk, oil, rice and flour. The largest share of private label products is in the meat category, where it reaches an 80% share in comparison to other products.
The food supply chain Kaufland, a part of the Schwarz family company, is currently offering more than 1500 products through its K-Classic private label, where it guarantees the controlled quality for discount prices. It offers, for example, 35 types of cheese and other cheese specialities. Meat products are offered by this chain under the K-Purland private label.
In connection with higher VAT rates as of January 2012, the Billa decided to maintain the prices of its Clever product range at the same levels as the previous year. The Clever is represented in the Billa product range with more than 500 food and non-food products; a more intense communication about the prices of this product range is currently considered to be a competitive advantage.
At present, the Tesco supply chain is off ering 648 prod-ucts under the Tesco Value label (this product range has existed since 2001 and it includes the most popular daily consumed items) and nearly 1900 Tesco Standard products (introduced in 2002), which off er the brand name quality, but for prices lower by 15%. Each year, their amounts increase by roughly one third, and the private label products currently represent nearly 25% of the entire food range in the Tesco Stores ČR.
– 20.00 40.00 60.00 80.00 100.00 (CZK) 120.00
01/0
3
/2010
01/0
4
/2010
01/0
5
/2010
01/0
6
/2010
01/0
7
/2010
01/0
8
/2010
01/0
9
/2010
01/1
0
/2010
01/1
1
/2010
01/1
2
/2010
01/0
1
/2011
– 20.00 40.00 60.00 80.00 100.00 120.00
01/0
1
/2014
01/0
3
/2014
01/0
5
/2014
01/0
7
/2014
01/0
9
/2014
01/1
1
/2014
01/0
1
/2015
01/0
3
/2015
01/0
5
/2015
01/0
7
/2015
01/0
9
/2015
01/1
1
[image:5.595.68.291.436.709.2]/2015
Figure 5. Price development of the pork neck with bone in the chain Tesco in 2010 and 2014–2015 (in CZK)
Source: own price survey
Tesco 2010
Offer of the retail chain private labels among the offered products in 2010
The share of the in-house private labels of the re-tail chains started to stagnate in 2009, when people did not yet register the financial crisis in their wal-lets. They were rather used to discount sales of the standard brand name products. We understand the main reason for this to be the offers of the brand name products for promotional prices, which steadily increased in number and became a competitive tool for the chains. The shift back to cheaper products under private labels began in 2010, when their share in the domestic market increased slightly from 23.3 to 25.2%.
In 2010, the private labels of retail chains had al-ready gained a one-quarter domestic market share. In 2005, the share of in-house private labels had reached 18.2%, but in 2009 it was already 23.3%, as
we can see in the annual report of the Private Label Manufacturers Association (Figure 6).
The largest representation of private labels in the Czech Republic could be seen in the toilet paper and hygienic tissue products, where every second prod-uct was sold under the chain’s own private label. A high share could also be registered by the pet food (51.4%) and frozen foods and ice-creams (41.6%). Milk beverages showed the largest market share growth.
However, alcoholic beverages are fairly immune to the pressure of private labels (a mere 11% share). A relatively small, approximately one-fifth share is represented by skin care products, oral hygiene and confectionary products. The chains also see space for a further growth of their private labels because, e.g. in the Netherlands these represent a 40% share, and more than one third share in Germany (2010).
The current share of private labels among offered products in retail chains in the Czech market
In the modern market economy where the supply exceeds demand, the importance of the “consumer’s behaviour in the market analysis” continuously in-creases (Šrédl et al. 2013). Czech consumers’ trust in private labels has increased recently. The average share of the private label food products and other types of products sold in the retail chains has ex-ceeded the 30% mark for the first time in the Czech Republic. While four years ago the private labels of retail chains had only a 25% share of the goods sold in the Czech Republic, in 2013 this share was already 31%. These statistics are based on the information contained in the annual report of the Private Label Manufacturers Association (PLMA). The largest amounts of the private label products are currently sold in Switzerland (53%) and Spain (51%). In the Great Britain, Portugal, Germany, Belgium and Austria, the private label products represent four out of every ten products offered in stores. The largest European share increases of this type of products in 2013 were registered in Sweden, Finland, Poland and Slovakia (PLMA 2014).
This is positive news for retailers, even though the Czech Republic is still behind the neighbouring countries in terms of the private label revenue share and the expense share of households. On the other hand, not a single monitored country comes close to the purchase share of the promotionally priced brand name products as in the Czech Republic. The
high-18.2
23.3 25.2
20
31
15
0 10 20 30 (%) 40
2005 2009 2010 2011-12 2013
Share of private labels
[image:6.595.65.289.97.226.2]Share of consumers which buy private labels regularly
Figure 6. Share of goods with private label brands in chain stores in the Czech Republic (in %)
Source: PLMA (2014)
Table 1. Share of the retail chain private labels in stores in 2010 (in %)
Country Share
Switzerland 52.6
Spain 48.6
Great Britain 46.7
Austria 38.4
Germany 36.9
France 36.0
Slovak Republic 28.4
CR 25.2
Poland 24.1
Italy 19.1
[image:6.595.64.291.588.740.2]est share of the private label products is in Slovakia (29%); the lowest share in the countries neighbouring the Czech Republic is in Poland (24%) (Figure 7).
Retail chains offer hundreds, if not more than a thousand, private label items. The Tesco and Billa have registered similar sales as in the previous year. According to the Tesco spokesperson, the private label revenues represented roughly one third share and no significant change could be seen compared to the previous year. For the Billa, this amounted to a 14.9% share, also similar to the previous year’s sales. The Makro and Globus stores registered an increase; the Makro sales increased by nearly 16% and the Globus by 5% (Figure 8) (Kütner 2013).
The Globus registered an increased demand for the basic food items in the range of fresh and non-perishable foods. Also according to its marketing director, Libor Tomáš, the Czech Republic still be-longs among the countries with a rather low share of private labels. When compared to the Globus in
Germany, the share of private labels in the Czech Globus is lower, and, even after three years, it is still in its growth phase.
The Lidl will also “invest” in its private labels, as its business concept is based on private label products. Private label products represent 80% of the chain’s product range, which it constantly modifies and ex-pands. It intends to carry on in this manner also in the future. In the previous year, the Lidl added the Biotrend label to its product range, offering organic fruit and vegetables.
As stated by the Incoma Shopping Monitor by the Incoma GfK, Czech consumers are losing interest in products produced for the private labels of retail chains. Only 15% of the respondents stated that they regularly buy them; this is the lowest percentage since the beginning of this survey in 2007.
They stated that the reason for losing interest is the fast growing share of the brand name products sold for promotional prices, which, in the Czech Republic, is estimated to near 50% of purchases made in the Czech retail chains. Prices of the brand name products are often similar to the private label products, which then lose one of their key competitive advantages. The increasing popularity of the promotionally priced products causes the interest in the retail chain private labels to decrease, as they are considered cheap by most customers.
DISCUSSION
Verifying the feasibility of the Sweezy model
The conclusion resulting from the stated model (Figure 1) is that changes of the company costs caused by the increase of the input material prices do not change the prices of products (in our case, of the pork neck) and this is what defines price rigidity in the oligopolistic markets according to the Sweezy model.
Because a majority of agricultural primary pro-ducers were suffering from the long-term financial losses, this resulted in a significant reduction of ag-ricultural production, finally leading to the decrease of the pig, cattle, sheep and other animal numbers. This caused the prices of the agricultural product processing companies to increase, who then had to reflect these price increases into the prices for their customers (retail chains). The increase of fuel prices by nearly one third also significantly increased the cost of transport for these commodities. Private labels
29 27
25 24
20 18
10 9
4 2
0 5 10 15 20 25 30 (%) 35
Slovakia Hungary Austria Poland
Czech Rep.
[image:7.595.66.288.102.219.2]Croatia Bulgaria Romania Serbia Russia
Figure 7. The share of private labels in household’s expenditures in 2012 (in %)
Source: Incoma GfK Czech (2014)
Figure 8. The share of private labels in products offered by the individual retail chains in the Czech Republic in 2014 (in %)
Source: Incoma GfK Czech (2014)
80
33
20 16
15 14.9
5
0 20 40 60 80 (%) 100
Lidl
Tesco Ahold Makro
Kaufland
Billa
[image:7.595.63.290.566.701.2]are also suitable for producers due to the purchase of large volumes; usually a single company produces for the entire chain (including stores abroad), and they usually have a uniform inexpensive package. However, some producers warn that the retail chains often require the lowest prices, possibly negatively influencing the quality.
Food supply chains are primarily focused on selling products to standard consumers; this is why it is nec-essary to take into account that currently two thirds of the employed population in the Czech Republic receives less than the average income. This is why it is not possible to reflect the increased purchase prices into consumer prices without decreasing sales of such products. At the beginning of the recession, mainly people with the lower education and income, but also seniors, registered their influence on the purchase of food items. At present, nearly all customer groups register it, including university students and the households from the higher income groups.
Domestic retail chains are faced with a difficult problem. Their customers are more and more careful with their money, but also more of them are focusing on the product quality and refusing to purchase the cheapest items available. This is why the supermarkets are trying to improve the reputation of their “price warriors”, i.e. the cheapest private label products of the chain, by refurbishing them.
“Nearly one quarter of the respondents state that the increase of food related expenses represents the highest share of the household expense growth. This forces Czech people to manage their food better and to purchase lower quality, but cheaper products” (Provident Financial 2014) This was determined by a survey for the Provident Financial, conducted in January 2014 by the You-Gov research agency among 4000 customers in the Czech Republic. Sixty percent of consumers are reacting to such a situa-tion by managing their food better and throwing less out. Nearly half of the respondents, however, buy cheaper food.
Improving the image of private labels
Supermarkets are seeing the efforts of people to save money, which is leading to a steady decrease of the food sales. They are trying to reverse this trend by, for example, improving the image of the private labels, which, until recently, were focused primarily on low prices. But now they must also think of how to sell their products with the best marketing possible.
For example, the Ahold, the operator of the Albert supermarkets and hypermarkets, introduced a new private label in January 2014 called the Basic, which during the following years should replace the cheapest Ahold products sold under the label Euro Shopper. The difference in the new label when compared to the Euro Shopper label is a better quality product for a low price (e.g. potato dumplings containing a higher share of potato flakes), a wider product range (more traditional products from other countries) and products labelled Vím, co jím (I know what I am eat-ing), which targets the consumers conscious about the amounts of salt or trans fats. The survey states that 20% of consumers regularly purchase private labels, which represents a year-on-year increase of 5%. However, the consumers do not want to just save money; they are looking for the right price, which explains why the Ahold created its cheapest label (Špačková 2014).
The Billa is also trying to expand its offer of private labels and plans to find more domestic suppliers, mainly for their Naše Bio label (Our Organic Products), which is gaining popularity among the with people living a healthy lifestyle. The Tesco is expanding its product range of all its private labels, not limiting expansion to its cheapest Tesco Value label.
Exporting private label products
Czech food producers exported in 2013 through the Lidl discount retailer, under its private label, goods amounting to 4our billion Czech Crowns, a year-on-year increase of 900 million Crowns. The discount retailer made it possible for the products from companies like the Krahulík, Kostelecké uzen-iny, Veseta, Alimpex – maso, Delimax and Mlékárny Čejetičky to get into foreign stores.
K-Purland meat is the best appreciation this private label can receive.
CONCLUSION
Experts estimate that the share of private labels will continue growing. The Czech Republic lags behind many European countries in this aspect. However, the increasing growth of the economy may be visible in the revenue of retail chains in 2015. If the condition of the economy significantly positively influences the income of the citizens, unemployment and the general economic environment, the behaviour of Czech consumers may significantly change. This has been confirmed by the latest survey conducted by the Incoma GfK. The worries regarding economic uncer-tainty influence the purchase of food and drugstore goods for the households by up to 80%, one year ago, 60% of households acknowledged this influence, in 2009, it was a mere one third. This is why people may buy more private labels from the retail chains, which are cheaper than the classic brand name goods. It is possible that they may turn more to the discount retailers. It may not be because they have signifi-cantly lower prices, but because they offer a rather small basket of goods, so the households seemingly consume less.
We are following a strong consumer behaviour trend, which began about four years ago. Customers think much more about their purchases and they are looking for the lowest market prices. Currently, the quality of goods offered for an adequate price is important to the consumer, and this is what the discount retailer labels offer. A remaining problem is the purchases of consumers in locations without the retail chains and with insufficient transport services.
REFERENCES
Bielik P., Šajbidorová Z. (2009): Elasticity of consumer de-mand on pork meat in the Slovak Republic. Agricultural Economics, 55: 12–19.
Czech Statistical Office (CSO) (2015): Agriculture. Avail-able at https://www.czso.cz/csu/czso/cri/zemedelstvi-3-ctvrtleti-2015
Frank R.H. (1995): Mikroekonomie a chování. Svoboda, Praha.
Incoma GfK (2014): Shopping Monitor. Available at http:// www.incoma.cz/cz/
Kütner D. (2013): Privátní značky na trhu dál stagnují. E15, March 7, 2013: 8.
Kütner D. (2015). Stát letos přidá na chov prasat tři sta milionů. E15, July 2, 2015: 1. Available at http://zpravy. e15.cz/byznys/zemedelstvi/stat-letos-prida-na-chov-prasat-tri-sta-milionu-1205652
Mach J. (1999): Obecná ekonomie I. Mikroekonomie. ČZU v Praze, Praha.
PLMA (2014): Yearbook of PLMA. Available at http://www. plmainternational.com/
Provident Financial (2014): Narůstající ceny potravin nutí Čechy kupovat méně kvalitní jídlo. Available at http:// www.providentfinancial.cz/NewsDetail/33
Samuelson P.A., Nordhaus W.D. (2007): Ekonomie. Svo-boda, Praha.
Severová L. Šrédl K. (2010a): Oligopolní konkurence nad-národních obchodních řetězců v podmínkách integrující se Evropy. Auspicia, 1: 54–57.
Severová L., Šrédl K. (2010b): Oligopoly competition on food market – theory and practice. In: Proceedings from Agrarian Perspectives Conference XIX, Praha PEF ČZU, Praha, Sept 9, 2010: 133–143.
Schiller B.R. (2004): Mikroekonomie dnes. Computer Press, Brno.
Stigler G. (1978). The literature of economics: the case of the kinked oligopoly demand curve. Economic Inquiry, 16: 185–204.
Sweezy P. (1939): Demand under conditions of oligopoly. The Journal of Political Economy, 47: 568–573. Špačková I. (2014): Supermarkety se snaží přidat lesk
cenovým bojovníkům. MF DNES, Feb 26, 2014: 8A. Šrédl K., Soukup A., Severová L. (2013): Models of
con-sumer’s choice. E & M Ekonomie a Management, 2: 4–9. Urban P. (2015): Boj o česká prasata. Metro, October 16,
2015: 8.
Varian H.R. (1995): Mikroekonomie. Victoria Publishing, Praha.