405 Supported by the Ministry of Agriculture of the Czech Republic (Projects No. QK1810253 and No. MZeRO0718) and by the Czech University of Life Sciences Prague (Project No. SV19-07-21360).
Impact of reference population size and marker density
on accuracy of population imputation
Anita Kranjčevičová
1,2*, Eva Kašná
2, Michaela Brzáková
1, Josef Přibyl
2,
Luboš Vostrý
11Department of Genetics and Breeding, Faculty of Agrobiology, Food and Natural Resources, Czech University of Life Sciences Prague, Prague, Czech Republic
2Department of Genetics and Breeding of Farm Animals, Institute of Animal Science, Prague-Uhříněves, Czech Republic
*Corresponding author: [email protected]
Citation: Kranjčevičová A., Brzáková M., Kašná E., Přibyl J., Vostrý L. (2019): Impact of reference population and marker density on accuracy of population imputation. Czech J. Anim. Sci., 64, 405–410.
Abstract:The effect of the reference population size and the number of missing single nucleotide polymorphisms (SNPs) on imputation accuracy was determined. The population imputation method using the FImpute software was applied. The dataset used for the purpose of this study was taken from the database of the Holstein Cattle Breeders Association of the Czech Republic. It contains 1000 animals genotyped with the Illumina BovineSNP50 v.2 Bead-Chip. Two datasets were created, the first containing the original genotypes, including the missing SNPs, the second containing the same genotypes modified to avoid missing data. In these datasets, animals were randomly selected for a reference population (10, 25, 50 and 75%) and there were randomly selected SNPs for deletion (15, 30, 55, 70, and 95%) in animals that were not used as the reference population. Subsequently, the data accuracy was determined by two parameters: correlation between original and imputed SNPs and percentage of correctly imputed SNPs. Since animals and SNPs were randomly selected, the process including data imputation was repeated 100 times. Accuracy was determined as the average accuracy over all repetitions. It was found that the imputation accuracy is influenced by both parameters. If the size of the reference population is sufficient, the imputation accuracy is higher despite the large number of missing SNPs.
Keywords: cattle; genomics; marker density; missing SNPs; simulation
The genomic selection, where genomic breeding values are calculated by means of single nucleotide polymorphisms (SNPs), is used in dairy cattle in many countries (Hayes et al. 2009). The interest in this technology was induced by the availability of commercial high density SNP chips, by increased genetic gain compared to conventional animal performance testing due to a reduction in the generation interval, and by a higher accuracy of the selection of breeding animals at a younger age
406
programs from this category are AlphaImpute (Hickey et al. 2011), Beagle (Browning et al. 2018), Findhap (VanRaden et al. 2015) and PedImpute (Nicolazzi et al. 2013). Imputation is a key strategy for obtaining information on animal genotypes at a lower cost (Whalen et al. 2018). Sometimes, no strong relation-ship between individuals is assumed, and therefore imputation without pedigree information is needed. In this case, population imputation should be used and this option is offered by the FImpute software (Sargolzaei et al. 2014). The population imputation assumes that the individuals are not related and close relationships between individuals are used indirectly. It captures similarities between the in-dividuals using long shared haplotypes (Browning and Browning 2011). Closer relatives usually share longer haplotypes, while more distant relatives share shorter haplotypes. The imputation accuracy is in-fluenced by several factors, such as the number and composition of individuals in the reference group, effective population size, and differences between reference and imputed genotype densities (Sargolzaei et al. 2014). On the contrary, the Beagle software is based on a haplotype-cluster model that groups lo-cally possible haplotypes into clusters and offers the addition of atypical genotypes, haplotype phasing, and multiallelic manipulation markers (Browning et al. 2011). It is a very precise but computationally demanding method (Sargolzaei et al. 2014).
MATERIAL AND METHODS
Data used for the purpose of this study were ob-tained from the Holstein Cattle Breeders Association of the Czech Republic. The Czech Holstein population was created by grading-up the local Black-Pied popu-lation and part of the Czech Fleckvieh popupopu-lation with imported Holstein sires and by a later import of purebred heifers in the 1990s. The present population is open with the import of bulls from abroad. A total of 1000 genotyped animals were used in this study. The population consisted of 51% males and 49% females born between 1993 and 2015. The Czech Republic was a country of origin of all females. The bulls came from 13 countries. Most of them (33%) came from the international exchange with Switzerland, 25% were from the Czech Republic, 14% from the Neth-erlands. Illumina BovineSNP50 v.2 BeadChip is the most widely used in our database, and we consider it as a reference chip in data imputation for the
es-timation of genomic breeding values. The database was used to create two datasets. In both cases only autosomes were considered. Dataset A included the original genotypes containing 52 826 SNPs. In this case, the genotypes also contained missing data. In dataset B, the missing data were discarded and the total number of 37 688 SNPs was used. Both data-sets have been modified to be used in the FImpute software. FImpute software was chosen for simple input data editing and very fast calculation. Al-leles were recorded with 0 for genotype AA, 1 for genotype AB, 2 for genotype BB and 5 for missing genotype. For imputation, the default parameter file for population imputation was used (Sargolzaei et al. 2014). Because we did not have the same animals genotyped on panels with different densities, we simulated less dense panels by deleting a part of the SNPs. To test the accuracy of population im-putation we set two main parameters, namely the size of the reference population and the number of deleted markers. The size of the reference popula-tion was determined as a percentage of genotyped animals, where a segment of the SNPs was not deleted. Animals were randomly selected for the reference population at levels 10, 25, 50 and 75% (100 to 750 animals). For animals that were not a part of the reference population 15, 30, 55, 70 and 95% of SNPs were randomly deleted. Thus, 20 test files for each dataset were created. Each file with different levels of reference population and deleted markers was subsequently imputed by FImpute software (Sargolzaei et al. 2014) This method of modifying data to determine imputation accuracy is called genotype masking (Gurgul et al. 2014). Ac-curacy was determined as the correlation between the original SNP value before deletion and its value after imputation (Hickey et al. 2011; Carvalheiro et al. 2014). Since the selection of individuals for the reference population and the selection of SNPs that were deleted were random, the entire process, including data imputation, was repeated 100 times. A total of 2000 imputations were made for each dataset. The resulting accuracy was calculated as the average of accuracies for all repetitions.
where:
n = number of repetitions SNPBD = SNP code before deleting SNPAI = SNP code after imputation
3 Average accuracy =∑ cov(SNP
��, SNP��) σ�����× 𝜎𝜎�����
� ���
407
For further assessment of accuracy, the percent-age of correctly imputed genotypes (PERC) was determined. It was determined as a percentage of the match between the original and the imputed genotype (Carvalheiro et al. 2014; Gurgul et al. 2014). Both parameters were calculated only for imputed SNPs that were masked before imputation.
RESULTS AND DISCUSSION
Imputation accuracy.The resulting average
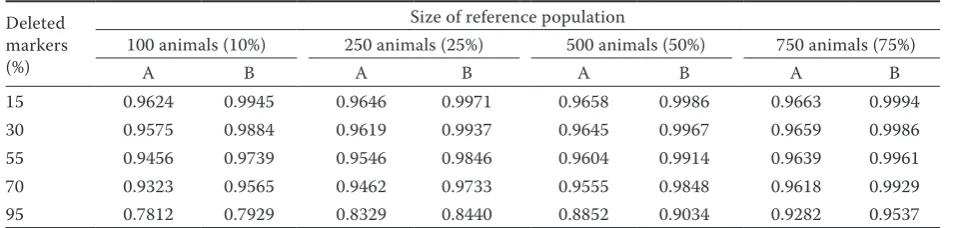
population imputation accuracy depending on the size of the reference population and the density of deleted markers is shown in Table 1. The specific number of deleted markers for datasets A and B is presented in Table 2. We can observe that the expected imputation accuracy values depend on the dataset composition. Higher accuracy ranging from 0.79 to 0.99 was achieved in dataset B, which contained only complete information without missing values. The average accuracy in dataset A, which contained basically missing values in the genotype, was slightly lower but still high in the range from 0.78 to 0.96. In our study, the accura-cies had similar values like the calculated ones in the form of correlation between the original and imputed SNPs, which is consistent with the study of Carvalheiro et al. (2014). Taking into account the reference population size, it can be seen that the imputation accuracy on average in-creases with the size of the reference population, which is compatible with the results of the study published by VanRaden et al. (2011). The lowest imputation accuracy was found in the 10% refer-ence population ‒ it ranged from 0.78 to 0.96 in dataset A and from 0.79 to 0.99 in dataset B. Dif-ferences were dependent especially on the number
[image:3.595.304.533.126.212.2]of deleted SNPs. The results are consistent with an assumption that increasing amounts of deleted SNPs result in a decrease of average imputation accuracy. This fact was observed across all sizes of the reference population in both datasets. The highest average accuracy was achieved in the refer-ence population with 75% of genotyped animals. It ranged from 0.93 to 0.96 in dataset A and from 0.95 to 0.99 in dataset B. With the 25% and 50% reference population size a similar imputation accuracy was obtained. For dataset A, it ranged from 0.83 to 0.96 for 25% reference population and from 0.86 to 0.97 for 50% reference popula-tion. For dataset B, it ranged from 0.84 to 0.99 for 25% reference population and from 0.90 to 0.99 for 50% reference population. An interesting situation was observed in cases with a low level of missing SNPs, where the differences between the reference populations were not so perceptible. Therefore, it can be assumed that in the case of a small number of missing genotypes, the size of the reference population is not so important. On the other hand, the results of the study show that, despite the large number of missing genotypes like in the case with 95% of missing genotypes, relatively high imputation accuracy values were achieved in the range of 0.78‒0.79 even in the smallest refer-ence population containing only 100 animals. By
Table 1. Average accuracy of population imputation for datasets A1 and B2
Deleted markers (%)
Size of reference population
100 animals (10%) 250 animals (25%) 500 animals (50%) 750 animals (75%)
A B A B A B A B
15 0.9624 0.9945 0.9646 0.9971 0.9658 0.9986 0.9663 0.9994
30 0.9575 0.9884 0.9619 0.9937 0.9645 0.9967 0.9659 0.9986
55 0.9456 0.9739 0.9546 0.9846 0.9604 0.9914 0.9639 0.9961
70 0.9323 0.9565 0.9462 0.9733 0.9555 0.9848 0.9618 0.9929
95 0.7812 0.7929 0.8329 0.8440 0.8852 0.9034 0.9282 0.9537
[image:3.595.61.539.623.737.2]1dataset A includes original genotypes, 2dataset B includes a modified file with genotypes
Table 2. Number of single nucleotide polymorphisms (SNPs) to be imputed in datasets A and B
SNPs (%) Dataset A (n = 52 826) Dataset B (n =37 688)
15 7 924 5 653
30 15 848 11 306
55 29 054 20 728
70 36 978 26 382
408
comparison, Carvalheiro et al. (2014) reported an accuracy of imputation 0.97 from 50K chip to HD chip. This corresponds approximately to 95% of missing SNPs. In this case, the reference population contained 79% of the genotyped animals (Carvalheiro et al. 2014). In another study on the effect of the reference population size on imputation accuracy by Ventura et al. (2014), comparable results were also reported. There was an imputation from 6K chip to 50K chip and the missing SNPs accounted for about 65%. A total of 2300 genotyped animals were used and three reference populations were tested with 11, 33 and 65% of the animals in reference populations. The resulting imputation accuracy using FImpute was 0.87 for the first population, 0.93 for the second population, and 0.94 for the largest reference popula-tion. A similar imputation scenario from 6K to 50K was also used by Wang et al. (2016). In this case the reference population consisted of about 80% of the total number of animals. The resulting population imputation accuracy with FImpute was 0.92. Ventura et al. (2014) argued that if the reference population was too small, the inclusion of relatives should be a priority to improve imputation accuracy. Adding key close relatives to the reference population increases the imputation accuracy up to 3%. The effect of the reference population size on imputation accuracy was also studied by Ghoreishifar et al. (2018) in water buffaloes. FImpute was used for imputation again, but this time with the difference that the pedigree information was included. The 10K chip was imputed to the 90K chip, the number of missing SNPs was 73%. Several reference population sizes were tested. In comparison with our study, sizes of 30, 52 and 80% were mentioned. The resulting imputation ac-curacy was 0.88 for 30% reference population, 0.93 for 52% reference population, and 0.97 for 80% ref-erence population. We obtained higher accuracies
for datasets A and B in our study: for populations of 25% (0.94; 0.97), 50% (0.95; 0.98) and 75% (0.96; 0.99). Higher values of imputation accuracy can be observed despite the absence of pedigree informa-tion. This may be due to the high genetic similarity of the test individuals in our population and the capture of a greater number of shared haplotypes.
Percentage of correctly imputed SNPs.When we
look at the percentage of correctly imputed SNPs in Table 3, we can observe the same trend as for imputation accuracy. In general, higher values are observed for dataset B again, where the reference population consists of animals without missing SNPs. PERC values, depending on the size of the reference population, ranged from 0.78 to 0.99 for dataset A and from 0.77 to 0.99 for dataset B. Higher values were reached with larger reference population size and lower number of missing SNPs. Carvalheiro et al. (2014) imputed the 50K chip to the HD chip (cor-responding to 95% of missing SNPs and 79% of the reference population size), with the PERC value of 0.97. In our study, the final percentage for the 75% reference population size and 95% of missing mark-ers was slightly lower than 0.94. The low value may be due to a lower number of SNPs in the reference genotypes and a slightly smaller reference popula-tion. PERC values may also be affected by incorrect imputation of one or both alleles.
Selection of reference chip.Theselection of
[image:4.595.62.537.623.737.2]Illu-mina BovineSNP50 v.2 BeadChip was intentional. Animals genotyped on this chip represent about 75% of all animals in the whole database that was used in our study. Thus, if we focus on the 75% reference population, the average imputation accuracy de-pending on the number of deleted SNPs shows the expected trend, which is presented in Figure 1. A very small increase in dataset B is observed, due to the absence of missing reference genotypes. But on
Table 3. Average percentage of correctly imputed SNPs for datasets A1 and B2
Deleted markers (%)
Size of reference population
100 animals (10%) 250 animals (25%) 500 animals (50%) 750 animals (75%)
A B A B A B A B
15 0.9914 0.9929 0.9939 0.9963 0.9956 0.9982 0.9965 0.9993
30 0.9843 0.9846 0.9900 0.9919 0.9933 0.9956 0.9956 0.9981
55 0.9683 0.9661 0.9800 0.9798 0.9876 0.9888 0.9931 0.9949
70 0.9509 0.9447 0.9688 0.9656 0.9808 0.9806 0.9898 0.9899
95 0.7789 0.7672 0.8388 0.8212 0.9000 0.8894 0.9440 0.9440
409
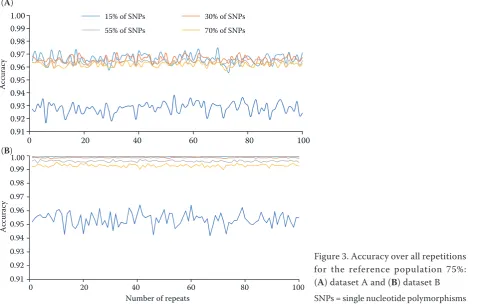
average, imputation accuracies in datasets A and B are not very much different. An even less different course can be seen in PERC in Figure 2. However, if we look at the course of accuracy estimation over all the repetitions shown in Figure 3A
(
dataset A) and 3B (dataset B), some differences can be observed. In Figure 3A for dataset A, the curves for the number of deleted SNPs (15, 30, 55 and 70%) overlap sig-nificantly and their course is difficult to recognize. On the other hand, in Figure 3B for dataset B, the individual curves for the number of deleted SNPs can be easily recognized. Their distribution is consistent with an assumption that the imputation accuracy decreases as the number of deleted SNPs increases.Overlapping wave-formed curves in dataset A may be affected by the occurrence of missing SNPs in animal genomes in the reference population. However, the imputation accuracy of the 75% reference population can be evaluated as high, regardless of the number of deleted SNPs. Imputation can play a major role in predicting genomic breeding values (GEBV). It enables to include a higher number of genotyped animals in the estimation of GEBV and thereby increase the accuracy of the estimation (VanRaden et al. 2011). Mulder et al. (2012) found that GEBV accuracy increases linearly with increasing imputa-tion accuracy. This means that only SNPs with high imputation accuracy have a positive effect on GEBV
0.91 0.92 0.93 0.94 0.95 0.96 0.97 0.98 0.99 1.00
A
cc
ur
acy
Proportion of deleted SNPs (%)
Dataset A Dataset B
[image:5.595.305.529.94.212.2]15 30 55 70 95
Figure 1. Average accuracy for reference population 75% depending on the proportion of deleted single nucleotide polymorphisms (SNPs)
Figure 2. Average percentage of correctly imputed single nucleotide polymorphisms (SNPs) for reference popula-tion 75% depending on the number of SNPs
0.94 0.95 0.96 0.97 0.98 0.99 1.00
PE
RC
Proportion of deleted SNPs (%)
Dataset A Dataset B
15 30 55 70 95
0.91 0.92 0.93 0.94 0.95 0.96 0.97 0.98 0.99 1.00
0 20 40 60 80 100
A
ccura
cy
15% of SNPs 30% of SNPs 55% of SNPs 70% of SNPs
(A)
[image:5.595.65.284.97.212.2](B)
Figure 3. Accuracy over all repetitions for the reference population 75%: (A) dataset A and (B) dataset B
SNPs = single nucleotide polymorphisms
0.91 0.92 0.93 0.94 0.95 0.96 0.97 0.98 0.99
1
A
cc
ur
ac
y
Number of repeats
15% of SNPs 30% of SNPs 55% of SNPs 70% of SNPs
0 20 40 60 80 100
[image:5.595.64.546.454.758.2]410
reliability. Obviously, if animal genotypes are not perfectly imputed, there is a very small reduction in GEBV accuracy (Daetwyler et al. 2011).
CONCLUSION
The results of our study showed that the size of the reference population and the number of deleted SNPs affect the population imputation accuracy. If a sufficient reference population size is selected, the imputation accuracy is high despite the larger percentage of missing SNPs. However, the small size of the reference population could reduce the imputation accuracy of rare variants that were not paid attention in this article. In this case, individu-als with rare variants should be included in the reference population. In conclusion, population imputation is a suitable method for populations that are not closely related.
Acknowledgement. We thank the Holstein Cattle
Breeders Association of the Czech Republic for providing the data without which this study could not be realized.
REFERENCES
Browning S., Browning B. (2011): Haplotype phasing: Ex-isting methods and new developments. Nature Reviews Genetics, 12, 703–714.
Browning B., Zhou Y., Browning S. (2018): A one-penny imputed genome from next-generation reference panels. The American Journal of Human Genetics, 103, 338–348. Carvalheiro R., Boison S., Neves H., Sargolzaei M., Schenkel F., Utsunomiya Y., O’Brien A., Solkner J., McEwan J., Van Tassell C., Sonstegard T., Garcia J. (2014): Accuracy of genotype imputation in Nelore cattle. Genetics Selection Evolution, 46, 69.
Daetwyler H., Wiggans G., Hayes B., Woolliams J., Goddard M. (2011): Imputation of missing genotypes from sparse to high density using long-range phasing. Genetics, 189, 317–327.
Ghoreishifar S.M., Moradi-Shahrbabak H., Moradi-Shahrb-abak M., Nicolazzi E.L., Williams J.L., Iamartino D., Nejati-Javaremi A. (2018): Accuracy of imputation of single-nucleotide polymorphism marker genotypes for water buffaloes (Bubalus bubalis) using different refer-ence population sizes and imputation tools. Livestock Science, 216, 174–182.
Gurgul A., Sienko K., Zukowski K., Pawlina-Tyszko K., Bug-no M. (2014): Imputation accuracy of bovine spongiform encephalopathy-associated PRNP indel polymorphisms from middle-density SNPs arrays. Czech Journal of Ani-mal Science, 59, 224–249.
Hayes B., Bowman P., Chamberlain A., Goddard M. (2009): Invited review: Genomic selection in dairy cattle. Journal of Dairy Science, 92, 433–443.
Hickey J., Kinghorn B., Tier B., Wilson J., Dunstan N., van der Werf J. (2011): A combined long-range phasing and long haplotype imputation method to impute phase for SNP genotypes. Genetics Selection Evolution, 43, 12. Mulder H., Calus M., Druet T., Schrooten C. (2012):
Impu-tation of genotypes with low-density chips and its effect on reliability of direct genomic values in Dutch Holstein cattle. Journal of Dairy Science, 95, 876–889.
Nicolazzi E., Biffani S., Jansen G. (2013): Short communica-tion: Imputing genotypes using PedImpute fast algorithm combining pedigree and population information. Journal of Dairy Science, 96, 2649–2653.
Sargolzaei M., Chesnais J., Schenkel F. (2014): A new ap-proach for efficient genotype imputation using informa-tion from relatives. BMC Genomics, 15, 12.
Schaeffer L. (2006): Strategy for applying genome-wide selection in dairy cattle. Journal of Animal Breeding and Genetics, 23, 218–223.
VanRaden P., O’Connell J., Wiggans G., Weigel K. (2011): Genomic evaluations with many more genotypes. Genet-ics Selection Evolution, 43, 10.
VanRaden P., Sun C., O’Connell J. (2015): Fast imputation using medium or low-coverage sequence data. BMC Genetics, 16, 12.
Ventura R., Lu D., Schenkel F.S., Wang Z., Li C., Miller S.P. (2014): Impact of reference population on accuracy of im-putation from 6K to 50K single nucleotide polymorphism chips in purebred and crossbreed beef cattle. Journal of Animal Science, 92, 1433–1444.
Wang Y., Lin G., Li C., Stothard P. (2016): Genotype imputa-tion methods and their effects on genomic predicimputa-tions in cattle. Springer Science Reviews, 4, 79–98.
Whalen A., Gorjanc G., Ros-Freixedes R., Hickey J. (2018): Assessment of the performance of hidden Markov models for imputation in animal breeding. Genetics Selection Evolution, 50, 4–10.
Zhang Z., Druet T. (2010): Marker imputation with low-density marker panels in Dutch Holstein cattle. Journal of Dairy Science, 93, 5487–5494.