Supported by the Innovation Project of Chinese Academy of Agricultural Sciences (CAAS-ASTIP-2014-LIHPS-01), the Key Technologies R&D Program of China during the 12th Five-Year Plan period (2012BAD13B05), and the Pro-gram of National Beef Cattle and Yak Industrial Technology System (CARS-37).
Identification of Optimal Reference Genes
for Examination of Gene Expression in Different
Tissues of Fetal Yaks
Mingna Li, Xiaoyun Wu, Xian Guo, Pengjia Bao, Xuezhi Ding,
Min Chu, Chunnian Liang, Ping Yan*
Key Laboratory for Yak Breeding Engineering of Gansu Province, Lanzhou Institute of Husbandry and Pharmaceutical Sciences, Chinese Academy of Agricultural Sciences, Lanzhou, P.R. China *Corresponding author: [email protected]
ABSTRACT
Li M., Wu X., Guo X., Bao P., Ding X., Chu M., Liang C., Yan P. (2017): Identification of optimal reference genes for examination of gene expression in different tissues of fetal yaks. Czech J. Anim. Sci., 62, 426– 434.
Reverse transcription quantitative real-time PCR (RT-qPCR) is widely used to study the relative abundance of mRNA transcripts because of its sensitivity and reliable quantification. However, the reliability of the inter-pretation of expression data is influenced by several complex factors, including RNA quality, transcription activity, and PCR efficiency, among others. To avoid experimental errors arising from potential variation, the selection of appropriate reference genes to normalize gene expression is essential. In this study, 10 commonly used reference genes – ACTB, B2M, HPRT1, GAPDH, 18SrRNA, 28SrRNA, PPIA, UBE2D2, SDHA, and TBP – were selected as candidate reference genes for six fetal tissues (heart, liver, spleen, lung, kidney, and forehead skin) of yak (Bos grunniens). The transcription stability of the candidate reference genes was evaluated using geNorm, NormFinder, and BestKeeper. The results showed that the combination of TBP and ACTB provided high-quality data for further study. In contrast, the commonly used reference genes 28SrRNA, SDHA, GAPDH, and B2M should not be used for endogenous controls because of their unstable expression in this study. The reference genes that could be used in future gene expression studies in yaks were indentified.
Keywords: transcription stability; RT-qPCR; TBP gene; ACTB gene
Reverse transcription quantitative real-time PCR (RT-qPCR) is a rapid and powerful method for the examination of the expression levels of transcripts. Relative quantification by RT-qPCR can determine if the transcript level changes in given samples relative to control samples (Chen et al. 2015). The accuracy of RT-qPCR largely depends on the stability of the reference gene for
normalization, which allows for the elimination of potential variants in RNA quality (Huggett et al. 2005), transcription activity (Vandesompele et al. 2002), PCR efficiency (Rekawiecki et al. 2012), and run-to-run variation during multistage ex-perimental processes (Zeng et al. 2016).
(GAPDH), β actin (ACTB), hypoxanthine gua-nine phosphoribosyl transferase 1 (HPRT1), β2 microglobulin (B2M), peptidylprolyl isomerase A (PPIA), TATA box binding protein (TBP), 18S ri-bosomal RNA (18SrRNA), 28S riri-bosomal RNA (28SrRNA), ubiquitin conjugating enzyme E2 D2 (UBE2D2), and succinate dehydrogenase complex subunit A (SDHA). It is generally accepted that the expression level of reference genes is con-stant across all cells, tissues, and environmental conditions (Svingen et al. 2015). However, there has been an increase in the number of studies that have evaluated the suitability of classic reference genes because of differences in age (Touchberry et al. 2006), tissue types (Sakai et al. 2014), thermal stress (Purohit et al. 2015), hormones (Das et al. 2013), and other treatment protocols (Young et al. 2006; Mihi et al. 2011). Studies in different tissue types have revealed that the most commonly used reference genes vary with the tissues studied (Zhang et al. 2013; Zeng et al. 2016). The application of unproven reference genes could lead to erroneous conclusions. For many important target genes, which are typically expressed at a low level, minor fluctuations in the reference gene could result in erroneous findings (Das et al. 2013). Taken together, it is extremely important to validate one or more suitable reference genes for normalizing the RT-qPCR data under every experimental condition across a range of samples or tissues.
Yaks (Bos grunniens) are important livestock animals, which are mainly distributed in the Qinghai-Tibetan Plateau and the adjacent alpine regions. Yaks provide milk, meat, fuel, service labour, and other daily necessities for local pas-toralists. A number of studies on growth (Hu et al. 2016), cloned embryo development (Pan et al. 2015), and hypoxia (Wu et al. 2015) in yak have used expression analysis with RT-qPCR. In these studies, and in fact in most studies using RT-qPCR methodologies, normalization of expression data was conducted using a single, traditional reference gene as an internal standard. To the best of our knowledge, the reliability of reference genes was only evaluated for yak mammary tissue (Jiang et al. 2016), and no research has been conducted on other yak tissues. Therefore it is essential to identify the optimal reference genes for normal-izing the RT-qPCR data.
In this study, we examined the stability of 10 com-monly used reference genes (ACTB, B2M, HPRT1,
GAPDH, 18SrRNA, 28SrRNA, PPIA, UBE2D2, SDHA, and TBP) in six different tissues of fetal yaks. This work will certainly facilitate future research on gene expression in yaks.
MATERIAL AND METHODS
Sample collection and preservation.Six fetuses of Datong yaks were collected at a slaughterhouse in the Qinghai Tibetan Plateau of Datong County. The fetuses were selected at 80–90 days (as esti-mated based on the crown-rump length of fetus) (Liu et al. 2010). Heart, liver, spleen, lung, kidney, and forehead skin were collected and frozen in liquid nitrogen until analysis. The entire study was conducted in strict accordance with the recom-mendations in the Guide for the Care and Use of Laboratory Animals of the National Institutes of Health, China.
RNA extraction and reverse transcription. To-tal RNA was extracted from the collected tissues using the TRIzol reagent (Invitrogen, USA). RNA purity and quantity were detected by NanoDrop 2000 (Thermo Scientific, USA). RNA integrity was verified by 1% agarose gel electrophoresis. The complementary DNA (cDNA) was synthesized from 500 ng total RNA using the PrimeScriptTM RT Reagent Kit with gDNA Eraser (TaKaRa, China) following the manufacturer’s protocol.
refer-ence genes was derived from a standard curve generated from serial dilution of pooled cDNA. The mean Ct value of each ten-fold dilution was plotted against the logarithm of the cDNA dilu-tion factor. RT-qPCR efficiency was determined for each gene using slope analysis with a linear regression model. An estimate of PCR efficiency was derived from the formula E = (10–1/slope – 1) × 100% (Kubista et al. 2006).
SYNJ1 encodes synaptojanin 1, which is a key neural protein highly expressed in nerve terminals with an essential role in the regulation of synap-tic vesicles. The SYNJ1 gene was used as a target gene to evaluate the performance of candidate reference genes. The primers for the SYNJ1 gene were designed using Primer Premier 5.0 software for RT-qPCR (Table 1), and the expression pro-file was assessed in the heart, liver, spleen, lung, kidney, and forehead skin tissue of six fetuses. Two different factors were used for selecting the reference: (1) a single reference gene with stable transcription levels, and (2) the geometric mean of the combination of stable reference genes. The reaction system and program was the same as that
of the qPCR experiment. The PCR reaction was performed using a CFX-96 TouchTM Real-Time PCR Detection System (Bio-Rad).
Data analysis.The stability of the 10 reference genes was evaluated using the softwares geNorm (Vandesompele et al. 2002), NormFinder (An-dersen et al. 2004), and BestKeeper (Pfaffl et al. 2004). The geNorm analysis calculated the gene stability measure (M value), which was arbitrarily required to be lower than 1.5 (with lower values indicating increased gene stability across samples), and pairwise variation (V value) for a single gene compared to all other reference gene candidates to determine the benefit of adding an extra ref-erence gene to the normalization process. The arbitrary cut-off V value of 0.15 indicated accept-able stability of the reference gene combination. The NormFinder program was used to introduce raw data into a MS Excel spreadsheet following the manufacturer’s instructions. The NormFinder algorithm used the least variation (intragroup and intergroup) to estimate expression stability between subgroups of the sample set, and lower values indicated increased stability in gene
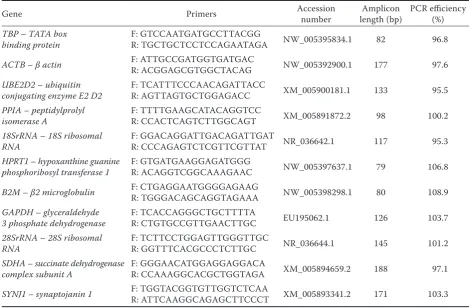
tran-Table 1. The primer list of genes used in the study
Gene Primers Accession number length (bp)Amplicon PCR efficiency (%)
TBP – TATA box
binding protein F: GTCCAATGATGCCTTACGG R: TGCTGCTCCTCCAGAATAGA NW_005395834.1 82 96.8
ACTB – βactin F: ATTGCCGATGGTGATGAC R: ACGGAGCGTGGCTACAG NW_005392900.1 177 97.6
UBE2D2 – ubiquitin
conjugating enzyme E2 D2 F: TCATTTCCCAACAGATTACC R: AGTTAGTGCTGGAGACC XM_005900181.1 133 95.5 PPIA – peptidylprolyl
isomerase A F: TTTTGAAGCATACAGGTCC R: CCACTCAGTCTTGGCAGT XM_005891872.2 98 100.2 18SrRNA – 18S ribosomal
RNA F: GGACAGGATTGACAGATTGAT R: CCCAGAGTCTCGTTCGTTAT NR_036642.1 117 95.3 HPRT1 – hypoxanthine guanine
phosphoribosyl transferase 1 F: GTGATGAAGGAGATGGG R: ACAGGTCGGCAAAGAAC NW_005397637.1 79 106.8
B2M – β2microglobulin F: CTGAGGAATGGGGAGAAG R: TGGGACAGCAGGTAGAAA NW_005398298.1 80 108.9
GAPDH – glyceraldehyde
3 phosphate dehydrogenase F: TCACCAGGGCTGCTTTTA R: CTGTGCCGTTGAACTTGC EU195062.1 126 103.7 28SrRNA – 28S ribosomal
RNA F: TCTTCCTGGAGTTGGGTTGC R: GGTTTCACGCCCTCTTGC NR_036644.1 145 101.2 SDHA – succinate dehydrogenase
complex subunit A F: GGGAACATGGAGGAGGACA R: CCAAAGGCACGCTGGTAGA XM_005894659.2 188 97.1
SYNJ1 – synaptojanin 1 F: TGGTACGGTGTTGGTCTCAA R: ATTCAAGGCAGAGCTTCCCT XM_005893341.2 171 103.3
[image:3.595.62.534.435.743.2]scription. The BestKeeper software determined optimal reference genes by employing a pair-wise correlation analysis of all pairs of candidate genes and calculating the geometric mean of the best-suited genes. The raw Ct values were introduced directly into the MS Excel spreadsheet using a macro. The results were immediately calculated by the algorithm. The 2–ΔΔCt method (Schmittgen and Livak 2008) was used to analyze the relative expression of mRNA of each gene by quantitative fluorescence.
RESULTS
Transcript levels of candidate reference genes. Ten reference genes were amplified from differ-ent tissues of six yaks. Melting curves for each primer showed a single peak, confirming a
sin-gle product from the RT-qPCR. Standard curves were generated using a ten-fold serial dilution of a cDNA pool, and these employed a linear cor-relation coefficient (R2) of > 0.95. Based on the slopes of the standard curves, the estimated PCR amplification efficiencies ranged from 95.3 to 108.9% (Table 1). The mean Ct values are shown in Table 2. There was low inter-assay variation for the heart, liver, spleen, and forehead skin tissue, with most standard deviation (SD) values < 0.6 and the highest 0.85. For lung and kidney tissue, there was larger variation and all SD values were > 0.41, with those of UBE2D2, PPIA, and SDHA for lung tissue exceeding 1.0.
[image:4.595.69.535.113.273.2]Transcript levels were used to establish three arbitrary categories: highly expressed 18SrRNA (mean Ct values = 5.17), moderately transcribed (mean Ct values = 17.53–23.07), including the ACTB, B2M, 28SrRNA, HPRT1, SDHA, UBE2D2, Table 2. Mean RT–qPCR threshold values (means ± standard deviation) of 10 reference genes in yak tissues
Gene Heart Liver Spleen Lung Kidney Forehead skin
TBP 25.27 ± 0.34 24.36 ± 0.33 24.63 ± 0.56 24.49 ± 0.78 24.12 ± 0.51 24.77 ± 0.36 ACTB 18.19 ± 0.32 17.15 ± 0.26 17.53 ± 0.85 17.46 ± 0.90 17.28 ± 0.60 17.74 ± 0.32 UBE2D2 22.14 ± 0.27 22.30 ± 0.32 22.24 ± 0.58 22.11 ± 1.01 21.48 ± 0.76 22.29 ± 0.40 PPIA 19.79 ± 0.44 18.82 ± 0.35 18.93 ± 0.28 19.44 ± 1.10 18.71 ± 0.58 20.22 ± 0.33 18SrRNA 5.23 ± 0.49 4.72 ± 0.42 5.28 ± 0.08 5.14 ± 0.41 5.26 ± 0.52 5.58 ± 0.48 HPRT1 22.60 ± 0.47 22.97 ± 0.39 23.47 ± 0.46 21.90 ± 0.68 23.47 ± 0.66 24.58 ± 0.45 B2M 21.80 ± 0.32 20.99 ± 0.29 19.80 ± 0.62 21.56 ± 0.83 21.54 ± 0.71 20.97 ± 0.77 GAPDH 18.97 ± 0.11 20.77 ± 0.30 20.27 ± 0.35 20.39 ± 0.68 20.28 ± 0.72 22.64 ± 0.12 28SrRNA 26.44 ± 0.81 26.01 ± 0.70 26.65 ± 0.43 26.62 ± 0.66 25.66 ± 0.78 28.85 ± 0.51 SDHA 21.37 ± 0.51 21.38 ± 0.33 23.874 ± 0.50 24.34 ± 1.14 21.62 ± 0.89 24.44 ± 0.39
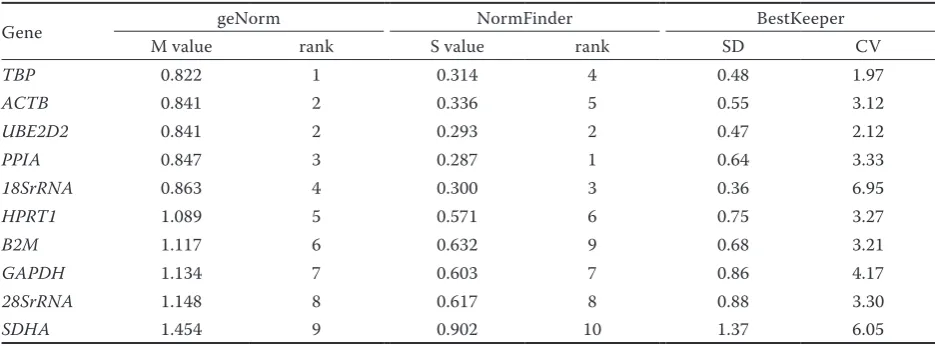
Table 3. Results of stability among 10 candidate genes computed by 3 algorithms on all yak tissues
Gene geNorm NormFinder BestKeeper
M value rank S value rank SD CV
TBP 0.822 1 0.314 4 0.48 1.97
ACTB 0.841 2 0.336 5 0.55 3.12
UBE2D2 0.841 2 0.293 2 0.47 2.12
PPIA 0.847 3 0.287 1 0.64 3.33
18SrRNA 0.863 4 0.300 3 0.36 6.95
HPRT1 1.089 5 0.571 6 0.75 3.27
B2M 1.117 6 0.632 9 0.68 3.21
GAPDH 1.134 7 0.603 7 0.86 4.17
28SrRNA 1.148 8 0.617 8 0.88 3.30
SDHA 1.454 9 0.902 10 1.37 6.05
[image:4.595.63.531.570.743.2]and PPIA gene, and low transcript levels (mean Ct values > 24), including GAPDH and TBP.
Stability of reference gene expression. The stability ranking of the 10 reference genes was evaluated based on the entire dataset (Table 3). The TBP gene had the lowest M value. The geNorm algorithm also eliminated the least stable expressed
gene and recalculated new M values for the remain-ing genes. Figure 1 illustrates the average expres-sion stability values (M); TBP and ACTB were the most stable genes. Next, the geNorm algorithms calculated the normalization factor (NF) and used V values to determine the minimal number of genes mandatory for normalization. Additional
0 6 0.7 0.8 0.9 1 1.1
e
ex
pr
es
sio
n s
ta
bi
lit
y
M
0.3 0.4 0.5 0.6
SDHA 28SrRNA GAPDH HPRT1 B2M 18SrRNA PPIA UBE2D2 ACTB
TBP
Ave
ra
ge
[image:5.595.121.480.94.316.2]<::::: Least stable genes Most stable genes ::::>
Figure 1. Stability of reference gene expression (M) calculated using the geNorm software. Low M values indicate the best reference genes and high M values the worst reference genes
0.148
0.120 0.117 0.124
0.133
0.127
0.109
0.132
0.100 0.120 0.140 0.160
0.000 0.020 0.040 0.060 0.080
V2/3 V3/4 V4/5 V5/6 V6/7 V7/8 V8/9 V9/10
Pairwise variations
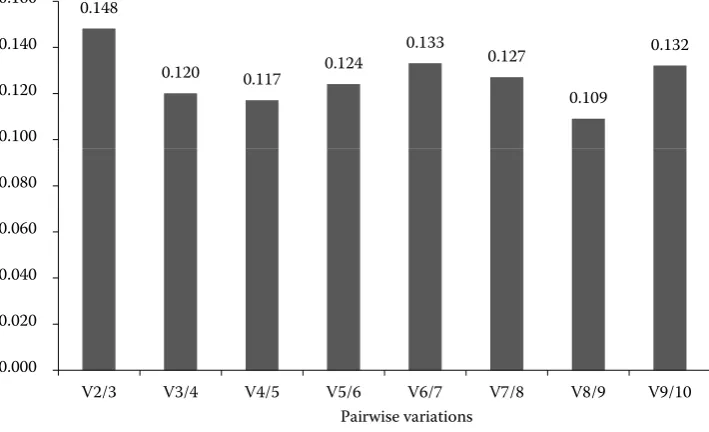
[image:5.595.123.478.483.699.2]genes were included when V exceeded the cutoff value 0.15. Figure 2 shows the first V value < 0.15 (0.148) that emerged at V2/3, suggesting that the two reference genes (ACTB and TBP) were suf-ficient for reliable normalization.
NormFinder calculated the stability value (S val-ue) based on a variance estimation approach. An upper S value of 0.5 indicated genes were relatively stable, and greater stability of gene expression was indicated by lower S values. The overall ranking of the genes from the most to the least stable was PPIA, UBE2D2, 18SrRNA, TBP, ACTB, HPRT1, GAPDH, 28SrRNA, B2M, and SDHA (Table 3).
BestKeeper measured the stability of reference genes according to the coefficient of variance (CV) and the standard deviation (SD) of the Ct values. The most stable reference gene exhibited the low-est CV and SD (CV ± SD) (Radonic et al. 2004). The results showed that the TBP, UBE2D2, ACTB, and PPIA genes had the most stable expression across all tissues, followed by HPRT1, GAPDH, and 28SrRNA. The expression of most reference genes exhibited Ct variation less than 1 (Pfaffl et al. 2004) (0.36 < SD < 0.88), whereas SDHA exhibited high Ct variation (SD = 1.37 Ct) and was deemed unstable. The 18SrRNA gene had the lowest SD (0.36) and the highest CV (6.95); therefore, we could not define its stability with this analysis. B2M displayed a moderate CV ± SD value (3.21 ± 0.68), but P = 0.051 indicating it should be excluded (Table 3).
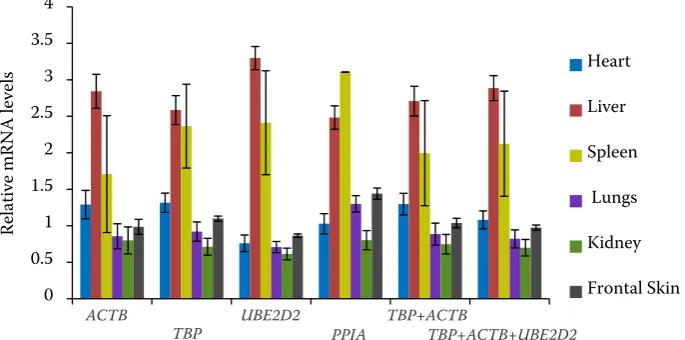
Validation of the recommended reference genes. To examine the validity of the top ranked refer-ence genes (TBP, ACTB, UBE2D2, and PPIA), the expression profile of the target gene SYNJ1 was investigated in different tissues (Figure 3). Similar expression profiles of the target gene were ob-served using either two (TBP and ACTB) or three (TBP, ACTB, and UBE2D2) stable reference genes. The expression of the SYNJ1 gene in spleen was numerically higher than that in liver with single PPIA gene normalization. This indicated that the PPIA gene was not suitable as a reference gene in this study.
DISCUSSION
[image:6.595.129.472.100.270.2]Reference genes are defined as genes that are stably expressed across all tissues/cell types; how-ever, no single gene is constitutively expressed in all tissues/cell types and under all experimental conditions (Andersen et al. 2004; Yang et al. 2015). Therefore, selection of suitable reference genes is a crucial precondition for a successful gene expres-sion study based on RT-qPCR (Liu et al. 2014). In addition, numerous studies have focused on the expression stability of reference genes in cattle (Lisowski et al. 2008), goats (Zhang et al. 2013), pigs (Nygard et al. 2007), humans (Touchberry et al. 2006), and mice (Zeng et al. 2016). Little is known about the reference genes in yak tissues. Figure 3. Validation of the recommended reference genes. Expression profiles of SYNJ1 gene were investigated using different reference genes. The expression of SYNJ1 was normalized using the different groups: ACTB, TBP, UBE2D2, PPIA, the combination of ACTB and TBP, the combination of ACTB, TBP, and UBE2D2. Bars represent the means and standard error of six biological replications
0
0.5 1 1.5 2 2.5 3 3.5 4
Heart
Liver
Spleen
Lungs
Kidney
Frontal Skin
Relat
ive mRNA
levels
ACTB
Herein, we selected 10 traditional reference genes to identify the superior reference gene for six different tissues from yak fetuses. Although the geNorm, NormFinder, and BestKeeper softwares are widely used for assessing potential reference genes, it has been demonstrated that discrepancy typically exists among results obtained from these programs (Purohit et al. 2015). The top four ranked reference genes (TBP, ACTB, UBE2D2, and PPIA) obtained through geNorm were consistent with those of BestKeeper, although the ranking order of the second and third gene was different. Based on NormFinder, PPIA was identified as the most stable reference gene, followed by UBE2D2 and 18SrRNA, whereas in BestKeeper, 18SrRNA was deemed unsuitable as a reference gene. The dif-ferent software programs are based on difdif-ferent algorithms (Liu et al. 2014). Thus, the use of more than one algorithm for ranking is necessary.
Based on the aforementioned discrepancies, there was no scientific evidence to allow for determina-tion of a single reference gene in this study. The V values calculated by geNorm software were used to determine the optional number of reference genes, and we must balance the trade-off between accuracy and practicality by using this value (Van-desompele et al. 2002). The V value of V2/3 was 0.148 (< 0.15), which indicated that two reference genes are needed for reliable normalization, and the addition of one more reference gene would not significantly improve reliability. Furthermore, the target gene validated this result in that the expres-sion profile with the geometric mean of two refer-ence genes was similar to that of three genes. This showed that the combination of TBP and ACTB would provide high quality data. In contrast, the results suggested that 28SrRNA, SDHA, GAPDH, and B2M should be used for endogenous controls because of their unstable expression.
It has been demonstrated that utilization of different functional reference genes reduces co-regulation effects, which may affect the accuracy of pairwise comparison results (Andersen et al. 2004). The candidate reference genes ACTB and TBP were responsible for cell locomotion and trans-cription, respectively (Mihi et al. 2011). ACTB is an impor-tant actin isomer and cytoskeleton actin (Zeng et al. 2016), the basal level transcription of which is essential for all cellular physiological conditions. It has been widely used as an internal control for experimental testing (Mihi et al. 2011). TBP is an
indispensable basal transcription factor, and the RNA polymerase II binds to the TBP-DNA complex to initiate transcription (Ponomarenko et al. 2016). A knockout (Martianov et al. 2002) or knockdown (Muller et al. 2001) of the TBP gene is lethal, and TBP expression might not be subjected to significant regulation. TBP was determined to be the optimal reference gene in low-abundance transcripts of goat (Zhang et al. 2013) and pig (Nygard et al. 2007) tissue expression studies. Appropriate reference genes were suggested to have the same transcript levels as the target gene to enhance the uniformity of the analysis (Spinsanti et al. 2006). In this study, TBP gene was classified in the low transcript level (mean Ct values > 24), and the transcript level of the ACTB gene (mean Ct values = 17.15–18.19) was higher than that of the TBP gene. Based upon these concepts, the ACTB would be the logical reference gene for studying high transcript-level target genes, and the combination of ACTB and TBP genes would be more appropriate for modest transcript-level studies. Thus, we recommend the geometric averaging of the ACTB and TBP genes to normalize the relative gene expression levels for further study.
CONCLUSION
This study firstly validated the suitable reference genes for data normalization for gene expression in yak splanchnic and skin tissues. The combina-tion of the ACTB and TBP genes was optimal for determination of gene expression in this study. In conclusion, the result may provide methodological support for further candidate gene identification and gene-expression pattern studies. It also clearly advocates for a reference gene assessment prior to performing a target gene expression-level analysis.
REFERENCES
Andersen C.L., Jensen J.L., Orntoft T.F. (2004): Normaliza-tion of real-time quantitative reverse transcripNormaliza-tion-PCR data: a model-based variance estimation approach to identify genes suited for normalization, applied to blad-der and colon cancer data sets. Cancer Research, 64, 5245–5250.
genes for normalization of quantitative RT-PCR in pe-ripheral blood samples of bottlenose dolphins (Tursiops truncatus). Scientific Reports, 5: 15425.
Das R.K., Banerjee S., Shapiro B.H. (2013): Extensive sex- and/or hormone-dependent expression of rat housekeep-ing genes. Endocrine Research, 38, 105–111.
Hu R., Wang Z., Peng Q., Zou H., Wang H., Yu X., Jing X., Wang Y., Cao B., Bao S., Zhang W., Zhao S., Ji H., Kong X., Niu Q. (2016): Effects of GHRP-2 and cysteamine administration on growth performance, somatotropic axis hormone and muscle protein deposition in yaks (Bos grunniens) with growth retardation. PLoS ONE, 11, e0149461.
Huggett J., Dheda K., Bustin S., Zumla A. (2005): Real-time RT-PCR normalisation; strategies and considerations. Genes and Immunity, 6, 279–284.
Jiang M., Lee J.N., Bionaz M., Deng X., Wang Y. (2016): Evaluation of suitable internal control genes for RT-qPCR in yak mammary tissue during the lactation cycle. PLoS ONE,11, e0147705.
Kubista M., Andrade J.M., Bengtsson M., Forootan A., Jonak J., Lind K., Sindelka R., Sjoback R., Sjofreen B., Strombom L., Stahlberg A., Zoric N. (2006): The real-time polymerase chain reaction. Molecular Aspects of Medicine, 27, 95–125.
Lisowski P., Pierzchala M., Goscik J., Pareek C.S., Zwier-zchowski L. (2008): Evaluation of reference genes for stud-ies of gene expression in the bovine liver, kidney, pituitary, and thyroid. Journal of Applied Genetics, 49, 367–372. Liu B., Cui Y., Yang B., Fan J., Zhao Z., Yu S. (2010):
Mor-phometric analysis of yak placentomes during gestation. Anatomical Record (Hoboken), 293, 1873–1879. Liu J., Wang Q., Sun M., Zhu L., Yang M., Zhao Y. (2014):
Selection of reference genes for quantitative real-time PCR normalization in Panax ginseng at different stages of growth and in different organs. PLoS ONE, 9, e112177. Martianov I., Viville S., Davidson I. (2002): RNA polymer-ase II transcription in murine cells lacking the TATA binding protein. Science, 298, 1036–1039.
Mihi B., Rinaldi M., Geldhof P. (2011): Effect of an Osterta-gia ostertagi infection on the transcriptional stability of housekeeping genes in the bovine abomasum. Veterinary Parasitology, 181, 354–359.
Muller F., Lakatos L., Dantonel J., Strahle U., Tora L. (2001): TBP is not universally required for zygotic RNA poly-merase II transcription in zebrafish. Current Biology, 11, 282–287.
Nygard A.B., Jorgensen C.B., Cirera S., Fredholm M. (2007): Selection of reference genes for gene expression studies in pig tissues using SYBR green qPCR. BMC Molecular Biology, 8: 67.
Pan Y., He H., Cui Y., Baloch A.R., Li Q., Fan J., He J., Yu S. (2015): Recombinant human bone morphogenetic pro-tein 6 enhances oocyte reprogramming potential and subsequent development of the cloned yak embryos. Cellular Reprogramming, 17, 483–493.
Pfaffl M.W., Tichopad A., Prgomet C., Neuvians T.P. (2004): Determination of stable housekeeping genes, differen-tially regulated target genes and sample integrity: Best-Keeper – Excel-based tool using pair-wise correlations. Biotechnology Letters, 26, 509–515.
Ponomarenko M.P., Arkova O., Rasskazov D., Ponomarenko P., Savinkova L., Kolchanov N. (2016): Candidate SNP markers of gender-biased autoimmune complications of monogenic diseases are predicted by a significant change in the affinity of TATA-binding protein for human gene promoters. Frontiers in Immunology,7: 130.
Purohit G.K., Mahanty A., Mohanty B.P., Mohanty S. (2015): Evaluation of housekeeping genes as references for quan-titative real-time PCR analysis of gene expression in the murrel Channa striatus under high-temperature stress. Fish Physiology and Biochemistry, 42, 125–135.
Radonic A., Thulke S., Mackay I.M., Landt O., Siegert W., Nitsche A. (2004): Guideline to reference gene selec-tion for quantitative real-time PCR. Biochemical and Biophysical Research Communications, 313, 856–862. Rekawiecki R., Rutkowska J., Kotwica J. (2012):
Identifica-tion of optimal housekeeping genes for examinaIdentifica-tion of gene expression in bovine corpus luteum. Reproductive Biology, 12, 362–367.
Sakai H., Sato K., Kai Y., Shoji T., Hasegawa S., Nishizaki M., Sagara A., Yamashita A., Narita M. (2014): Distribution of aquaporin genes and selection of individual reference genes for quantitative real-time RT-PCR analysis in mul-tiple tissues of the mouse. Canadian Journal of Physiology and Pharmacology, 92, 789–796.
Schmittgen T.D., Livak K.J. (2008): Analyzing real-time PCR data by the comparative CT method. Nature Protocols,
3, 1101–1108.
Spinsanti G., Panti C., Lazzeri E., Marsili L., Casini S., Frati F., Fossi C.M. (2006): Selection of reference genes for quantitative RT-PCR studies in striped dolphin (Stenella coeruleoalba) skin biopsies. BMC Molecular Biology, 7: 32.
Svingen T., Letting H., Hadrup N., Hass U., Vinggaard A.M. (2015): Selection of reference genes for quantitative RT-PCR (RT-qPCR) analysis of rat tissues under physi-ological and toxicphysi-ological conditions. PeerJ Computer Science, 3: e855.
hu-man skeletal muscle. Journal of Biomolecular Techniques, 17, 157–162.
Vandesompele J., De Preter K., Pattyn F., Poppe B., Van Roy N., De Paepe A., Speleman F. (2002): Accurate normaliza-tion of real-time quantitative RT-PCR data by geometric averaging of multiple internal control genes. Genome Biology,3: research0034.1.
Wu X., Ding X., Chu M., Guo X., Bao P., Liang C., Yan P. (2015): Novel SNP of EPAS1 gene associated with higher hemoglobin concentration revealed the hypoxia adaptation of yak (Bos grunniens). Journal of Integrative Agriculture, 14, 741–748.
Yang C., Pan H., Noland J.E., Zhang D., Zhang Z., Liu Y., Zhou X. (2015): Selection of reference genes for RT-qPCR analysis in a predatory biological control agent, Cole-omegilla maculata (Coleoptera: Coccinellidae). Scientific Reports, 5: 18201.
Young N.J., Thomas C.J., Collins M.E., Brownlie J. (2006): Real-time RT-PCR detection of Bovine Viral Diarrhoea virus in whole blood using an external RNA reference. Journal of Virological Methods, 138, 218–222.
Zeng J., Liu S., Zhao Y., Tan X., Aljohi H.A., Liu W., Hu S. (2016): Identification and analysis of house-keeping and tissue-specific genes based on RNA-seq data sets across 15 mouse tissues. Gene, 576, 560–570.
Zhang Y., Zhang X.D., Liu X., Li Y.S., Ding J.P., Zhang X.R., Zhang Y.H. (2013): Reference gene screening for analyz-ing gene expression across goat tissue. Asian-Australasian Journal of Animal Sciences,26, 1665–1671.