Predicting Solar Flares by Converting GOES X-ray
Data to Gramian Angular Fields (GAF) Images
Tarek Nagem, Rami Qahwaji, Stanley Ipson, Amro Alasta
Abstract: Predicting solar storms from real-time satellites data is extremely important for the protection of various aviation, power and communication infrastructures. There is therefore much current interest in creating systems which can make accurate solar flare predictions. This research investigates whether we can process Geostationary Operational Environmental Satellite (GOES) data, from pre-flare phases, to provide useful predictions for flares by convert GOES X-ray flux 1-minute data from 2011 to 2016 to Gramian Angular Fields (GAF) images. Then the GAF images are used as input to Deep Learning Neural Network platform. GOES data and deep learning technologies are not used heavily for flares prediction and in this paper, the potential and challenges of developing new deep-learning based space weather technology, are investigated.
Keywords: Deep learning; Convolutional neural networks; Solar flares; Flare prediction; GOES
I. INTRODUCTION
pace weather is defined by The US National Space
..Weather program as “Conditions on the Sun and in the solar wind, magnetosphere, ionosphere, and thermosphere that can influence the performance and reliability of space-borne and ground-based technological systems and can endanger human life or health” [1]. There are several
influences, originating from space weather phenomena, that detrimentally affect several important industries including avionics, satellites, mobile communication networks, and electricity distribution [2]. All these industries and infrastructures touch our daily lives and this means that space weather can potentially impact our lives dramatically. Flares are a noticeable solar activity, contributing to space The authors are with School of Electrical Engineering and Computer
Science - SEECS, University of Bradford, Bradford, United Kingdom [email protected], [email protected],
weather which can influence planet earth [3] and this work concerns a flare prediction system which generates two probabilities, Event, and No-event. The event corresponds to significant X or M class flares, while No-event corresponds to no flare or non-significant flare (A, B or and C-class flares).
Scientific and technological progress has led to big increases in the rate of generation of data that help scientists to monitor solar flares and their impacts on earth. Although scientists have not yet been able to use this new data, to fully understand all the detailed causes of solar flares they can still try to develop methods to predict solar storms, by applying advanced data processing technologies to the data [3].
Recently, the new field of deep learning neural network research has achieved remarkable successes, improving significantly on previous artificial intelligence methods in handling complex tasks [4].
Painstaking efforts are currently being made to create accurate solar flare prediction systems because the people responsible for infrastructures likely to be affected by a major solar flare know that the cost of building an accurate solar flare prediction system is likely to be much cheaper than the cost of repairing the damage caused by such an unpredicted flare.
In this paper, we discuss the characteristics of GOES X-ray data and a case-study for the practical development of a space weather prediction system based on deep learning technology.
II. DATASOURCE-GOESGEOSTATIONARY
OPERATIONALENVIRONMENTALSATELLITEGOES.
[image:2.612.54.290.127.263.2]A. GOES 15 1-minute data
Figure 1. The solar flare phases on C8.8 flare occurs on 5 May 2010 – From NASA [8]
In this work GOES 15 data from one of the American Geostationary Operational Environmental Satellites (GOES) are used. GOES was launched on 4 March 2010, with Weather missions which include capturing infrared images, monitoring the magnetosphere and cosmic background radiation, and taking continuous readings of solar x-ray flux [5]. This satellite provides various types of formatted data and in this work GOES X-ray flux 1-minute data are used. All GOES X-ray data are archived and are available to researchers. GOES X-ray Satellite observes the sun in two channels. The harder X-ray channel (wavelengths 0.05-0.4 nm) provides information about the coronal plasma state. The softer X-ray channel (wavelengths 0.1-0.8 nm) provides information about the intensity of solar flares and is used in this work to investigate its suitability for investigating the temporal evolution of flares [6]. GOES X-ray data can provide some insight on the three phases associated with the temporal evolution of solar flares [7]. (I) Pre-flare phase: This is the region shown in figure 1 which consists of fluctuations and then a slow increase of soft X-ray flux before the flare. (II)Impulsive phase: There is usually a rapid increase in the soft X-ray flux and the flare main energy is released during this phase. (III) Gradual phase: in this phase, the soft X-ray flux gradually decreases.
B. Extraction of relevant GOES X-ray flux 1-minute
data
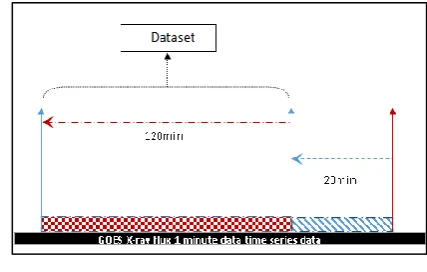
The development of space weather prediction system requires a methodology for extracting training and testing data sets. For this work, such data sets can be created from the archived GOES X-ray flux 1-minute data in four steps as follows and shown in Figure 2. The first step, find a flare in the archived data. Assume its time is t. then go back 140 minutes from t to the start tw of the time window. After that Select 120 minutes of data starting from tw. The last step, convert the selected data to a format suitable for deep learning algorithms, as described in the next subsection.
Figure 2. Create dataset from GOES X-ray flux 1
III. CONVERTING TIME SERIES GOES X-RAY DATA TO 64×64 GAF IMAGES
Deep Learning algorithms, despite being very efficient in processing image data, are not well equipped to process time-series signals, such as GOES X-ray flux data so we first encode the series data as images. To do this, we use the method introduced by Zhiguang, illustrated in Figure 3 [9]. A GOES time series X= {x1, x2, ..., xn} of GOES data, are
normalized to values Y between 0 and 1. Then, the normalized time series are converted to polar coordinates by encoding the values, yk as angles φk and the time stamp as
[image:2.612.326.540.297.433.2]size of the GAF matrix, the piecewise aggregation approximation is used [9].
Figure 3.Conversion of GOES X-ray data time series data to GAF images.
IV. APPLYING A DEEP CNN TO PREDICT SOLAR
FLARES
The Convolutional Neural Network (CNN) consists of convolutional layers, sub-sampling layers and a final fully connected layer as described below.
C. Convolutional layer
The input to this layer is a d×d×ch GAF image where d is the height and the width of the image (in this case d=64) and ch is the number of channels since the GAF images are RGB images, ch=3. The convolutional layer uses Kf filters
(also called Kernels) of size n×n×ch, where n is the dimension of the filter (n=8) to produce feature maps. The
Kf filters are convolved over the GAF image to create Kf
feature maps of size d−n+1[10].
D. Pooling layer
After the generation of the feature maps by the convolutional layer, these features are then used for classification. Each feature map is down-sampled by max-pooling of size p × p. In general, p ranges from 2 to 5 for small to big images respectively and in this work p=4.
V. LEARNING THE FEATURES WITHIN GAF IMAGES
The Auto-encoder is an unsupervised Backpropagation neural network which tries to learn a function hW,b(x) ≈ x, and is adjusted so that the input values correspond to the
target y (i)= (i)
[10]. In this work, we assume x is the input corresponding to the pixel intensity values for an 8×8 GAF image patch with 64 pixels, so x=64, and there are S2= 32 hidden units in layer l2. The network is required to learn a
compressed representation of the input, because there are just 32 hidden units. Therefore the auto-encoder should attempt to reconstruct the input from the 8 × 8 images (64 pixels) [10].
VI. IMPLEMENTATION OF THE SYSTEM
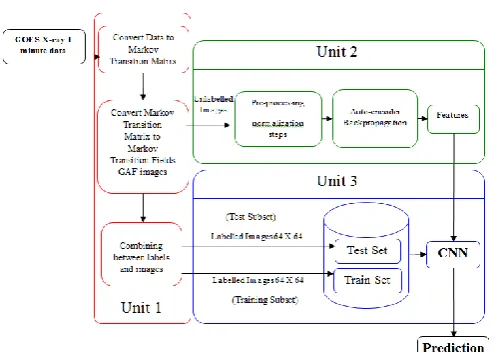
The three neural networks have been integrated into a system to predict solar flares. As Figure 4 shows the integrated system starting from the input GOES data to the output predicting the probability of a solar flare. The system is implemented using Python and Matlab. The first part of the system, which encodes the GOES data to GAF images, is implemented in Python and the rest of the system is implemented in Matlab. This system predictions, whether a flare is going to occur or not, based on embedded learning rules was trained using training sets selected over 5 years from 2011 to 2016, to ensure coverage of a full range of solar activity.
Figure 4. Diagram showing the internal procedures of the
[image:3.612.313.560.509.685.2]E. Verification Results
This system generates a prediction in binary form 0 means no flare and 1 means a flare in other words Event and No-event. In fact, flares occur rarely compared to no-flare. Nevertheless, accuracy prediction system is high as we will see in this section. Various measures are used to evaluate the predictions of the system. The following four criteria are used to investigate the results that are generated by the system.
Where:
If the GAF-image is associated with a flare, and the
system prediction is a flare then this successful prediction is a true positive (TP).
If the GAF-image is associated with a flare, but the
system prediction is no-flare then this failed prediction is a false positive (FP).
If the GAF-image is not associated with a flare and
the system prediction is no-flare then this successful prediction is a true negative (TN). If the GAF-image is not associated with a flare and
the system prediction is flare then this failed prediction is a false negative (FN).
To evaluate these results we used various prediction verification measures for 20 min time window in our previous work [21]. The measures that are used are the Heidke Skill Score (HSS), the percentage correct (PC), and the false alarms rate (FAR), the probability of detection (POD), and the True Skill Statistic (TSS). For more details about these verification measures see our paper matrices [11].
The percentage correct measure, PC, is used to calculate the rate of predictions that are correct [13] and is defined as:
The Heidke Skill Score (HSS) is a measure showing the improvement of the prediction over random prediction. HSS ranges from -1 (for no correct predictions) to +1 (for very accurate predictions) and a value of zero indicates that the predictions are randomly generated [13]. HSS is defined by:
(1)
HSS is a really useful measure for verifying systems that seek to predict rare events, as in the present case.
The False Alarm Ratio FAR is the fraction of flare predictions that are wrong. The range of FAR is from 0 (best outcome) to 1 (poorest outcome) [18]. FAR is defined as:
The Probability of Detection (POD) Pd, also known as the
Hit Rate (H), measures the probability of a solar flare being correctly predicted by the system [11]. The POD ranges from 0 poorest outcomes to 1 best outcome, it is given by:
Quadratic score QR is widely used as a verification measure to evaluate the accuracy of prediction. The prediction accuracy is calculated by finding the mean square error between the predictions and the observations as given by [11].
(5)
where ot are the binary observation outcomes where 1
means that flare occurred and 0 means that a flare did not happen, N is the sample size, and ft is the prediction
[image:4.612.322.550.651.699.2]probability. QR ranges from 0 (perfect prediction) to 1 (worst possible prediction) [22].
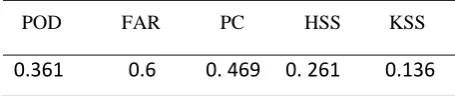
TABLE I. THE RESULTS OF VARIOUS PREDICTION VERIFICATION MEASURES FOR 20 MIN TIME WINDOW
POD FAR PC HSS KSS
VII. CONCLUSIONS
Real-time GOES x-ray data offers a unique opportunity to study the temporal evolution of solar flares. On the other hand, Deep-learning technologies are leading to significant advances in different areas of real-life applications, but their application to space weather is still limited. This work aims to investigate the opportunities, challenges and the practical development of a deep-learning platform for processing GOES data and the generation of useful predictions of significant solar flares. The system integrates three neural networks to deliver these predictions. The first neural network is used to convert GOES X-ray flux 1-minute data to Gramian Angular Fields (GAF) images. Then the second uses an unsupervised feature learning algorithm to learn the GAF image features. The third neural network uses both the learned features and the GAF images, which are processed using a Deep Convolutional Neural Network to generate the probability of a Flare or No-Flare.
REFERENCES
[1] Paul Song, Howard J. Singer, and George L. Siscoe, Space Weather, vol. 125. Washington, D. C.: American Geophysical Union, 2001.
[2] T. Colak and R. Qahwaji, “Automated Solar Activity Prediction: A hybrid computer platform using machine learning and solar imaging for automated prediction of solar flares,” Sp. Weather, vol. 7, no. 6, p. n/a-n/a, Jun. 2009.
[3] S. Odenwald, The 23rd Cycle: Learning to Live with a Stormy Star. Columbia University Press, 2012.
[4] S. C. Satapathy, A. Govardhan, K. S. Raju, and J. K. Mandal, Eds., Emerging ICT for Bridging the Future - Proceedings of the 49th Annual Convention of the Computer Society of India (CSI) Volume 1, vol. 337. Cham: Springer International Publishing, 2015.
[5] “STAR - NOAA / NESDIS / Center for Satellite Applications and Research - GOES-15 First Images Transmitted.” [Online].
[6] U. S. Observatory, “A Study on the Characteristics of Magnetic Field Structure and Evolution of Flaring Solar Active Regions submitted for the award of Ph . D . degree of MOHANLAL SUKHADIA UNIVERSITY in the Faculty of Science by Vema Reddy Panditi Under the Supervision of Dr,” 2013.
[7] S. I. Syrovatskii and S. I., Comments on astrophysics., vol. 4. Gordon and Breach], 1972.
[8] NASA, “GMS: SDO EVE Late Phase Flares.” [Online]. Available:
[9] Z. Wang and T. Oates, “Encoding Time Series as Images for Visual Inspection and Classification Using Tiled Convolutional Neural Networks,” pp. 40–46, 2015.
[10] A. Ng, “CS294A Lecture notes Sparse autoencoder.”
[11] Tarek. Nagem, R. Qahwaji and S. Ipson. “Deep learning teachology for the prediction of solar flares from GOES data.” IEEE Conferences. London: IEEE ,
2017. 697 - 700.