Effect of cell surfaces on the stability of chiral smectic-
C
phases
U. Manna, Jang-Kun Song, G. Power, and J. K. Vij
*
Department of Electronic and Electrical Engineering, Trinity College, University of Dublin, Dublin, Ireland 共Received 13 December 2007; revised manuscript received 17 May 2008; published 27 August 2008兲
The effect of surfaces on the stability of smectic-C* 共SmC*兲 variant phases is investigated. The results obtained using dielectric spectroscopy by varying the cell thickness show that the temperature ranges of SmC␣*, SmC
A
*共1/2兲, and SmC A
*共1/3兲phases decrease with decreasing cell thickness, and the SmC A
*共1/3兲phase is more
stable than the SmCA*共1/2兲 phase. The relative stability of any phase is found to be due to its large polar anchoring strength and low free energy compared to other phases in a cell. Experimental results are found to agree with the theory.
DOI:10.1103/PhysRevE.78.021711 PACS number共s兲: 61.30.Hn, 64.70.M⫺, 77.22.Gm
I. INTRODUCTION
Chandaniet al.关1,2兴discovered antiferroelectric共AF兲 liq-uid crystals and in particular they discovered the three smectic-C* 共SmC*兲 phases SmCA*, SmC␣*, and SmC␥* in 1989. The other phase involving four-layer periodicity with almost zero spontaneous polarization, called AF, was discov-ered by Okabeet al.关3兴. Goreckaet al.关4兴and Takezoeet al. 关5兴proposed models for the SmC␥*and AF phases and gave the periodicity of the layers as 3 and 4, respectively. Re-cently, Chandaniet al.关6兴also discovered a subphase involv-ing a five-layer periodicity sandwiched between the two- and three-layer phases. The latter exists over a narrow range of temperatures and was confirmed independently by Panov et al.关7兴using a different optical technique. Several theoretical approaches have been considered to explain a variety of these phases based on the Landau model 关8,9兴, namely, the Ising 关10兴, clock 关11兴, distorted clock 关12,13兴, and discrete flexoelectric models 关14,15兴. The SmC* phase is a tilted
phase with the director tilted from the layer normal; each layer has a spontaneous polarization directed normal to the plane formed by the director and the layer normal. Due to the chirality a helical structure is formed. Application of an elec-tric field aligns the spontaneous polarization of each layer of the SmC* phase along the field, which creates a large in-duced macroscopic polarization. The SmC␣*phase has a he-lical structure as well, but the pitch is extremely short. The structure of the SmC␣* phase is obtained by minimizing the free energy of a system containing competing interactions between the nearest and the next-nearest smectic layers and by assuming the temperature dependence of the tilt angle
关15,16兴. We use the nomenclature of the liquid crystalline phases introduced first by Isozaki et al. 关17兴for the reason that the arrangement of the fraction of ferroelectric order in a unit cell is explicitly specified. Isozakiet al.defined the vari-ous phases asqT=关F兴/共关A兴+关F兴兲, where关F兴and关A兴are the
amounts of ferroelectric and antiferroelectric orderings in a unit cell. Since all of these phases are closely related to SmCA*, they designated them as SmCA*共qT兲. Thus SmCA*共0兲,
SmCA*共1/3兲, and SmCA*共1/2兲are the designations for a two-layer, three-layer共also called SmC␥*and SmCFI*1by different
groups兲, and four-layer共called AF or SmCFI
2
* 兲phase,
respec-tively. The advantage of using the Isozakiet al.关17兴notation is that any newly discovered phase can be accommodated within the scheme and the number of layers in a unit cell readily calculated, whereas the other numbered designations may be misleading. Furthermore, SmCFI*2is an antiferroelec-tric phase rather than a ferrielecantiferroelec-tric phase as may be implied by this nomenclature.
Liquid crystal devices exploit the phenomenon of align-ment by surfaces关18兴. It has been known for some time that the phase transitions of chiral smectic liquid crystals are con-trolled by their confinement 关19–27兴and by their alignment
关28兴. The results of dielectric spectroscopy and optical texture experiments have been used to compare the antifer-roelectric liquid crystal 共AFLC兲 phase behaviors of several compounds confined in cells of different thicknesses
关19–21兴. Electro-optical and dielectric spectroscopic investigations performed at several different cell gaps on three homologs of the series nOF1M7, where n denotes the length of the unbranched terminal chain, showed that the bulk thermodynamic phase existed only in samples of cell thicknesses greater than 25m. It was found that the SmCA*共1/3兲-SmCA*transition temperature was pushed down-ward as the measurement cell gap was reduced for thin cells. For a thin cell, the SmCA*phase completely disappeared and the coexistence of ferroelectric and antiferroelectric phases was observed 关22兴. It was also found that confinement of AFLCs induces a phase transformation from the SmCA*共1/2兲 and SmCA*共1/3兲phases to the frustrated ferroelectric SmC*
phase, which showed thresholdless bistable switching 关23兴. The transition temperature of the SmA-SmC* transition is found to be lowered and the ferrielectric phases are sup-pressed in pores of nanometer dimensions of liquid crystal-line phases in porous media关24兴. The second-order transition from SmAto SmC*is considerably broadened and an addi-tional relaxation process is detected for liquid crystals con-fined in aerogel pores 关25兴. Thinner cells exhibit more field-induced ferrielectric steps in optical transmission than do thicker cells关26兴.
other areas of surface science. We theoretically analyze the effect of surfaces on the stability of these phases by consid-ering the contribution of the surface anchoring energy and the distortion energy of the bulk liquid crystals contributed by the surfaces to clarify how the transition temperatures depend on the cell thickness and why the temperature range of some of the phases decreases rapidly with decreasing cell thickness. Finally, some of the phases are not observed for low cell thicknesses. We present experimental data on the variation of the transition temperatures and temperature ranges of the SmC* variant phases of a prototype AFLC
compound as a function of the cell thickness in the range 3 – 80m. The experimental results also give the extent of the order of the suppression and the nature of the stability of the smectic-C*variant phases relative to each other. The ex-perimental results are found to agree with the theory.
II. THEORY
Orihara and Ishibashi关8兴in 1990 were the first to suggest a phenomenological model based on the Landau theory of phase transitions applied to the chiral smectic-C* variant phases soon after their discovery. Since then, several phe-nomenological models have emerged 关9–15兴 to explain the various experimental observations. Landau theory, which is a global method to describe phase transitions, is based on a few basic assumptions. One of these assumptions is that the free energy is analytical and at least one of the analytical terms contains the temperature T. The temperature-dependent term is selected to describe the phase transition phenomenologically. Therefore, despite a variety of phenom-enological models based on the Landau description having been advanced to date, the basic terms in the models are quite similar. For example, the discrete flexoelectric model
关14,15兴given recently for explaining the emergence of pos-sible phases or subphases uses a free energy equation as below:
VFb=
兺
i=1N
冉
F˜0共兲−˜a⌬T TC
共cosi−1,i+ cosi,i+1兲
−B˜共cos2
i−1,i+ cos2i,i+1兲+f共Pi−1,Pi,Pi+1兲
冊
,共1兲 whereFbis the free energy per unit volume,Vis the volume
of the cell, and i= 1 , . . . ,N is the running index of smectic layers for a cell having N layers. F˜0共兲 is the tilt-angle共兲 dependent free energy part that governs the nontilted to tilted phase transition, that is, the SmA*-SmC*phase transition. is defined as the angle that the cdirector of a layer makes with the x direction on the cell window as shown in Fig. 1共b兲. The second and third terms are designed to express the synclinic to anticlinic phase transition, that is, the ferrro-to antiferroelectric layer ordering transition.⌬T=T−TC, where TC is the transition temperature between the synclinic and
anticlinic smectic-C*phases in the absence of any interme-diate phases. The second term is temperature dependent, while the other terms are temperature independent. The last
term in Eq.共1兲is a function of the polarizationP, which was introduced by Osipovet al.关15兴, to explain the emergence of the various phases and subphases. The last term is dependent on the model and can be controversial共this is not explained in detail here because it is beyond the scope of our paper兲. The first three terms, however, have a clear physical meaning and these appear in slightly different forms in almost all of the phenomenological models based on the Landau free en-ergy expansion. The in-layer molecular directors for the syn-clinic or antisyn-clinic orderings almost lie in a single plane for positive B˜. As the temperature increases, the ferroelectric configuration is favored by positive˜a. Equation 共1兲 can be rewritten as
Fb=T
1
V
兺
i=1N
冉
−˜a 1 TC共cosi−1,i+ cosi,i+1兲
冊
+ 1
V
兺
i=1N 关F˜
0共兲+˜a共cosi−1,i+ cosi,i+1兲
[image:2.609.320.533.69.190.2]−B˜共cos2i−1,i+ cos2i,i+1兲+f共Pi−1,Pi,Pi+1兲兴. 共2兲 Now Eq. 共2兲can be rewritten as
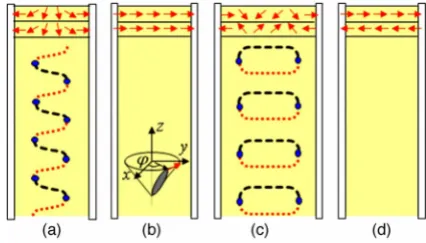
FIG. 1. 共Color online兲Schematic for the director distribution in SmC*variant phases based on the works of Brunet关30兴and Gloga-rova关31兴. Director distribution of the SmC*phase for a thick共a兲 and for a thin共b兲cell, where the number of layers with= 0 and
=is not the same in the unwound state, resulting in a nonzero spontaneous polarization. The red arrows in the upper part represent the spontaneous polarization along the ydirection for the first two layers 共twist structure兲, black round dotted and red square dotted lines in the center denote the directors having¯=/2 and −/2, respectively, and blue circles denote defects. The director distribu-tion in the SmC
A
*共1/3兲phase follows the same distribution as in共a兲
and共b兲for thick and thin cells, respectively, except the director of the third layer is opposite to that of the first two layers. Director distribution in SmCA*phase for a thick共c兲and thin共d兲cell, where the number of layers of= 0 is the same as of=in the unwound state, resulting in zero spontaneous polarization. The director distri-bution of the SmCA*共1/2兲phase follows the same distribution as in
Fb=T
冓
− a ˜ TC共cosi−1,i+ cosi,i+1兲
冔
+FO⬅AT+FO, 共3兲 where A⬅−共a˜/TC兲具cosi−1,i+ cosi,i+1典⬅−AO具cosi−1,i+ cosi,i+1典. 具 典 denotes the average temperature dependent free energy term per unit volume, and replaces the summa-tion in Eq. 共2兲. Here, FO denotes the sum of all the other
terms in Eq.共2兲per unit volume and is independent of tem-perature and dependent on the structure, polarization, etc. With a cell having surface area S and thicknessd, the total free energy can be written as
FT=SdFb+ 2SFs, 共4兲
FT/Sd⬅Ft=Fb+ 2Fs/d. 共5兲
Here, Fs is the free energy contributed by the unit surface.
This includes the anchoring energy and the distortion energy of the bulk liquid crystals contributed by the surfaces. Hence, we getFt=AT+FO+ 2Fs/d. Here, since we are considering a
small shift in the phase transition temperatures due to the surface effect,Fsis considered to be independent of
tempera-ture for a narrow range of temperatempera-tures close to the phase transition temperature. We consider the phase transition be-tween the phases 1 and 2 havingqT=q1共lower temperature兲 and qT=q2 共higher temperature兲 phases. At the bulk transi-tion temperatureTCin the absence of the surfaces, the bulk
free energies of two phases are the same. Hence,
Aq1TC+FO,q1=Aq2TC+FO,q2. 共6兲
The transition temperatureT, by including the surface effect, can be found as
Aq1T+FO,q1+ 2Fs,q1/d=Aq2T+FO,q2+ 2Fs,q2/d. 共7兲
Hence, the transition temperature’s dependence on the sur-faces is given by
T=TC−
2共Fs,q1−Fs,q2兲
d共Aq1−Aq2兲 =TC−
2⌬Fs,共q1,q2兲
⌬Aq1,q2 1
d. 共8兲
We find from Eq.共8兲that a shift in the transition tempera-ture due to the surface interactions is inversely proportional to the cell thickness, and it depends on the ratio of the dif-ferences in the coefficient of the temperature-dependent term for the free energy共⌬A兲 and the surface energy共⌬Fs兲. The
effect of surfaces can therefore be calculated using this equa-tion.⌬Acan be calculated using Eq.共3兲and, if phase 1 is the lower-temperature phase, then ⌬Ais always positive. Hence the sign of the coefficient of the last term in Eq.共8兲is deter-mined by⌬Fs. If⌬Fsis positive, i.e., the surface energy of
phase 1 is higher than that of phase 2, the transition tempera-ture decreases with decreasing cell thickness. On the con-trary, if⌬Fsis negative, that is, the surface energy of phase 1
is lower than that of phase 2, the transition temperature in-creases on decreasing the cell thickness.
The free energy parameter A can be found from Eq. 共3兲 for the transitions among SmC*, SmCA*共1/2兲, SmCA*共1/3兲, and SmCA* phases. However, for the transitions among SmA*, SmC␣*, and SmC*, the first term in Eq.共1兲contributes
significantly to the phase transition. That is, close to the SmA*-SmC*transition, the tilt anglechanges sharply with temperature, and the free energy is mostly governed by the tilt-angle-dependent term. Note that the Landau expansion for the second-order SmA*to SmC*transition is
FAC=f0+a0共T−TAC兲2+a44+ ¯. 共9兲
Thus, for the transitions among SmA*, SmC
␣
*, and SmC*, A⬅a02. Here, a0 is the Landau coefficient of the temperature-dependent term. a0 is much greater than A0 =a˜/TC, since the energy difference between SmA* and
SmC*is 103times that between SmC*and SmC
A
*关15兴;˜a is
the coefficient of the second term in Eq. 共1兲. Therefore, in Eq. 共8兲, ⌬A for the transitions among SmA*, SmC
␣
*, and
SmC* is much higher than for those among SmC*,
SmCA*共1/2兲, SmCA*共1/3兲, and SmCA*. This means that the transition temperatures between SmA*, SmC␣*, and SmC*
phases are found to be largely insensitive to the cell thick-ness.
In order to calculate ⌬Fs for the transitions among the
variant SmC*phases, we consider the surface energy Fs in
detail. We assume that the phase transition occurs in the bulk liquid crystal as well as within the interface of the cell with the liquid crystal. The surface energy induces a distortion in the bulk LC.Fscan be separated into three different types of
energy: the surface anchoring energy Ws, the distortion
en-ergy of the helix,d¯/dz, and the in-layer distortion along the thickness direction, d¯/dy. These energies are actually coupled to each other, and hence the total energyFswritten
below can be calculated from the different components with justifiable approximations:
Fs=Ws+
1
S
冕
冋
K1冉
d¯ dz −¯0冊
2 +K2
冉
d¯ dy
冊
2
册
dV. 共10兲 ¯ is the azimuthal angle of the director of the last layer of a single period of the structure in each phase, i.e., ¯ is the angle of every fourth, third, and second layer in the SmCA*共1/2兲, SmCA*共1/3兲, and SmCA* phases, respectively. For SmC*,¯=.¯0= 2/p共p is the pitch兲is the wave vec-tor.Wscan be written as关29兴
Ws= −w1具cos1− cos2典−w2具cos21+ cos22典,
共11兲 wherew1 andw2 are the polar and nonpolar coefficients of the anchoring energies, respectively, and 1 and 2 are the values of at surfaces 1 and 2, respectively. When w2 is sufficiently large, 1 and2 should be either 0 or .具 典 in Eq. 共11兲denotes the average over the unit surface.
whether ¯= 0 or . However, in SmC*and SmCA*共1/3兲, it depends strongly on whether¯= 0 or. When the thickness is large, the in-layer distortion energy is rather small, and consequentlyWsis the most dominant term inFs. So¯1and
¯2are determined to have a minimum Ws; hence¯1should be opposite to¯2as shown in Fig.1共a兲. However, when the thickness is low, the in-layer distortion energy increases, and in order to reduce Fs, as in Eq.共10兲, the in-layer distortion
energy itself has to be reduced, in which case¯1is the same as ¯2, creating a uniform state as shown in Fig.1共b兲. Thus, for the SmC*and SmCA*共1/3兲phases, there exists a critical thickness dc, for which Ws changes to reflect a sudden
change from a twisted to a uniform state by a change in the direction of the director near one of the surfaces to reduce the in-layer distortion energy. The transition from the twist to the uniform alignment occurs when the anchoring energy difference between the two alignments becomes the same as the distortion energy of the twist. Approximately, it is found that dc,1=2K2/共2w1兲 for the SmC* phase and dc,1/3 = 32K2/共2w1兲for the SmC*共1/3兲phase. Thus,dc,1/3is three times larger than dc,1. However, for SmC*and SmCA*共1/2兲, Ws does not depend on the direction of¯, so the minimum
energy state is determined to have a minimum in-layer dis-tortion energy for the entire range of thicknesses, as shown in Fig. 1共c兲, where¯1=¯2.
Now we consider the helical and the in-layer deformation energies. When the cell is thin, the in-layer distortion energy is too large to sustain the helical structure; hence the helical structures disappear and a uniform state is obtained. In the uniform state, the helical distortion energy becomes K1¯02d per unit cell area from Eq. 共10兲. As the cell thickness in-creases, a deformed helical structure appears from the center area and enlarges with increasing cell thickness. From this state, the helical distortion energy may not increase on in-creasing the cell thickness, since the helical structure in the center area has zero helical distortion energy. Therefore, the helical distortion energy for large cell thicknesses can be expressed asK1dh¯02, wheredh is another critical cell
thick-ness indicating the change from the nonhelical to the helical structure. Based on this model, the calculated A and Fs for
the different phases are listed in TableI. Usually typical do-mains in the surface stabilized ferroelectric cell, “up” and “down,” appear approximately for 2 – 4m thickness in the
SmC*phase. For the SmC␣*phase,¯0,␣is very large, soFsis
mostly governed by¯0,␣. The period of pitch in SmC␣*is just a few layers, while that in SmC*is usually a few hundreds of layers. The results are calculated from the suggested model for simplified conditions: dc,1= 2m ,w1/A0= 5.5⫻106m,
a0␣2⬃1000A0, a0ferro2 ⬃1300A0, ¯0,␣⬃50¯0,1, dh,1=dh,0 = 5m,dh,1/3=dh,1/2= 100m,K1¯0,12 =K1¯0,02 = 0.01w1, and
[image:4.609.105.505.105.240.2]K1¯0,12 /3=K1¯0,12 /2= 0.
TABLE I.AandFsfor smectic-A*and smectic-C*variant phases. The upper part of the Table represents AandFsfor transitions among SmC*, SmC
A
*共1/2兲, SmC A
*共1/3兲and SmC A
*phase, and the lower part of the
Table representsAandFsfor transitions among SmA*, SmC␣*and SmC*phases.
A Fs共d⬍dc,dh兲 Fs共d⬎dc,dh兲
SmC* −2A0 −2w2+K1¯0,12 d −2共w1+w2兲+dhK1¯0,12 +2K2/d
SmCA*共1/2兲 0 −2w2+K1¯20,1/2d −2w2+dhK1¯0,12 /2
SmCA*共1/3兲 2/3A0 −2w2+K1¯20,1/3d −2/3w1− 2w2+dhK1¯0,12 /3+2K 2/d
SmC A
* 2A
0 −2w2+K1¯0,0
2 d −2w
2+dhK1¯0,0 2
SmA* 0 −2w2
SmC␣* a0␣2 −2w2+dhK1¯0,␣
SmC* a0ferro2 −2w2+K1¯0,12 d −2共w1+w2兲+dhK1¯0,12 +2K 2/d
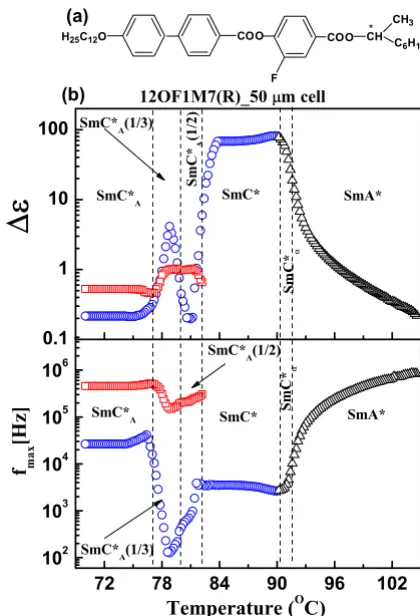
FIG. 2. 共Color online兲 共a兲Chemical structure of 12OF1M7共R兲.
共b兲Temperature dependence of dielectric strength共⌬⑀兲 and relax-ation frequency共fmax兲of different modes of the smectic-C*variant
[image:4.609.329.539.386.694.2]III. RESULTS AND DISCUSSION
The model is experimentally verified using a prototype AFLC compound 12OF1M7共R兲 (共R兲-共-兲- 1-methy-lhephtyl 4-共4’-dodecyloxybiphenyl-4-ylcarbonyloxy兲 -3-fluo-robenzoate) 共Kingston Chemicals, Hull, U.K.兲, chemical structure shown in Fig. 2共a兲. The experiments were per-formed on cooling the sample from 110 to 70 ° C. Sample cells consisted of a planar capacitor made of two chemically etched indium tin oxide–coated glass plates with sheet resis-tance 20⍀/䊐. For planar alignment, the conducting inner surfaces were spin coated with a polyimide RN 1175共Nissan Chemicals, Japan兲alignment layer and rubbed parallel. The cells were filled with the liquid crystals in the isotropic phase. Dielectric measurements in the frequency range from 1 Hz to 10 MHz were made by using the Novocontrol Alpha high-resolution dielectric analyzer with a rms voltage of 0.03 V. The thickness of the liquid crystal cell was measured based on the measurements of the transmittance spectra of an uv-visible spectrometer 共AvaSpec-2048兲 using the interfer-ence fringes caused by the reflection from the two close glass surfaces of the cell.
The temperature dependence of dielectric strength 共⌬⑀兲 and relaxation frequency共fmax兲for three different cell thick-nesses of 50, 10, and 3 m are shown in Figs.2–4, respec-tively. These are found by fitting the imaginary part of the dielectric permittivity共⑀
⬙
兲to the Havriliak-Negami equation. The Havriliak-Negami equation fornrelaxation processes is given by关32兴⑀*共兲=⑀
⬘
−i⑀⬙
=⑀⬁+兺
i=1
n
⌬⑀i 关1 +共ji兲␣i兴i
− jdc ⑀0
, 共12兲
where ⑀⬁ is the high-frequency permittivity, i is a variable denoting the number of relaxation processes up to n,iand ⌬⑀iare the relaxation time and the dielectric strength of the ith process, and ␣iand i are the corresponding fitting
pa-rameters. The term共−jdc/⑀0兲takes account of the dielec-tric loss due to ionic conduction. Ionic conduction is impor-tant at low frequencies.dcis the dc conductivity, andand ⑀0 are the angular frequency and the permittivity of the free space, respectively. The transition temperatures of different phases are determined by measuring⌬⑀andfmaxof different collective and noncollective modes in the dielectric spectra over a wide range of frequency from 1 Hz to 10 MHz for eight different cells, thickness ranging from 3 to 80m as described below. In the SmA* phase, the molecules in the planar configuration are parallel to the plane of the elec-trodes. The molecular relaxation mode around the long mo-lecular axis共not shown兲and the soft mode共black triangles兲 are both dielectrically active as the dipole moment normal to the electrodes fluctuates with electric field in this phase. Close to the transition temperature of the SmC* phase, the soft mode dielectric strength sharply increases and the relax-ation frequency sharply decreases. Based on this, the phase can therefore be easily identified as shown in Figs2–4. In the SmC*phase, the ferroelectric Goldstone mode共blue circles兲 is the most dominant and the phase is characterized mainly by this mode as shown in Figs.2–4. The helix can easily be distorted by a weak external field and a change in the
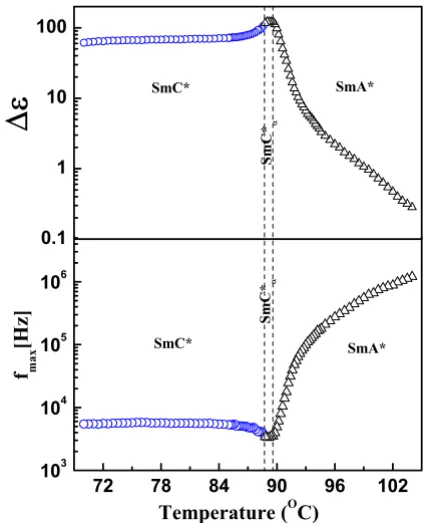
[image:5.609.330.542.66.327.2]mac-FIG. 3. 共Color online兲 Temperature dependence of dielectric strength共⌬⑀兲and relaxation frequency共fmax兲of different modes of the smectic-C* variant phases for cell thickness of 10m for 12OF1M7共R兲.
FIG. 4. 共Color online兲 Temperature dependence of dielectric strength共⌬⑀兲and relaxation frequency共fmax兲of different modes of
[image:5.609.64.279.68.327.2]roscopic polarization with field is very significant and the relative permittivity is very large. Among the chiral smectic-C* variant phases which have multilayer repeating units, the SmCA*共1/2兲and SmCA*phases do not exhibit sig-nificant dielectric response due to the small macroscopic po-larization, as the polarizations almost cancel out in the re-peating units. The transition temperature from SmC* to
SmC*共1/2兲is determined by a drop in the dielectric strength.
In SmCA*共1/3兲, on the other hand, the polarization is only partially canceled out and this phase thus exhibits a signifi-cant dielectric response. Due to its long helical pitch, the value of the relaxation frequencyfmaxin SmCA
*共1/3兲is much
lower than in the SmC*phase. The dielectric strength共⌬⑀兲is
lower than in SmC*due to the reduced macroscopic
plariza-tion. The transition temperature from SmCA*共1/2兲 to SmCA*共1/3兲 is determined by an increase in the dielectric strength and decrease in relaxation frequency, whereas the transition temperature from SmCA*共1/3兲 to SmCA* is deter-mined by a drop in the dielectric strength and an increase in relaxation frequency for the low-frequency mode. Apart from the above discussed modes, several other modes appear in the bulk smectic-C* variant phases as shown by red squares in Fig. 2 for the 50m cell. The characteristic de-pendence of the dielectric strength and frequency of the dif-ferent modes for smectic-C* variant phases is explained by
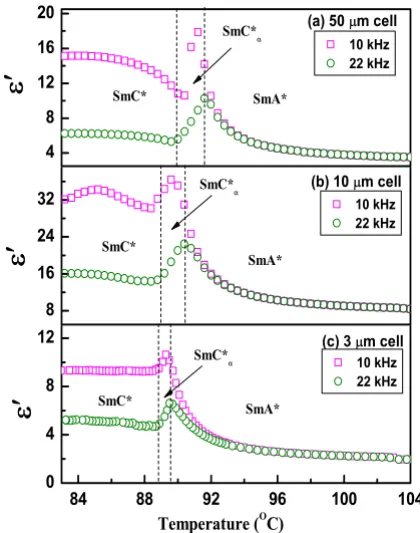
Panarinet al.关33–35兴in detail. The SmC␣*phase is structur-ally equivalent to the SmC*phase but has an extremely short pitch compared to SmC*. This is characterized by a change in the slope of the real part of the permittivity 共⑀
⬘
兲 as a function of temperature关36兴 shown in Fig.5 for 50 共a兲, 10共b兲, and 3m 共c兲 cells for frequencies of 10 and 22 kHz. The first change in the slope is due to an increase in the amplitude of the soft mode close to the SmA to SmC␣* tran-sition, and the second is due to a decrease in the strength of soft mode followed by an increase in the strength of the Goldstone mode at the SmC␣*to SmC*transition. Note that
for the 10m cell a surface-induced mode appears, which is not a characteristic of the phase but is a result of the influ-ence of the cell substrate. This along with the soft mode results in an increased dielectric strength at the SmC␣* to SmC*transition compared to that for a 50m cell.
We note from Figs. 2–5 that the temperature ranges of SmC␣*, SmCA*共1/2兲, and SmCA*共1/3兲phases are narrower for the 10m than for the 50m cell. Furthermore, SmCA*共1/2兲 and SmCA*共1/3兲 are completely suppressed by a thin cell of 3 m thickness. Figures6共a兲and6共b兲show the experimental results for the dependence of the transition temperatures of the phases and the temperature range for which the phases: SmC␣*, SmCA*共1/2兲, and SmCA*共1/3兲are stable, with the cell thickness varying from 3 to 80m. We note that the transi-tion temperatures of almost all phases show a decreasing trend with decreasing cell thicknesses. We find that, on re-ducing the cell thickness, the SmCA*共1/2兲 phase disappears prior to the SmCA*共1/3兲 phase, whereas the SmC␣* phase is rather stable. For cell thicknesses greater than 10m, the temperature ranges of the phases do not vary to a large ex-tent, whereas for smaller cell thicknesses, the temperature ranges of the phases decrease rapidly on decreasing the cell thickness, to the extent that for a thickness 3m SmCA*共1/2兲 and SmCA*共1/3兲totally disappear. Figures6共c兲and6共d兲show the plots of the calculated results from the theoretical model. Here, we may assert that exact determination of the phase transition temperature is rather difficult since the phase tran-sition occurs gradually as the cell thickness is reduced. The phase transition temperatures are also influenced by the co-existence of phases. The results presented in Fig.6 are pre-sented for understanding the qualitative behavior of the sta-bility of the smectic-C*variant phases as a function of the cell thickness. Moreover, we also point out that the experi-ments are carried out during cooling of the sample; the re-sults therefore include the supercooling effect. On the con-trary the theory given here excludes the supercooling effect. The intrinsic phase transition temperature, which is usually represented asTc, is different from the actual transition
tem-perature 共represented asT0兲for a first-order transition.Tcis
the temperature where the free energy of the two phases becomes the same, andT0is the temperature where the phase transition occurs when the supercooling effect is included. Most phenomenological models for the transitions between the tilted smectic phases aim to findTc, ignoring the
super-cooling effect, though the supersuper-cooling is actually very large, especially for thin cells. Our theory also focuses on finding
Tc. Note that the supercooling in the phase transitions
[image:6.609.66.276.67.333.2]be-tween tilted smectics is rather different from the conven-tional concept of supercooling, because in the tilted smectics it is governed mostly by the surface effects, while normally it is governed by the free energy barrier between the two phases. This is the case for most phenomenological theories. This is one of the main reasons for the slight disagreement
between experimental and theoretical results presented in Figs. 6共a兲–6共d兲, apart from the simplifications made in the theoretical calculations. Therefore, as the thickness of the cell is reduced, the experimentally measured transition tem-peratures may be further reduced due to the supercooling effect关19兴. Since supercooling may occur for all the phases, the temperature range for the stability of each phase may not be affected by this effect. However, the theoretical results are in good qualitative agreement with the experiments consid-ering the significant simplifications made in the calculations. For the SmCA*共1/3兲 data in Fig.6共d兲, we note that the tem-perature range of the SmCA*共1/3兲phase is rather constant up to the cell thickness where the SmCA*共1/2兲 disappears, and then sharply decreases on decreasing the cell thickness. A similar two-step stability appears in the experimental results as shown in Fig.6共b兲.
The suppression of these phases on decreasing cell thick-ness was also observed by Lagerwallet al.关19,20兴. Hiraoka
et al. 关23兴 found that the temperature range of the SmCA*共1/2兲phase increases on decreasing the cell thickness, which is different from our results. This is because, in their material, SmC*phase is not present, and while the transition temperature between the SmC␣*and SmCA*共1/2兲phases is not significantly affected, as explained, the transition between the SmCA*共1/2兲 and SmCA*共1/3兲 phases decreases with cell thickness due to the supercooling effect. Hence, the tempera-ture range of the SmCA*共1/2兲 phase increases but this does not contradict the theory. Note that the SmCA*共1/2兲 and SmCA*共1/3兲 phases disappear when the cell thickness is de-creased further关23兴. Panarinet al.关27兴observed suppression
of the subphases by confinement, asw1is weak in all SmC* variant phases of their experiment because the cell surfaces were not coated with a polymer, Sm-C*variant phases there-fore are shown to exist down to much lower cell thicknesses than is the case here where the surfaces are coated by a polymer.
IV. CONCLUSIONS
[image:7.609.113.496.67.335.2]In summary, the stability of SmC␣*, SmCA*共1/2兲, SmCA*共1/3兲, and SmCA*phases is investigated by determin-ing the transition temperatures and the temperature range for which they are stable by varying the cell thickness experi-mentally. A simple theory has explained the experimental observations.共i兲SmCA*共1/3兲is more stable than SmCA*共1/2兲 when the effect due to surfaces is included. This is because SmCA*共1/2兲 has a higher anchoring energy compared to the adjacent phases due to the absence of polar anchoring en-ergy.共ii兲The stability is mostly due to a large polar anchor-ing strength with large spontaneous polarization and a con-sequent reduction in the surface energy.共iii兲SmC␣*is rather stable, and the transition temperatures between the higher-temperature phases are unaffected by the surfaces. This arises from the higher temperature-dependent coefficient of the free energy.共iv兲The temperature range of SmCA*共1/3兲is rather constant up to the thickness for which SmCA*共1/2兲 exists. Once SmCA*共1/2兲 disappears, the temperature range of SmCA*共1/3兲decreases rapidly on decreasing the cell thick-ness.
FIG. 6. 共Color online兲 The dependence of the 共a兲 transition temperature of the phases and 共b兲 temperature range for which SmC␣*, SmC
A
*共1/2兲and SmC A
*共1/3兲phases are stable as a function of the cell thickness that varies from 3 to 80m.共c–d兲represents the calculated
ACKNOWLEDGMENTS
SFI Grant No. 共02/IN.1.I.031兲 is thanked for funding the research work. One of the authors 共JKS兲 thanks
Samsung Electronics Co. Ltd for granting a leave of absence from Seoul. We thank Atsuo Fukuda for fruitful dis-cussions.
关1兴A. D. L. Chandani, Y. Ouchi, H. Takezoe, A. Fukuda, K. Terashima, K. Furukawa, and A. Kishi, Jpn. J. Appl. Phys., Part 2 28, L1261共1989兲.
关2兴A. D. L. Chandani, E. Gorecka, Y. Ouchi, H. Takezoe, and A. Fukuda, Jpn. J. Appl. Phys., Part 2 28, L1265共1989兲.
关3兴N. Okabe, Y. Suzuki, I. Kawamura, T. Isozaki, H. Takezoe, and A. Fukuda, Jpn. J. Appl. Phys., Part 2 31, L793共1992兲.
关4兴E. Gorecka, A. D. L. Chandani, Y. Ouchi, H. Takezoe, and A. Fukuda, Jpn. J. Appl. Phys., Part 1 29, 131共1990兲.
关5兴H. Takezoe, J. Lee, Y. Ouchi, and A. Fukuda, Mol. Cryst. Liq. Cryst. 202, 85共1991兲.
关6兴A. D. L. Chandani, N. M. Shtykov, V. P. Panov, A. V. Emely-anenko, A. Fukuda, and J. K. Vij, Phys. Rev. E 72, 041705
共2005兲.
关7兴V. P. Panov, J. K. Vij, Yu. P. Panarin, C. Blanc, V. Lorman, and J. W. Goodby, Phys. Rev. E 75, 042701共2007兲.
关8兴H. Orihara and I. Ishibashi, Jpn. J. Appl. Phys., Part 2 29, L115共1990兲.
关9兴B. Zeks and M. Cepic, Liq. Cryst. 14, 445共1993兲.
关10兴A. Fukuda, Y. Takanishi, T. Isozaki, K. lshikawa, and H. Tak-ezoe, J. Mater. Chem. 4, 997共1994兲.
关11兴A. Roy and N. V. Madhusudana, Europhys. Lett. 36, 221
共1996兲.
关12兴T. Akizuki, K. Miyachi, Y. Takanishi, K. Ishikawa, H. Takezoe, and A. Fukuda, Jpn. J. Appl. Phys., Part 1 38, 4832共1999兲.
关13兴P. M. Johnson, D. A. Olson, S. Pankratz, T. Nguyen, J. Goodby, M. Hird, and C. C. Huang, Phys. Rev. Lett. 84, 4870
共2000兲.
关14兴A. V. Emelyanenko and M. A. Osipov, Phys. Rev. E 68, 051703共2003兲.
关15兴M. A. Osipov, A. Fukuda, and H. Hakoi, Mol. Cryst. Liq. Cryst. 402, 9共2003兲.
关16兴M. Cepic and B. Zeks, Mol. Cryst. Liq. Cryst. Sci. Technol., Sect. A 263, 61共1995兲.
关17兴T. Isozaki, F. Takayuki, H. Takezoe, A. Fukuda, T. Hagiwara, Y. Suzuki, and I. Kawamura, Jpn. J. Appl. Phys., Part 2 31, L1435共1992兲.
关18兴D. W. Berreman, Phys. Rev. Lett. 28, 1683共1972兲.
关19兴J. P. F. Lagerwall, D. D. Parghi, D. Kruerke, F. Gouda, and P. Jagemalm, Liq. Cryst. 29, 163共2002兲.
关20兴J. P. F. Lagerwall, P. Rudquist, S. T. Lagerwall, and B. Stebler, Ferroelectrics 277, 239共2002兲.
关21兴P. Jagemalm, J. P. F. Lagerwall, A. Dahlgren, L. Komitov, A. S. Matharu, C. Grover, F. Gouda, and A. A. Kutub, Ferroelec-trics 244, 147共2000兲.
关22兴H. Moritake, N. Shigeno, M. Ozaki, and K. Yoshino, Liq. Cryst. 14, 1283共1993兲.
关23兴K. Hiraoka, T. Maruyama, and Y. Noguchi, Jpn. J. Appl. Phys., Part 1 43, 8173共2004兲.
关24兴Yu. P. Panarin, C. Rosenblatt, and F. M. Aliev, Phys. Rev. Lett.
81, 2699共1998兲.
关25兴H. Xu, J. K. Vij, A. Rappaport, and N. A. Clark, Phys. Rev. Lett. 79, 249共1997兲.
关26兴J.-F. Li, E. A. Shack, Y.-K. Yu, X.-Y. Wang, C. Rosenblatt, M. E. Neubert, S. S. Keast, and H. Gleeson, Jpn. J. Appl. Phys., Part 2 35, L1608共1996兲.
关27兴Yu. P. Panarin, Yu. P. Kalmykov, S. T. MacLughadha, H. Xu, and J. K. Vij, Phys. Rev. E 50, 4763共1994兲.
关28兴W. Chen, M. B. Feller, and Y. R. Shen, Phys. Rev. Lett. 63, 2665共1989兲.
关29兴M. A. Handschy, N. A. Clark, and S. T. Lagerwall, Phys. Rev. Lett. 51, 471共1983兲.
关30兴M. Brunet and E. Williams, Ann. Phys.共N.Y.兲 3, 237共1977兲.
关31兴M. Glogarova, J. Fousek, L. Lejek, and J. Pavel, Ferroelectrics
58, 161共1984兲.
关32兴S. Havriliak, Jr. and S. Negami, Polymer 8, 161共1967兲.
关33兴Yu. P. Panarin, O. Kalinovskaya, J. K. Vij, and J. W. Goodby, Phys. Rev. E 55, 4345共1997兲.
关34兴Yu. P. Panarin, O. Kalinovskaya, and J. K. Vij, Liq. Cryst. 25, 241共1998兲.
关35兴Yu. P. Panarin, O. Kalinovskaya, and J. K. Vij, Appl. Phys. Lett. 72, 1667共1998兲.