-
. . +.,.-.... ....—
-—-. . . —. --.+--- .. ... . .. . . . ..
.
.
—-. .
$--- -. .!-- !.. . . .
Department of Eneray under contract W-740SENQ-36.
. .. . . ... . .-. .-.
-.$..q, ,*A..l.,~— ,+,*- _._= -— 4,—,,, ..... i.-_ .-.-_. Q. -.+ —.+ ,.,, - .;-. —.. — .. —.. .-—.. . . . .. . . .. ..” ,, . .... .’..,- ._.,.,:’<: ;., ..’.. . ,, .’. ” -’ . . .
Y- ..,-.. . . .. . .., ,. ,., . ;.
-’
.:-..=””es~+~~~+~=~”:~~
~++:$++~:+’~:
~~~’-?
““--<”-~=
:’””
~iw -
‘-’”’~’”
““” -‘“--. ‘“--. - ., :..; :.. _O:. .=b@* ;i..&..#--.# @
,, -_ ___ ___ >._-=
An Affiitive Actior@qual Opporhcrsity Employer
This work was supported by the US Air Force Weapons Laboratory.
-.
I ,.:.
.,
DISCLAIMER
This reportwaspreparedasanaccountof work sponsoredby an agencyor the Wrdied-StatesCwer-ru-nent. Neitherthe UcutedStatesGovernmentnor any agencythereof,norSSSYof theiremployees,makesacry warranty,exprKs or tmplied,or assumesany legalIiabihtyor responsibilityfor theaccuracy,completeness, os rasefulne=or acryinfocmatiorr,apparatus,produd, or processdisclosed.or repreaantathatits usewould not infringeprivatelyowned rights. Referenceshereinto aasyspidlc corrvnercialproduct,process,or serviceby tradename,trrrdemaik,maarufacturer,or olhenviae,dws not necessarilyconstituteor imply its cstdorsecnent,recornrnendation,or favoringby the UnitedStatesCovernmenlor any agencythereof. The
LA-9475-MS
.
“J
.
UC-34
Issued:
Optical
Properties
of Explosive-Driven
Shock Waves in Noble Gases
#
@
C. R. Jones
W. C. Davis
September
1982
OPTICAL PROPERTIES OF EXPLOSIVE-DRIVEN SHOCK WAVES IN NOBLE GASES
by
C. R. Jones and W. C. Davis
ABSTRACT
I
I. INTRODUCTION
Experiments addressing optical properties of explosive shock-driven light sources are reported. The major purpose of these experiments was to
identify
the parameters affecting the brightness temperature of shock fronts created in rare gases by means of high explosives.The basic apparatus for these experiments was the argon flash charge, which has been used for many years at the Laboratory and elsewhere as a bright visible light source for explosive-test pho-tography. As a result, these sources have been characterized fairly well in the visible part of the
1
spectrum. In at least one program, however, there is a requirement for bright ultraviolet (UV) light sources. Therefore, we have performed ap. proximately 40 experiments on HE-driven light sources using both uv and visible diagnostics.
The primary goal was to determine the bright-ness temperature of both planar and cylindrical shocks in argon ga~. In addition, the temperature was measured for planar shocks in neon, krypton, and xenon. We also determined the shock velocity and observed the shock front stability in both planar and cylindrical geometries. In the planar geometry, the effect of a molecular impurity in argon was observed, as well as the effect of argon pressure.
In the next section, experiments on the planar shock waves will be discussed. Following that, the cylindrical geometry experiments will be addressed. The fourth section will compare these results with those of other workers. In the final section, the results will be summarized and con-clusions presented.
II. EXPERIMENTS ON PLANAR SHOCK WAVES The first subsection will discuss the pheno-menology of planar shock waves propagating down cylindrical tubes. The important characteristics of these light sources, including various wall
interactions, are featured. The subsequent sub-section will describe the experiments on the ultra-violet emission from these planar sources.
A. The Explosive-Driven Argon Shock Tube The interacting waves in the argon shock tube or argon flash charge were photographed using a smear camera. This camera has a narrow
entrance slit and accepts and records only that light emitted along a diameter of the shock tube. The image of the entrance slit is swept along the film after reflection from a rotating mirror. The record on the film therefore shows the intensity of the light from the tube as it varies with time. Time increases in the long direction of the film while space along a tube diameter is represented perpendicularly.
Four shock tubes were photographed. Each tube was made of dural, with an inside diameter of 3.5 inches (88.9 mm) and a wall thickness of 0.25 inch (6.35 mm). The lengths of the tubes were 1 inch (25.4 mm), 2 inches (50.8 mm), 4 inches (101.6 mm), and 6 inches (152.4 mm), respectively. The records are shown in Fig. 1. Time marks on the films are 1 ps for each large division, so the total width is about 19 ps. In the spatial direction each tube is 88.9 mm in diameter, and the width of the bright bands at the left edge corresponds to this distance.
The shock tubes were driven by a 4-inch diameter plane-wave lens (a P-040 lens made of Composition B and Baratol) that initiated a plane detonation wave in a disk of PBX-9404 explosive that was 4 inches ( 101.6 mm) in diameter and 1 inch (25.4 mm) thick. PBX-9404 is a high-energy plastic-bonded HMX composition. Its density is 1.84 g/cm3, detonation velocity 8775 m/s, and detonation pressure 35.6 GPa. The disk of PBX-9404 drives the shock wave in the tube; the lens merely provides almost simultaneous ini-tiation of the disk on one face. The explosive disk seals one end of the argon shock tube. The other end is sealed by a glass window about 30 mm thick. 1
At the left edge of the smear camera records, corresponding to the time when the detonation wave in the explosive reached the interface with the argon, we can see the light intensity rise to
full brightness in about 0.1 ps (one small division). This risetime is the time needed to shock enough argon to get one or two optical depths so that it radiates as a blackbody. The shock wave travela about 9 mm/ps and the density of the argon at one LOs Alsmos atmosphere is about fJ.0013 g/cm3, so that in O. 1 ps about 0.00117 g/cm2 becomes optical-ly thick. The compression of the argon by the
.
.
shock is about 12, so the layer is only 0.075 mm thick. Ahead of it lies unshocked argon at atmos-pheric pressure, and behind it are the explosive product gases. The striations in the light that persist for about 0.5 ps are caused by small imper-fections in the wave from the explosive, amplified by the instability of the interface of the argon and explosive products. As the argon layer becomes thicker, these little ripples lose their effect.
In a detonating explosive, the pressure is highest at the detonation front, and it falls rapidly in the gases following the front. As time goes on, the pressure in the products driving the argon falls, and the shock wave slows down a little. Since the temperature depends on the shock speed, the shock temperature and shock brightness de-crease with time. The decrease can be seen along the center of each shock tube, but only up to about 13 ps in the longest tube. The x-t (length and time) data from the three tubes in which a plane segment of the main shock reaches the end window are fit fairly well by
x = 697[1 - exp(-O.013t)] ,
with x in mm and t in ps. The shock velocity, obtained by cliff erentiation, is
U = 9.06 exp(-O.013t) .
Radiation from the argon shock waves is absorbed by the tube boundaries. The window on the end of the tube is transparent for a very narrow spectral region, and absorbs most of the radiation incident on it. The gas next to the window is heated, and as it expands it drives a shock wave back toward the main shock. The intersection of these two shocks can be seen in the short tube about a quarter of a microsecond before the Light goes out, and in the 2-inch tube about
one-half microsecond before the end. The light brightens for a very brief instant, and then it becomes dimmer than it would have been. The reflected shock in the argon that has been heated by the main shock heats it even more, and the J.ight brightens. This very hot shock is optically
thick very quickly because it is so hot. The argon heated by the transmitted shock is not as
4
hot. The bright light is transmitted through it until it becomes optically thick, and then the light dims to correspond to its temperature.
The end of each record shows what happens as the shock wave reaches the glass window. As the shock reflects, the pressure increases and the temperature jumps to a high value. The light brightens correspondingly, but then very quickly goes out. The cooling of an opaque Iayer next to the glass window is probably caused mainly by radiation. Other experiments have ahown, how-ever, that the rate of cooling depends on the composition of the surface of the window. Perhaps some relatively cold glass, evaporated by the absorption radiation, mixes with the hot argon to form a cool, opaque layer at the interface.
The phenomena that occur at the wall of the dural tube may, perhaps, be more easily under-stood by first considering another analogous effect well known to those ,who work with explosives. It
happens in cracks in the explosive, or in the space between explosive and metal when the parts do not fit closely. Let us tpke the case of a cylinder of explosive in a metal tube with a space (fiLled with air) between the explosive and the tube. Figure 2 shows the positions of various fronts after the detonation has proceeded up the
/
Explosive
Detonation frc
Product goses
Airspoce
k
Metol tuber
Sh::ko~rave\
l“
Products/oirinterface
/
Tube deflected
.A
by explosive
//
Fig. 2. Diagram of explosive in a metal tube with an air gap between the explosive and the tube. The dense explosive-product gases drive a precursor shock in the air layer.
tube for some distance. The air in the annular gap is compressed by the expanding explosive products, and driven up the gap. All the air that was in the gap is now compressed between the products-air interface and the shock wave in the air. The shock in the air runs ahead of the deton-ation front, getting farther ahead as time goes on. The shocked air transmits its pressure to the metal tube on one side and the unreacted explosive on the other. The pressure is relatively smau, however, about O. 1 GPa, and neither the solid explosive nor the metal deflects appreciably. There are shocks in both, shown as lines from the front of the air shock going back at approximately the Mach angle.
Figure 3 shows the positions of the various fronts in the argon shock tube. The thick heated layer of argon at the wall is less dense than the bulk of the argon, end it takes the place of the air gap in the explosive tube. The shock in the bulk argon acts as the expanding explosive pro-ducts did in Fig. 2, driving the hot gas ahead of
Argon layer
Aeoted by radiation
k
Compressed gosfrom hot Ioyer
Mach wave
Compressed Argon
Explosive product goses
Fig.
—
3. Diagram of an argon shock wave in a metal tube. There is a layer of hot argon at the tube wall abead of the main dis-turbance, because the intense radiation from the hot argon at about 24 kK is ab-sorbed at the wall and heats the gas near it. A precursor is driven by the main shock wave, and it runs ahead in the hot layer. The precursor in the hot layer cause’s a shock wave (Mach wave) in the bulk of the argon, and this wave is re-sponsible for some of the main features seen in the smear camera records.it.
There is a big difference in the compressibility of the argon relative to that of the explosive, and the Mach wave from the precursor shock heats the argon appreciably. The main shock then heats the gas further, so it appears brighter.The smear camera trace, Fig. 1, shows the brighter light from the gas that is precompressed by the Mach wave and then is shocked by the main shock , which starts at the outside of the tube and then moves in. The compressed gas from the hot layer is not luminous enough to show in the pic-ture, but its presence is shown by the way it obscures the light, thereby making the light region narrower as it runs. (Note that the dark lines, which are defects in the camera slit and which run in the time direction, get closer to the edge as time goes on. ) The precursor shock makes a little light when it hits the window; it can be seen at about 4.6 ps for the 2-inch tube, about 9 ps for the 4-inch tube, and about 14.2 ps for the 6-inch tube. Its interaction with the window causes peculiarities in the outside ring as the main shock advances near the window. The intersection of the Mach waves (at about 13.1 ps in the 6-inch tube), causes a strong brightening at the center. All the oscilloscope traces of shock brightness show this effect. The center of the wave moves very rapidly after the interaction, and while the center was last to reach the window in the 4-inch tube, it is first in the 6-inch tube. After the interaction the shock wave has a convex section at its center, surrounded by a funnel-shaped shock. The cusp at the intersection of these waves shows up as a pair of dark lines in the photographs.
Probably the details of wall interactions, etc. , are of little importance for most purposes. It is helpful to understand the details to be sure that some important process has not been missed. It might be possible to enhance the performance of
shock-tube light sources by putting in extra interactions to increase the light output.
The precursor waves and other interesting
B. Ultraviolet and Visible Emission from Planar Shock Waves in Rare Gases
Radiometric measurements of the uv and visible radiation emitted by rare gas flash charges are discussed below. The experimental technique will be presented first, followed by results ob-tained from various tests. Tests were numbered UV- 1 through UV-38 in chronological order.
1. Experimental Arrangement. For these tests the source was an argon flash charge des-cribed previously and similar to that shown schem-atically in Fig. 4. This shot was usually located a distance of approximately 6.5 m from the bunker window . This device consists of an argon-filled tube with an explosive charge at one end and a window at the other. The tube, of either card-board or dural, was usually 30 cm in length and 8.75 cm in diameter. A small gas port was located near each end to facilitate purging the system with argon. In some experiments with a dural tube, an evacuation and fill procedure was used. One end of the tube was sealed with the explosive, a 2.5-x 1O- X 10-cm block of PBX 94o4. In most tests a P40 explosive plane-wave lens was positioned between the detonator and primary explosive. The other end of the tube was sealed with a thin aluminum plate in which was centered a l-cm-diam aperture. A quartz window could be placed over this aperture, as shown, or could be omitted.
The Light source was directed toward the bunker window via an aluminized front-surface turning mirror shown in Fig. 4. In this arrange-ment no fragments from the explosion reached the bunker window.
The one or two detectors used for these tests were located just inside the bunker window and were pointed directly toward the source. The centers of the bunker window and detector all lay along a common optical axis that was collinear with the source axis.
Each of the detectors was an ITT F-4018 biplanar photodiode having an S-5 response, giving the detector good sensitivity between 200 and 500 nm. These detectors have a linear dy-namic range of nine orders of magnitude. Al-though not required for this experiment, the response times of the detectors were less than a nanosecond. The recommended bias voltage of 1.0 kV was applied to the detector for these tests.
ALUMINUM PLATE WITH
PUMP AND /’=m “AMETER ‘pmTuRE
FILL PORT \
“;=”
TUBE EXPLOSIVEFig. 4. Schematic of explosive flashlamp or argon flashcharge: typically the tube is 10 cm in diameter by 30 cm in length. Varia-tions include cardboard material for the tube, no window over aperture, no plane-wave lens on primary explosive, different rare gas fill, and use of a turning mirror to direct output toward detectors located inside bunker window.
A band-pass filter centered at 280 nm was mounted onto the front of one detector. The passband of the filter was 20 nm FWHM and the peak transmittance was 17%. The 2. 5-cm-diam filter was larger than the 2. l-cm effective diameter of the detector. Light leakage around the filter was reduced by securing the filter in the detector housing by means of a snug fitting O-ring. The detector for the visible measurements was similarly equipped with a band-pass filter having a peak transmittance of 60% at 520 nm and a 9-rim FWHM. 2. Experiment preparation, For each test, the argon flash charge was positioned approximately 6.5 m from the bunker window. It was aligned by carefully boresighting the tube toward the bunker window . The radiometers were positioned inside the bunker to be pointing directly toward the aperture in the source. The optical distance between the source aperture and the detector was carefully measured with a tape measure and re-corded.
The signal cable from each detector was terminated with 50 ohms at the input to one of the oscilloscopes. The bias voltage on each detector was set at precisely 1.0 kV. These were the conditions under which the detectors had been calibrated absolutely against standard lamps. 3
After the argon purge through the argon flash charge had been flowing for several minutes at 0.5 CFM (for flash charges using a purge fill), the shot was fired. For tests using other rare
gases or a gas mixture, the dural tube was evacu-ated after sealing with a trapped mechanical pump, then filled to the reported pressure(s).
3. Results from Tests UV-1-6. The firs t group of tests conducted in this series were Tests UV-1-6. The sources used argon in cardboard tubes described previously. Although these tests have been reported, 3 much of that description will
be repeated here since it also applies to many sub-sequent tests.
The uv light pulses resulting from Tests UV-2, 3, and 4 are shown in Fig. 5. UV-2 was a repeat of the conditions of UV-1. In UV-2 there was no window over the source aperture and the detonation was initiated at a point at the rear center of the charge. In UV-3 a uv-grade quartz window over the aperture was added. In UV-4 there was the window in addition to a plane-wave initiation of the detonation. Tests UV-5 and 6 were included only for verification of the first tests.
4. Analysis of pulse shapes. We will first discuss the qualitative features of the pulses. In the top trace of Fig. 5, the large off-scale feature at the end of the pulse is due to the shock-heated argon exiting the open aperture. The brightness increase over that of the first part of the pulse is due to the increase in radiating area as the plasma
m
NO QUARTZ WINDOWAND
NO PLANE-WAVE LENS
I
I I I I I I I 1 1 I1 1 I I I I I I I
WITH QUARTZ WINDOW
AND
NO PLANE-WAVE LENS
WITH QUARTZ WINDOW
AND
WITH PLANE-WAVE LENS
-+
p-lop
Fig. 5. Signals from UV-2, 3, and
280-nm radiometer for Tests 4.
is released through the aperture. The time for this event to begin agrees approximately with the known time for the shock to travel down the tube. In the lower two traces of Fig. 5, this large pulse did not appear because the window prevented the plasma from escaping.
In the top and center traces the detonation originated from a point at the rear center of the charge. The shock wave traveling through the argon is therefore diverging. The bump near the center of the pulse is due to convergence of the reflected wave arising when the hemispherical shock wave collides with the cardboard walls. The timing of this bump agrees with the photographic observation of the Mach stem on the axis of the tube at a time of 32 ps after the trigger.
In the lower trace in which plane-wave initi-ation was used, there is a much smaller center bump. It is caused by convergence of the “wall waves” discussed above in Sec. 11A. This pulse has an almost constant brightness over the first 28 ps, after which time it linearly decays, then abruptly terminates. In these sources, the light emission begins when the detonation wave exits the explosive material and enters the gas. The abrupt termination of the pulse occurs when the shock wave reaches the window. The small increase in intensity at the very end of the pulse is due to the higher temper+ure the gas reaches within the reflected shock.
In each test the distance between the inside face of the explosive and the aperture plate was 30.5 cm. In the center trace the pulse length is 48 ps and in the lower trace 41 ,US. These values correspond to average shock velocities in the two cases of 6.6 and 7.4 mm/ps, respectively.
Using the signals shown in Fig. 5, the bright-ness temperature and a number of other radiometric quantities may be determined. This is possible because the detector and its filter were calibrated absolutely using a standard deuterium source. The process of determining the temperature of the source, as well as the calibration procedure, is described in Ref. 3.
respectively. The higher temperature for UV-4 is not understood and should not be ascribable to the use of plane-wave lens initiation of the primary explosive (although other features of the signals can be). The UV-2 and 3 temperatures are in good agreement with those obtained from subse-quent similar tests. The decrease in emission after the initial peak is typical, reflecting the deceleration of the wave with time as discussed above.
In Tests UV-17, 18 the effects of different tube materials were compared, and the emission was recorded by a A = 280-nm and a A = 520-nm radiometer. One tube was cardboard and the other dural, each having dimensions used before. A plane-wave lens was used in each case. The resulting signals are shown in Fig. 6. At each wavelength the amplitudes for the two tests are nearly equal, indicating peak temperatures of 22 kK at A = 280 pm and 23 kK at A = 520 pm. The agreement between the temperatures for the two wavelengths suggests that in this spectral region the source is emitting as a blackbody. Note that in the case of the dural tube the pulse length is somewhat shorter, indicating a higher average shock velocity than in the cardboard tube. In UV-20, 21 the effect of fill pressure on the performance of the argon flash charge is studied. Using dural tubes, the argon pressures are 66 psia and 11 psia (local atmospheric pres-sure). The resulting signals are the top two in Fig. ‘i. CAROBOARO TUBE P=ll PSIA ALUMINUM TUBE P=ll PSIA Fig. 6. 8
(The higher pulse amplitude for A = 280
5 mV lops 2 mV 10 ps
) I 1 1 I I I I I I 1 r I I I I I I I I c
u
r
mm
A = 280 nm A=520nmSignals from 280-nm (left) and 520-nm (right) radiometers for Tests UV- 17,18.
ARGON AT 66 PSIA ARGON AT 580 torr ARGON AT 570 torr WITH C3F71
AT 10 torr
10mV lops
❑
I-’’’’’’’
”-l
IIIIIIIIIIJn
11111111111
~=270nm 2mV lops m1 I I 1 I I I 1 I
1“’’’’’”;
M
)t=520nmFig. 7. Signals from both uv and visible radi-ometers for Tests UV-20, 21, and 22. Effects of argon pressure change are examined in upper two sets. Lower two address effect of molecular species (hav-ing a large specific heat) added to’ argon.
compared to that in Fig. 6 is due to replacing the front-surface aluminized turning mirror having an SiO overcoat with one without the overcoat for greater reflectivity in the ultraviolet. ) The peak temperatures for the higher pressure case are T=26kKat A=280nmand T =23kKat A= 520 nm. For the atmospheric pressure test, T = 24 kK at A=280nmand T=22 kKat A=520nm. The greater pulse droop at the higher pressure is due to the expected larger deceleration of the shock wave through the medium of greater density. The longer pulse length also suggests a greater deceler-ation.
UV-21 , 22 compare flash-charge emission with and without an admixed molecular species,
C3F71 “ These signals are the lower two in Fig. 7. A broad absorption band in C3F71 centered at A = 270 nm absorbs most of the emission detected by the uv radiometer at early times. However, as the emitting shock wave nears the end of the tube the optical density becomes small enough to allow penetration of the pulse tail. The A = 520 nm emission, not absorbed by the additive, indicates a
,
peak temperature of 22 kK. No cooling of the shock wave by -2% molecular species occurs. In UV-25, 27 this comparison is repeated with 50-torr
C3F71 “ The reduction in temperature was from T = 23 kK to 22 kK for A = 520 nm. We must conclude that -10% C3F71 does not reduce the shock front temperature. However, the resulting heavier mixture was manifested in a longer pulse and a greater pulse droop, as discussed before.
The results with argon flash charges are summarized in Table 1. Averaging these data with two later argon shots discussed below indicates that the peak temperature of these sources is 25 flkKat A=280nm and 23tlkK atA= 520 nm. These temperatures correspond to the initial shock velQcity of 9 mm/ps. After this series was concluded, the radiometers were calibrated once again against the same standard lamps. There were no changes in the calibration factors.
A modest effort was devoted to obtaining time-resolved spectra of argon flash charges. A
4 rotating-mirror ultraviolet spectrograph, Los Alamos National Laboratory Model 40, was used. One of the resulting records is shown in Fig. 8. The spectral coverage is 250-500 nm. The top edge, near the Hg lamp spectrum, corresponds to the time the shock wave from the explosive entered the argon, and the lower edge is about 30 IJS later. The absence of exposure at the ultraviolet end of the spectrum is probably the result of the lack of film sensitivity in that region. The ap-parent lowered exposure near the green end is probably caused by the reduced efficiency of the diffraction grating, which is blazed for the near ultraviolet. The three broad absorption features
Test Number 2 3 4 7 8 17 18 20 21 22 TABLE I
ANGON FL4SH CSANGE SUMASY
Argon Pressure Measured Temperature psia Added Gas A=280um A=520nm
11 none 27 I&
--11 none 27 -.
11 none 31
.-11 none 25
--11 none 26
--11 none 22 23ks
none 22 23
:: none 26 23
11 none 24 22
11
10 ‘0== C3F71 -- 22
are thought to be high vibrational level Shumann -Runge bands of 02, showing absorption in the air between the flash charge and the spectrograph. There may be some absorption by ozone below 290 nm. There are several sharp absorption lines between 420 and 450 nm that have not been even tentatively identified. These results, although the experiments done so far have shown only that it is possible to obtain spectra, show that corrections for absorption of some of the radiation by air between the shock source and the detector may be needed, and that the molecules responsible for the absorption can probably be identified.
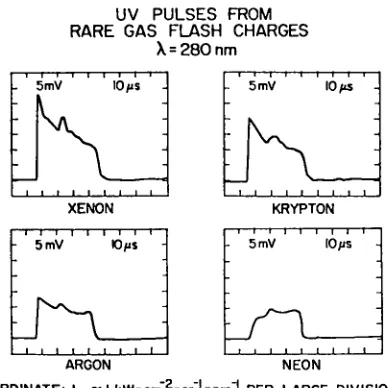
5. Results from Tests Using Other Noble -Gases. Using flash charge set-ups similar to those described above, we have used the uv and visible radiometers to measure the temperature of shockwave fronts in neon, krypton, and xenon. For comparison purposes, argon was included in this series. Gases used in these tests were ana-lyzed for impurities. 5 For this purpose, a‘ gas sample was taken directly from the gas cylinder and also drawn from the dural flash-charge cell after it was filled. Only tbe A = 280 run radi-ometer was used for this series.
The light pulses obtained are shown in Fig. 9. Two different tests were performed for each noble gas, which was drawn from separate cylinders where possible. Helium was not included, because previous tests in other programs have shown that it yields very little light emission. Data from these tests are summarized in Table 11.
‘SPEC1
ARGON
FLASHCHARCE,
o-3ops
Fig. 8. Time-resolved spectrogram of argon flash-charge emission. Spectral coverage is 2S0-500 nm with Hg atomic lines included at top. Time covered is --0- to 30-I.Js portion of light output.
.
.
UV PULSES FROM
RARE GAS FIASH CHARGES
h= 280 nm
nm
1 , , , , , I I , , , , t I , , JXENON XRYPTON
❑
5 mV lopsARGON
D
5 mV lops
NEON
ORDINATE: Li=lkW-cm-2-sr-’ -rim’ PER LARGE DIVISION
Fig. 9. Ultraviolet signals from flash charges con-taining xenon, krypton, argon, and neon.
TABLE 11
SASS-GAS FLASK-CNARGE SLMUARY
w-7 8 9 10 11 12 13 R. re G. s Al-At’ xc K. Ne Ne Kc x. Peak Tempera turea 25 kx 26 36 29 23 22 31 35 Cylinder Gas Purity
--99. 7% 98.0% 99. 6% 99.9% b b 99.4XPur, ty of Gas From Shot
--99.8X 98.3% 99.6% 89.0% 99.9% 99.3% 99.2%“A = 280 fun, b
These samples from same cylinder as first test with this gas.
III. EXPERIMENTS ON CYLINDRICAL SHOCK WAVES
Measurements have been made on shock waves in argon gas driven by radial expansions from cy-lindrical explosions. The first subsection will dis-cuss the apparatus and phenomenology of these tests. The second subsection will address the radiant emission from the cylindrical shock fronts. A. Argon “Shock Waves Driven by Radial
Expan-sion of Cylindrical Explosive Charges
Three experiments have been done to obtain information about argon shock waves driven by c ylkzdrical explosive charges. The expanding gases from a solid cylinder of explosive transfer a larger fraction of the explosive energy to the argon than plane-wave systems do, because in the cylindrical configuration the dense explosive gases
have less kinetic energy. Two of the experiments had the explosive initiated at one end of the long cylinder, and one experiment had the cylinder initiated along its central axis.
The first experiment was done because it was a small addition to an experiment being done for another purpose. The original experiment had a cylinder of explosive, initiated at one end, ar-ranged along the axis of a much larger steel tube. The purpose of it was to study the motion of the tube. For our purposes, we closed the tube with
a glass sheet and changed the gas from air to ar-gon, with no deleterious effect on the results for the tube motion study. A diagram of the experi-mental arrangement is shown in Fig. 10. The ex-plosive was PBX-9501, a plastic-bonded HMX com-position with density 1.84 g/cm3, detonation pres-sure about 36 GPa, and detonation velocity 8.78 mm/ps. The cylinder was made up of 11 seg-ments, each 50.8 mm diameter and 54.4 mm long, for a total length of 598.5 mm. The segments were glued together with careful alignment to make a
/
Explosive - Argon — Steel ‘L, Seal ) — Table \ ~ Detonator— 648 mm i
[image:14.602.83.277.52.246.2] [image:14.602.333.546.363.638.2]uniform cylinder. The steel cylinder was 6.35 mm thick, and was 648 mm inside diameter and 1524 mm long. It was set on end on the ground, and a table about 900 mm tall was set inside it to hold the explosive. A glass sheet was placed on the top of the steel cylinder. The table was fitted with rubber to seal it to the cylinder. The ex-plosive was aligned on the axis of the cylinder, and the top end of the explosive was about 25 mm from the glass plate. A square-shaped large mir-ror, 600 mm on a side, was placed above the glass at 45° to reflect light from the shock wave to the cameras. The initiator and cabling came UP through the table. Argon was flowed through the closed upper section of the tube at a rate of 1.2 cfm for 40 minutes to replace all the air with argon, forcing it out between the top flange and the glass sheet. The flow was maintained through the detonation time.
The light from the conical shock wave in the argon gas was reflected from the overhead mirror to the bunker and through a beamsplitter to two separate image-intensifier cameras. One camera photographed the shock at 60.02 ps after detona-tion, and the other at 69.99 ps. The later photo-graph is shown in Fig. 11. The print was made to accentuate brightness differences, and the light is dimmer at the edges where the shock becomes weaker. The print also shows poorly defined rings; these arise from the slight imperfections where the segments of the explosive cylinder are joined. The presence of the rings allows some analysis of the photograph, because they allow
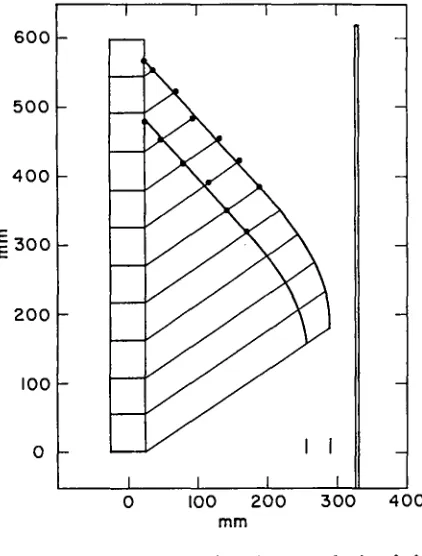
for tracking those points. From earlier work (particularly shot number C-3159), it was known that the argon shock made an angle of about 42° with the cylinder axis, and that the marked points moved out on a line making an angle of about 55° with the axis. The points measured from both photographs are shown in Fig. 12. The times that the pictures were taken, and the known detonation velocity, give the position of the detonation wave. The limit of luminosity at the outer edge of the shock gives an approximate position for the shock near the initiation end of the charge. These data give reasonable agreement with expectations, and show that even slow and weak shocks are still bright enough to be useful. The uniformity of the
image-intensifier tubes is not good enough for quantitative brightness measurement without care-ful calibration, and it is not attempted with these data. The initial shock velocity found here is 5.85 mm/ps, from U = D sin 8, where U is the shock velocity, D = 8.75 mm/ps is the detonation velocity in a 50-mm cylinder, and e is the angle the shock makes with the axis.
The second experiment was similar to the first, but it was done especially to measure the shock brightness and velocity. The camera view was from the side instead of from the top, so the real shape of the shock could be recorded. There were two shots , UV-15 (C-5082) and UV-16 (C-5083), and two image-intensifier photographs are taken of each, so there are four records, and each record has two sides. The container for the argon was a plywood box, constructed in the shape of a cube approximately 600 mm on a side, with a glass window in one side. In addition to the camera records, the box had holes to allow ultraviolet light to reach detectors; these results are described separately. Photographs were taken at 50.0 and 70.0 ps after detonation. One of the later photographs is shown in Fig. 13. The angle of the shock wave to the cylinder axis was meas-ured along both sides of the picture in all the pictures. The shock shape is nearly steady (un-changing in time) for all but the outermost parts, and velocities can be obtained from the angles by using the steady detonation velocity (along the explosive stick) , which is 8.75 mm/ps, in the equation U = D sin 6. The results are given in Table III. The distance in this table is the posi-tion behind the detonation front. By invoking the steady flow assumption, distance can be converted to time, and the velocity at that time used with the intensity vs time record from the stationary ultraviolet detector positioned on the centerline. The flow in the outermost parts is not steady, because it is driven by the first segment which has no explosive behind it (Fig. 12), and the
scat-tering of readable points in the table shows where it deviates. The results are plotted in Fig. 14, where it is easy to see how the points from the non stead y flow leave the smooth curve. The steady part is given by the least-squares fit
.
U = 1.138 exp(-t/6.20) + 4.866 - 0.01632 t.
.
.
,
600 500 400 :300 200 100 0 L n
o
100
200
300
400
mm
Fig. 12. Shock positions found by analysis of the photographs. Experimental points are measured positions of the perturbation rings seen- in the shock wave. From other experiments done earlier, the shock angle was known to be about 42° initially, and the particle motion was known to make an angle of about 55° with the axis.
Distance ~ 0.0 50.8 101.6 152.4 203.2 203.2 254.0 254.0 304.8 355.6 Integration gives
L- = 7.056[1 -exp(-t/6.20)] + 4.866 t - 0.00816 t2.
The third experiment, UV-23, was similar to the first and second, but with an important differ-ence. The cylinder of explosive was initiated along its axis, simultaneously, rather than from one end. The detonation wave propagated outward from the axis, and drove the argon gas in the direction of its own motion. This
higher initial velocity instead of being cone cylindrical.
Simultaneous axial
arrangement gives a much to the argon shock, and, shaped, the shock wave is
initiation was obtained using a line-wave generator, diagrmnmed in Fig. 15. The explosive is an extrudable composition that is cured after extrusion so it becomes a stable, rubbery solid . It is held in a plastic form that has the spaces for the explosive tracks. It works be-cause the detonation runs the same distance in each track, and thus arrives at the end, the line, at the same time at each point. Two line-wave generators were inserted into a groove cut into the axis of the explosive cylinder. The line-wave generators stick out of the cylinder, and therefore the shock wave is not a complete cy~der. We be-lieve that the presence of the remains of the lfne-wave generators does not seriously perturb the remainder of the shock wave.
TABLE III
ARGON SHOCK VELOCITIES
[image:17.606.66.277.49.327.2]10
9
8
z +7
E E
06
5
4
I I I I I
31 I [ 1, I I
o [0 20 30 40 50
t (/.ls)
Fig. 14. Plot of shock velocity vs time for the second and third experiments. The lower curve is for the end-initiated second experiment. The points depart from a smooth curve where the flow has not yet become steady. There are two parts to it because there were photographs taken at two times. The upper curve is for the axially initiated third experiment. The outward-directed detonation wave gives a high initial shock velocity.
Two image-intensifier cameras were used to view the cylindrical shock wave, with a beamsplit-ter sending light from the same lens to each in-tensifier. A photograph taken at 16.74 MS after the detonation reached the surface of the explo-sive is shown in Fig. 16. The perturbation on the left in the picture was caused by the joint between the two line-wave generators. The ad-ditional perturbations in the right half arise from the early shocking of some of the explosive through the thin cover of the line-wave generators. These have been removed in later assemblies by adding a brass cover to the line-wave generator. The per-turbation from tie interaction of the two line-wave generators remains. The picture is printed at high contrast, so the perturbations are enhanced. The other image-intensifier camera was pulsed four times,
Plastic body
Trocks of extrudoble explosive
\
1
\ P 7
Fig. 15.
giving a
\
hitioting track’ Thin cover
t
\
Lineof ini+iotion
Explosive
cylinder along cylinder oxis
Diagram of a line-wave generator, and end view of the axially initiated explosive charge. The line-wave generator is ini-tiated at one point, and the detonation wave in the tracks of extrudable explo-sive runs the same distance in every track. The explosive is contained in the thick plastic form, and has only a thin cover over it.
multiple exposure of the shock wave. The photograph is shown in Fig. 17. The times of the exposures were 2.23 ps, 7.23 ps, 14.20 ps, and 30.23 ps after the detonation Wave reached the ex-plosive surface. The time that the detonation wave reached the surface was detected by electrical switches on the surface; these also served to check that the wave reached the surface points nearly simultaneously. In addition to the camera records, the experiment also used photodetectors. The intensity rise at the instant the wave reached the wall of the box and reflected showed in the oscil-loscope traces, and gave the time of that event. In all, then, there are five time-distance pairs from the photographs, one from the explosive sur-face switches, and one from the photodetectors. The values are given in Table IV. These data are well represented by the least-squares fit
r = 8.322[1 - exp(-t/2.77)] + 6.679 t -0.0318 t2 .
.
I - -: --r.--=.-: .-, i&,- ,, ~
1
...
9-.*.*4,“~
4.,
1’””-
-.
“s -,O,wm
[-”
“
i,.
‘
●.
●7
*’+. -0’ **. ,-. .- ●.*.S “L- +.-,
“*.*@lw.d’8 #;
1’
‘1TAME IV
DISTANCE-TIUS VALUSS FOR THS AXIALLY INITIATED CYLINDSS
&
0.0 2.23 7.23 14.20 16.74 30.23 51.15A_
0.0 19.6 55.1 96.6 110.6 181.6 266.7 ‘Calc @l 0.0 19.8 54.6 96.7 111.2 181.2 266.8 ‘talc (Cdw) 10.18 7.91 6.39 5.78 5.62 4.76 3.43This fit can be differentiated to get the velocity as
U = 3.50 exp(-t/2.377) + 6.679 -0.0636 t .
The calculated values are also listed in the table. The form used for these fits was chosen by trial and error, and has no physical basis. The initial velocity seems too high, and reflects the difficulty of fitting where the curve is very steep. The ve-locity behavior is the upper curve in Fig. 14.
The curve of velocity vs time for the axially initiated explosive lies above the curve for end-initiated explosive. The shock wave is much stronger, initially, when the shock is driven in the direction the detonation was going. At late times, the curves would probably cross if the end-initiated explosive cylinder were long enough to be steady at those times. This is because the strong shock leaves more energy in the gas behind the radiating shock front, as it has been at a higher temperature and, even though it has expanded, it is still at a higher temperature.
Although it is well known that the expansion of gases from a cylinder forms additional shocks behind the main shock, these data do not show their presence. The photodetector data are also almost smooth, with only faint indications of any accelerations of the front. Apparently the extra shocks have little effect. The smooth fits given here seem to be adequate.
When the distance-time fits given here are used to calculate the radiating area, one must remember that the radial distance for them was measured from the explosive surface. The real radius is obtained by adding the radius of the explosive stick, 25.4 mm, to the distances given by the fit.
B. Ultraviolet and Visible Emission from RadiaLly Expanding Shock Waves in Argon
The previous subsection has described non-radiometric measurements made on radially ex-panding shocks in argon. In the latter three of these tests, radiometers previously described were used to measure the temperature of the shock fronts.
In tests UV-15, 16 the end-initiated stick of HE and the resulting shock shown in Fig. 13 were observed by 280-nm radiometers through two holes bored in one wall of the plywood enclosure. These holes were at the appropriate height in the box wall such that the detectors viewed into the box near the midplane of the vertical explosive. One detector viewed through its hole at normal incid-ence to the surface of the HE cylinder. The other view line was paratlel to this one but offset
18 cm horizontally from the first. That is, it observed the radial shock expansion obliquely.
The two signals from Test UV- 16 are shown in Fig. 18. These traces began 20.0 ps after the trigger pulse to the detonator. The detector having the normal view of the HE stick shows the time required for the detonation wave to reach the height of the detector’s field of view on the stick. The detector having the oblique view begins seeing light later because the shock front must also travel out ward from the stick before reaching its field of view. [The “normal” and “oblique” are used for brevity; the normal view is colinear with a radial component of the expanding front. Since the front is conical over much of its area, the normal detec-tor line of sight is at a vertical angle (-35°) to the shock front. The oblique detector is also at this vertical angle in addition to viewing obliquely to the radial component] . The slow upward ramp at early times in the normal view results from light scattered onto the detector from various parts of the box. The large bump on the tail of the other signal is due to the explosive fireball entering the field of view of this detector.
We have determined the temperatures observed by each detector during each test. The tempera-ture changes with time during the test as shown in Fig. 18, so we have shown two temperatures for each light pulse. The temperatures are shown in
Fig. 17. Multiple-exposure photograph of the cylindrically expanding shock wave. These four super-imposed photographs give the wave position at four precisely known times. Shot No. C-5101-D.
Test UV-23.
2 mv
lops
G
I
I
NORMAL
VIEW
OBLIQUE
VIEW
Fig. 18. Radiometer signals from Test UV-16 at
A-280 nm.
Table V, where time begins at the detonator trig-ger. (Remember that for UV - 16, shown in Fig. 18, there is a 20-ps delay). The first time listed for the normal incidence view corresponds to the peak of this light pulse, while the second time refers to the peak of the oblique-view detector. This time entry and the last one permit a comparison between the two views at the same time. These latter two times are 4 ps earlier for UV-16 than for UV- 15, apparently because of a small difference in the hole separations in the two enclosures.
Table V shows good agreement between the two tests for similar positions on the light pulses. The larger uncertainties for the later time entries for the normal-view detector are due to the uncertainty in the baseline position as discussed above.
The temperatures recorded here are less than the 25-kK values for planar geometries because the shock velocity is considerably less in this end-initiated, radially expanding conf igu ration. In this case the initial shock velocity was measured to be 6 mm/ps compared with 9 mm/ps in the planar case (with argon). Azimuthal symmetry, shown. to aPPIY to these shocks in Fig. 11, suggests that for times at which both detectors see the shock front, the measured temperatures should be equal. Table V shows that this is not the case. The 2,000- to
TAMS V
RADIAL-SHOCKT2HPERA27MSSAT VAR1OIIST1tiWi
~
~
Time+, IIS Temerauce, KIN-15 Normal 48 18,500 i 500
74 16,600 t 1300 98 15,000 : 1700
Oblique 76 14,700 i zoo
98 12,100 f. 200
w-16 No-1 48 18,500 i 500 70 16,800 i 1200 96 14,200 s 1300
Oblique 70 14,300 i 200
94 10,8FXI t 200
*
Tme elapsed betwma trisger pulse t. detonator and ceadins of radimewr ‘,8”.1
3, 000-K lesser temperature for the oblique view may be due to the longer argon pathlength or a wall in-teraction layer for that detector. If the shock is emitting as a perfect blackbody, the radiance, and therefore temperature, should be independent of the angle of incidence at which the detector views the shock front.
In Test UV-23 the explosive charge and en-closure were similar to those just described. How-ever, the cylindrical explosive was simultaneously initiated along its axis resulting in a shock front of cylindrical shape. Radiometers calibrated at A = 280 nm and A = 520 nm monitored the expanding shock normal to its surface. The resulting sig-nals are shown in Fig. 19.
From these radiometer signals we can deter-mine the shock front temperature at various times during its travel to the enclosure walls. These data may be combined with the velocity values from Table IV for a plot of brightness tempera-ture vs shock velocity shown in Fig. 20. Tem-peratures corresponding to faster motion of the shock exhibit good agreement between the two wavelengths and to the similar temperatures meas-ured for the 9-mm/ps shocks in planar argon shocks . The increasing discrepancy between the measurements at the two wavelengths with decreas-ing shock velocity is puzzling and unexpected. It is reasonable to speculate that, because of the time sequence of the points in Fig. 20, the faster re-duction in the uv temperature with shock velocity
.
,
.
,
RADIATION FROM CYLINDRICAL SHOT
LWG INITIATION
2“+x30” LONG 9501 IN 2’ CUBICAL BOX
10mV lops
❑
A= 280 nm TB =25,000 K
Fig. 20.
Radiometer signals from Test UV-23.
2mV lops
m
I I 1 1 1 1 ! t 1 I
J
X=520nm TB = 26,000 K
at
A =
280 and 520 nmTEST UV -23
0~=520nm
O ~.zsonm
c1 no 8 Cl.
“ hUV-15,16
o 0
44s (mm/@)
1
Dependence of the brightness tempera-ture on the shock velocity for a cylin-drically expanding shock wave in argon gas. With the exception of point marked otherwise, the data are from different times of expansion in Test UV-23. See Table IV and Fig. 19.
may be due to a light-induced absorption process occurring between the shock wave and the detec-tor. Since there was no window over the enclo-sure aperture through which the source was ob-served, vacuum ultraviolet radiation may have created absorbing species (e. g. , excited oxygen or ozone) in the air path.
Further examination of the radiating proper-ties of the expanding shock front is instructive. In Table VI the shock radius, area, and measured temperature are tabulated for various times, along with the total radiant emittance (oT4), the spec-tral emittance for A = 280 nm, and these latter two quantities integrated over the shock front area. Since the length of explosive was 30 cm, this value was used in computing the radiating area. While Fig. 16 shows that in this test many disturbances reduce the effective shock area, we are assuming that more sophisticated initiation techniques would eliminate these cooler regions and allow uniform emission from the full cylindrical surface.
Since the temperature drops as the shock expands, both M and MA must fall SISO. However, the total radiated power from the total shock sur-face rises as the shock expands up through at least t = 30 ps. The spectral emittance at A = 280 nm rises even faster and continues to do so through at least 50 ps where it apparently is close to peaking.
An approximate time integration over the pulse of Fig. 19 shows a total radiated energy of this source to be - 2 x 10⁵ J during the first 50 ps. The explosive energy release from this quantity of 9501 high explosive is known to be 5 x 10⁶ J. The radiation yield is then 4%. The yield into specified bands within the radiation spectrum can be similarly determined. The greater mechanical coupling of the explosive energy to heavier gases indicates that a significantly greater efficiency would be realized. The data of Table II combined
4
TABLE VI
SAOIOtlETRIC PROPERTIES OF CYLISORICAL SMOCK SVSFACE UV-23
A=, Cmz H = UT&b
%= A6=4 A~HA
2nr~2 ~ Ma
ye. w -CM-2 w-cm-z-m-l w w-rim- ‘
o+ 2.54 479 26.2 2.67x10⁶ 3.56x10³ 1.28x10⁹ 1.7 OX1O6 7.23 8.05 1517 24.8 2.15x10⁶ 3.13X10³ 3.25X10⁹ 4.75X10⁶ 14.20 12.2 2300 22.8 I .53X106 2.55x10³ 3.52XI09 5.87x10⁶ 30.23 20.7 3902 21..4 1.19XI06 2. 17X103 4.64x10⁹ S.45X106 51.15 29.2 5506 19.1 7.55X10⁵ 1.58x10³ 4. 16x109 8.71x10⁶
.
.
“Temperature measured by A = 520 radiometer. b
ToL.1 radi. md power per square centimeter, emittance, Of shock surface. c
spectral ●mit Lance at A = 280 nm.
Iv.
DISCUSSION AND COMPARISON WITH OTHER RESULTSOptical radiation from shock fronts has been investigated both experimentally and theoretically for several decades. Zel’ dovich and Raizer in their textbook6 discuss this subject in some detail, with particular emphasis on shock waves in air. Of interest here is that for shock waves of the strength used in our studies the front radiates as a blackbody. They also treat in detail the phenom-enon of the preheating layer. This layer lies in front of the radiating shock front and attenuates the light on its path to the detection system. Hard ultraviolet radiation, from sufficiently hot shock fronts, induces opacity in the otherwise cold gas through photoionization, photoexcitation, and photochemistry in this layer. Screening of the shock front from the detectors therefore occurs, whose magnitude increases strongly with shock velocity and which depends also upon the gas and wavelength being observed. For example, in air strong screening occurs for shock temperatures in
6
excess of 90,000 K, beyond which the optically
measured brightness temperature is substantially less than the true temperature behind the front.
It is well known that the absorption of oxy-gen begins at 186 nm and extends downward into the harder ultraviolet. For the brightness tempera-tures of -25 kK measured in our experiments, the emission peak of the corresponding blackbody radi-ation occurs at a A = 116 nm. At this wavelength the absorption coefficient of air6 is -1 ~. cm- 1 For experiments conducted here without a window
over the source aperture, light-induced phenomena in the air path are expected. This is the likely source of absorption bands observed in the time-resolved spectra reported in Section II.
Zatsepin et al.7 have measured the lumin-escence of shock f rents in air, argon, and xenon over a large range of shock velocities. Brightness of the fronts was observed at 330, 430, and 560 nm and at angles of incidence to the shock front of 90° and 45°. One important result from this work was that at higher velocities the normal-incidence radiation usually indicated a significantly higher temperature than the 45° radiation. In this respect, our results of Table V are consistent with theirs. They ascribe this behavior to the greater pathlength through the absorbing preheating layer for the oblique path. According to their results at lower velocities, however, the opacity of the preheating layer should be insufficient to affect this difference at our velocities. However, they do point out that for longer light pulses the screening layer can be more absorbing. The duration of our light pulses appears to be much longer than theirs, so a screening layer could, have been responsible for the temperature differ-ences in Table V.
Available data for shock waves in argon are plotted in Fig. 21. The ultraviolet points from Ref. 7 are shown along with Soviet theoretical predictions. Also included are data points from
8 this work and theoretical curves of Kerley. A single data point from each of the works of Zinn et
1
al. , Model’, 9 and Kiselev and Krokhin 10 is also
.
.
34
I +’
32
:’/’
--- KERLEY THEORY — SOVIE T THEORY
●
2e
i
,’
❑z
S
24❑, A
❑ i. Fig. 21 plotted. 20 16 12 I
/7
❑ ,“a
Ae,l / 4 ❑:1
10 I AIIt
‘1 I 1 I A UV,VISIBLE, CONGER,of al A w, CUR RESULTS●UV.ZATSEPIN,OI al Cl GREEN,OUR OATA
●tEEEN, ZATSEPIN,al @/lslS4E, ZINN. ot d
■RED, MODEL’ O BLUE, KISELEV and
KROKHIN
●SIUJf , ROTH
o 4 12 16
U: (km/s)
Measured and theoretical brightness temperatures of shock fronts in argon gas as a function of shock velocity. Our points are from cylindrical expansions (UV-23), except for those poizits with error bars that represent averages of planar shock results.
The experimental points from Zatsepin et al. are in excellent agreement with Soviet equa-tion-of-state theory up to shock velocities of 14 km/see, where subsequent departure from theory is attributed to the screening layer. Our ultra-violet data are in very good agreement with Soviet theory. Our 520-nm data show substantial depart-ure from the Soviet curve in Fig. 21. We do not know why our 520-nm points are above the curve for the cylindrical tests and below it for the aver-age of planar shocks. For both visible and UV, our data indicate a fall-off from the trend for the higher velocities. Zatsepin et al. do not observe this fall-off until velocities of 15 km/see are reached. The data point from Model’ in Fig. 21 represents a large departure from theory.
In Fig. 22 available brightness temperature data for xenon are shown along with theoretical curves. Most of the points are from Zatsepin et al. recorded at A = 430 nm. One point each from our work and from Model’ is included. It is thought that the screening layer is responsible for
7
most of the points lying below the curve. Again , however, our results agree rather well with those
L
4 8 12 16,
.
●
U, (km/s)
Fig. 22. Measured and theoretical brightness tem-peratures of shock front in xenon gas as a function of shock velocity. Our datum is from planar shock wave studies.
from Ref. 7. Kerley’s theory 8. M in excellent agreement with our results. He also computed temperatures for argon at PO = 0.006 gin/cc density (-4.6 local atmospheres), obtaining -10% higher temperatures near 9 mm/ps shock velocities than at 1 atm. This result also agrees with our data, shown in Fig. 7.
Other rare gases have been investigated, but less extensively. Model’ reportsg a tempera-ture of 34 kK for a 17.2 -km/see shock wave in krypton. Rothll measured 38 kK for a velocity of 8.3 km/see, somewhat higher than our value of 30 kK. Tsikufi and POPOV 12 report a tempera-ture of 32 kK at A = 280 nm and at a velocity of 8-9 km/see. Our value, obtained at that wave-length and similar shock velocity, is in good agree-ment with this result.
For neon, also, the measurements of Tsikulizz 12
and Popov are in very good agreement with our results, shown in Table II.
Zatsepin et al.7 observed that a 5%, air admixture to argon greatly reduced the brightness tempera-ture of the shock front at velocities above 10 mm/ ps.
v.
SUMMARY AND CONCLUSIONSHigh explosives have been used to shock-heat rare gases to measured brightness temperatures
Up to 36,000 K. The area of the radiating shock fronts was large in both the planar and cylindrical geometries used. Close agreement between temper-atures measured at both ultraviolet and visible wavelengths indicates that the sources are black-body radiators. The continuous nature of the emission spectrum of the shockfront supports this conclusion.
The planar shocks reported here had radi-ating areas of 75 cm2. Shock waves through ar-gon gas were studied extensively. At a local one atmosphere the temperature measured for the emis-sion from an argon shock at its peak velocity of 9 mm/ps was 25 kK. At six times this pressure, the measured temperature was approximately 10% higher. Up to 50 torr of a rather large molecule, C3F71, did not affect the temperature of the shock for 1 atm argon.
Substitution of other rare gases into the shock tube resulted in some measured emission signals that are proportional to the square root of the atomic weights. For Xe a peak temperature of 36 kK was measured.
In radially expanding shock waves, stable large-area fronts in argon were observed. The temperatures and profiles of shock fronts were measured using two initiation schemes. Tempera-ture and velocity as a function of time were deter-mined and compared with results of other research.
For the axially initiated explosive, a cylin-drical shock wave having an area beginning at 480 cm2 and expanding to 5500 cm2 was studied. During this expansion, the temperature fell from 26 kK to 19 kK, but the area-integrated radia-tion from the front continued to rise over the full 50-ps observation time. The total optical
energy radiated according to a blackbody calcu-lation was 2 x 10⁵ J for an explosive energy to optical energy yield of 4%. Greater efficiencies using xenon can be expected.
REFERENCES
1.
2. 3. 4. 5. 6. 7. 8. 9. 10. 11. 12.J. Zinn, W. C. Davis, T. R. Schwartz, R. C. Anderson, and W. D. Gould, “Theoretical and Experimental Studies of Strong Shock Waves in Air, ” Proceedings of the DNA Atmospheric Effects Symposium, San Diego, April 1973.
R. G. Shreffler and R. H. Christian, “Boun-dary Disturbances in High-Explosive Shock Tubes, ” J. Appl. Phys. ~, 324-331 (1954).
The calibration procedure for the 280-nm de-tector is described in Internal Memorandum AP-2-80:240. The 520-nm radiometer was calibrated in a similar fashion against a quartz-halogen standard lamp.
B. Brixner, “Rotating-Mirror Sweeping-Image Spectrograph, ” Rev. Sci. Instr. ~, 287-288 ( 1967).
E. D. Loughran, WX-2, used a mass spec-trometer to quantitatively analyze samples obtained from each flash charge just prior to firing the shot.
Ya. B. Zel’dovich and Yu. P. Raizer, Physics of Shockwaves and High-Temperature Hydro-dynamic Phenomena (Academic Press, New York, 1966).
Y. A. Zatsepin, E. G. Popov, and M. A. Tsikulin , “Luminance of Shock Wave Fronts in Certain Gases, ” Sov. Phys. JETP ~,63-66 (1968).
G. Kerley, X-7, Unpublished Los Alamos Results ( 1982). He used ionization equilibrium theory described in LA-8062.
1. Sh. Model’, “Measurement of High Temper-atures in Strong Shock Waves in Gases, ” Sov. Phys . JETP ~, 589-601 (1957).
Yu. N. Kuselev and V. Z. Krokhi.n, “Meas-urement of Radiation from Strong Shock Waves in Gases Using Low-inertia Pyroelectric Detec-tors, ” Translated from Fiz. Goreniya i Vzryva Q, 956-959 (1976).
J . Roth, “Measured Temperatures of Strong Shock Waves in Argon, ” J. Appl. Phys. ~, 1429-1433 ( 1964).
M. A. Tsikulin and Ye. G. Popovj Radiating Properties of Shock Waves in Gases (Nauka, Novosibirsk, 1977) .
.
.
W-N Pace Rsnse Pri= Code
Primed in Ihe UniM Slates of A-, . .
Available fmm Nuiwml Teehmcd Information Savti
US Depwtmcnt ofCommcme
526S Poft Royal Rood Spnn~ekL VA 22161
Micmfxhe IAOI)
NTIS
Page Range Wet Code
NTIS Page Rm~e Prlu Code 1331025 A02
026.050 A03
05 I 07s A04 076. IW AOS 101.125 ACM 126.150 A07
151.17s AOS 176.200 AW ml .Ln AIO 226.2S0 .411 2S1 27$ A12 276.100 A13
JOI 125 A 14
326.1S0 AIS 351.375 A16 3?6 400 A17 Jol.423 A18 4:6450 A19
431.475 A20 476.500 A21
SO1525 A22
S26-SS0 A2.S
S31.S7S A24
S76.600 A23