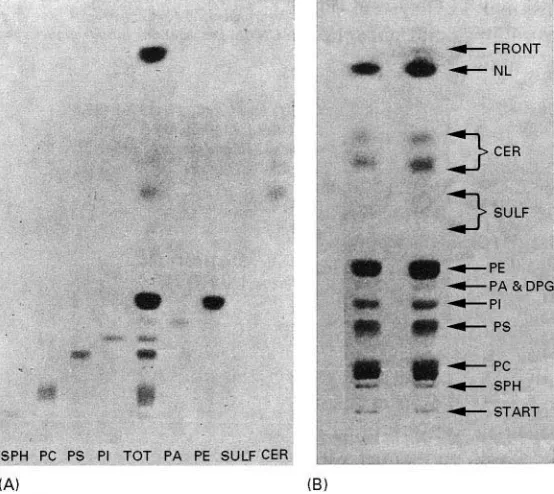
Figure 1 Chromatograms of standard lipids in the solvent methyl acetate}n-propanol}chloroform}methanol}0.25%aqueous KCI (25 : 25 : 25 : 10 : 9). (A) Separation on 10;10 cm HPTLC plate; (B) separation on classical pre-coated silica gel plate, 10;20 cm. NL, Neutral lipids; CER, cerebrosides; SULF, sulfatides; PE, phosphatidylethanolamine; PA, phosphatidic acid; DPG, cardiolipin; PI, phosphatidylinositol; PS, phosphatidylserine; PC, phosphatidylcholine; SPH, sphingomyelin. Staining: molybdate reagent. (Repro-duced with permission from Vitiello F and Zanetta J-P (1973) Thin-layer chromatography of phospholipids.Journal of Chromatography 166: 637.)
Modes of Development: Conventional
T. H. Dzido, Medical Academy, Lublin, Poland
Copyright^ 2000 Academic Press
In the conventional mode of development in planar chromatography the mobile phase is supplied to the chromatographic plate by direct contact with the adsorbent layer and the Sow rate of the eluent is controlled by capillary forces.
The main modes of chromatogram development are linear, circular and anticircular. The most popular mode is linear development owing to its simplicity; no sophisticated equipment is used to apply the eluent to the chromatographic plate, as it is in circular and anticircular modes. In practice, linear development provides the resolution and reproducibility required for most qualitative and quantitative determinations. All three modes can be extended by applying continu-ous or multiple development.
Linear Development
Linear development is usually performed in a rectan-gular vessel with ascending migration of the eluent
through the adsorbent layer, from the bottom to the top of the chromatographic plate. The plate is usually positioned vertically in the developing chamber in a few millilitres of solvent. The separation of a stan-dard lipid mixture by this mode of development is presented inFigure 1AandBby way of example. The separations were performed on a 10;10 cm pre-coated silica gel plate for high performance thin-layer chromatography (TLC), and on a conventional 20;20 cm plate (E. Merck) with eluent composed of methyl acetate}n-propanol}chloroform}methanol} 0.25% aqueous potassium chloride (25 : 25 : 25 : 10 : 9). A conventional developing chamber (rectangu-lar vessel) was lined withRlter paper in order to ensure saturation of the vapour phase with the solvent. Samples were applied on the start line of the chrom-atographic plate in the form of streaks containing 0.5}3.0g mL\1 phosphorous lipid. The
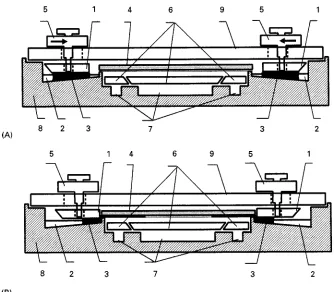
Figure 2 Cross-section of the horizontal DS chamber (Chromdes) (A) before and (B) during development from two opposite edges of the plate. 1, Reservoir cover plates; 2, eluent reservoirs; 3, eluent (black area); 4, chromatographic plate; 5, eluent distributor; 6, trough cover plates; 7, troughs; 8, body of the chamber; 9, glass cover plate.
phosphatidylserine, phosphatidylcholine and sphin-gomyelin are well separated. In addition, cerebrosides with nonhydroxylated fatty acid chains are separated from those with hydroxylated chains. Similar resolu-tion is observed for sulfatides. The minor brain phos-pholipids, phosphatic acid and diphosphatidyl-glycerol show the same migration distance but are well separated from phosphatidylethanolamine and phosphatidylinositol.
Slightly better efRciency can be obtained in hori-zontal chambers. Solvent migration is not dependent on gravity and equilibration between vapour and liquid is more rapid and uniform (inner chamber volume is small). A cross-section of the horizontal DS (Dzido, SoczewinHski) chamber (Chromdes, Lublin, Poland) is shown inFigure 2. Eluent can be supplied to the chromatographic plate simultaneously from its opposite edges so that the number of separated sam-ples can be doubled in comparison to development in a vertical chamber. An example of this type of linear development is illustrated inFigure 3. The samples of a test dye-stuff mixture were spotted along two oppo-site edges of the 10;20 cm high performance TLC plate coated with silica gel. The plate was developed with toluene from opposite directions
simulta-neously. The development stops when both eluent fronts meet each other in the middle of the plate.
Another variation of linear development can be performed by changing the eluent composition during the development process (stepwise or continuous gradient elution). Samples containing components of a wide range of polarity cannot be readily separated in a single isocratic development, but the application of a gradient mobile phase can improve the separ-ation. Figure 4 demonstrates the application of a simple stepwise gradient to increase the separation efRciency of aromatic amines. The separation was performed in an equilibrium sandwich horizontal chamber which allows delivery of very small volumes of eluent to the plate. The glass plates (5;20 cm) were covered with a 0.25 mm layer of silica gel, dried in air and activated for 1 h at 803C and 2 h at 1303C. The solutes were spotted 4 cm behind the solvent front as 0.5% benzene solutions to avoid solvent demixing. A marker (azobenzene,RF"1 was spotted
Figure 3 Separation of dyestuff mixture from opposite directions on silica gel high performance TLC plate with toluene. 1, 4-chloro-4 -dimethylaminoazobenzene; 2, fast yellow; 3, 2-nitroaniline; 4, 4-nitroaniline; 5, phenol red.
Figure 4 RFvalues of aromatic amines obtained on silica gel plate. (a,c) Isocratic development with 5 and 50%solutions of methyl ethyl ketone in cyclohexane, respectively; (b) stepwise development with both solvents. Open squares, N,N-dimethylani-line; open triangles, N-ethylaniline; open circles, aniline; dia-monds, 2-phenylenediamine, filled squares, 3-phenylenediamine; filled triangles, 4-phenylenediamine; filled circles, 3-amino-pyridine. (Reproduced with permission from SoczewinHski E and CzapinHska K (1979) Stepwise gradient development in sandwich tanks for quasi-column thin-layer chromatography. Journal of Chromatography 168: 230.)
in cyclohexane and chromatogram (B) with a two-step gradient was performed in the following manner. The plate wasRrst developed with 5% methyl ethyl ketone. When the azobenzene spot has reached the middle of the plate the development was continued with 50% methyl ethyl ketone until the eluent front (with the azobenzene spot) has migrated to the end of the plate which protruded from the chamber. The plate
was dried and the spots were detected by spraying with aqueous sodium hydrogen carbonate and then with bis-diazotized benzidine. All the spots are well separated using the two-step gradient development as opposed to separation by isocratic development.
Figure 5 shows the densitogram of a mixture of glycosides obtained by stepwise gradient develop-ment with seven eluent fractions which were applied consecutively to the plate (pre-coated silica gel glass plate for HPTLC, 10;10 cm, E. Merck) using a hori-zontal DS chamber. The volumes and compositions of eluent fractions as solutions of methanol in ethyl acetate were as follows: (1) 0.22 ml 0.0%; (2) 0.11 ml 20%; (3) 0.11 ml 30%; (4) 0.11 ml 2%; (5) 0.11 ml 10%; (6) 0.11 ml 35%; (7) 0.11 ml 100%. Each fraction was introduced into the mobile phase reser-voir of the chamber with a micropipette after the previous one had been completely absorbed by the adsorbent layer. The plate was developed for a dis-tance of 8 cm and the glycosides were detected by spraying with a solution of chloramine in trich-loroacetic acid, heating for 5}10 min at 100}1103C and scanned with a Shimadzu CS-930 densitometer at 360 nm. The densitogram shows relatively good res-olution of the glycosides.
This kind of simple stepwise gradient elution can help solve difRcult separation problems, especially for mixtures consisting of solutes with a wide range of polarity, e.g. plant extracts. However, for more com-plicated stepwise gradients, poorer retention repro-ducibility is obtained.
Continuous Linear Development
[image:3.568.97.230.377.594.2]Figure 5 Densitogram of standard mixture of glycosides separ-ated on silica gel high performance TLC plate wtih stepwise gradient elution (gradient programme given in the text). 1, Acetyl-digitoxine; 2, strophantine; 3, digitaline; 4, desacetylolanatoside; 5, lanatoside; 6, convalatoxine; 7, digoxin; 8, digitixine. (Repro-duced with permission from Matysik G, Markowski W, Soc-zewinHski E and Polak B (1992) Computer aided optimization of stepwise gradient profiles in thin-layer chromatography. Chromatographia 34: 303.)
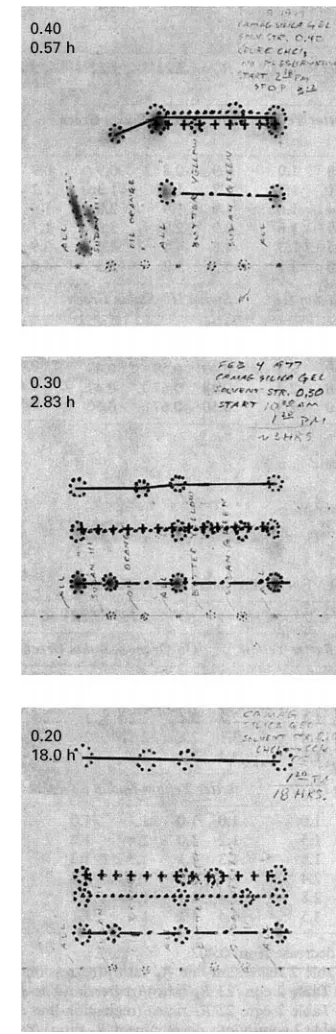
Figure 6 Separation of dye-stuff mixture applying continuous development on 10;10 cm silica gel plate with pure chloroform (eluent strength"0.40) and with solvent mixtures consisting of chloroform and carbon tetrachloride (eluent strength"0.30 and 0.20), solvent strength () marked in the left top corner of the plate. Continuous line, Oil orange; crosses, Butter yellow; dotted lines, Sudan green; dots and dashes, Sudan III. (Reproduced with permission from Perry JA (1979) Solvent strength, selectivity, and continuous development.Journal of Chromatography 165: 117.)
and ensuring that solvent migration is continuous and constant; development is performed over the entire length of the plate. Continuous development can also be performed using a very short distance (short bed/continuous development, SB/CD) in comparison to the normal plate length and the eluent strength should then be much weaker than in the conventional development, because several dead volumes of eluent migrate through the layer. Examples of chromato-grams with continuous development are shown in
Figure 6. Pure chloroform (eluent strength 0.40) and
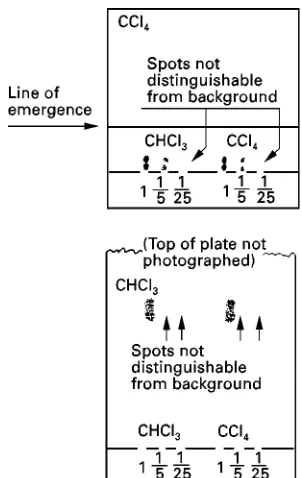
[image:4.568.315.483.101.618.2]Figure 7 Bottom: chromatogram of a conventional develop-ment on 20 cm long silica gel plate with RF values normally considered about optimal. Top: chromatogram of continuous de-velopment on 2.5 cm distance from the solvent level and 1.1 cm from the origin on silica gel plate with solvent of lower solvent stength, with RF values less than 0.05. (Reproduced with permission from Perry JA (1979) Solvent strength, selectivity, and continuous development. Journal of Chromatography 165: 117.)
Figure 8 Comparison of (A) conventional and (B) multiple de-velopment (4;5)#(3;7) min for the separation of a mixture of PAH standards. The mobile phase was methanol}water (4 : 1) and the stationary phase octadecylsilanized silica gel. 1, Cor-onene; 2, benzo[g,h,i]perylene; 3, benzo[a]pyrene; 4, benzo[a] anthracene; 5, fluoranthene. (Reproduced with permission from Butler HT, Coddens ME, Khatib S and Poole CF (1985) Deter-mination of polycyclic aromatic hydrocarbons in environmental samples by high performance thin-layer chromatography and fluorescence scanning densitometry.Journal of Chromatographic Science 23: 200.)
[image:5.568.326.467.380.595.2]New Berlin, WI, USA). Eluent strength of the mobile phase applied for the chromatograms shown in Figure 6 was 0.40, 0.30 and 0.20 (marked at the top left corner of each plate). The samples (Oil orange, Butter yellow, Sudan green and Sudan III) were spot-ted on the plate as benzene solutions. The emergence position (atmospheric boundary) of the plate from the chamber was 7.3 cm from the start line (position of the sample spotting) and 7.8 cm from the eluent level (immersion position of the plate in the solvent). An extraordinary increase in selectivity is observed with solvent of the lowest eluent strength (0.20). However, it is necessary to perform the development for a very long time (18 h) to maintain the same relative retentions as when using pure chloroform (0.57 h). A more efRcient separation can be obtained by applying continuous development over a very short distance. The two components of the sample (Oil orange and Sudan green) were separated using SB/CD on a silica gel G plate (10;10 cm, Camag, New Berlin, WI, USA) for 35 min with pure carbon tetrachloride. TheRFvalues obtained were less than
0.05 (Figure 7(top)). Evaporation of eluent from the plate was carried out at a position 2.5 cm from eluent level and 1.1 cm from the spotting position. For
com-parison, Figure 7 (bottom) demonstrates the results of a conventional development on a 20 cm long bed of the same adsorbent with chloroform as the devel-oping solvent, showingRFvalues of about 0.38 and
a development time of 90 min. The resolution ob-tained by the SB/CD mode is better than continuous mode and the development time is also shorter. Addi-tionally, the spot diameter is very small, which leads to better detection levels.
Multiple Development
Figure 10 Separation of a mixture of oestrogens by multiple chromatography with fixed solvent entry position (A) and by mul-tiple development with fixed (B) and variable (C) solvent entry position. Conditions are given in the text. The oestrogens, in order of migration, are 17-dihydroequilenin, 17-dihydroequilenin, 17-oestradiol, 17-oestradiol, equilenin and oestrone. (Repro-duced with permission from Poole SK and Poole CF (1992) Insights into mechanism and applications of unidimensional mul-tiple development in thin layer chromatography.Journal of Planar Chromatography 5: 221.)
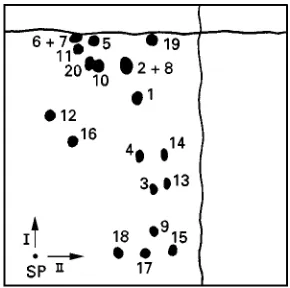
Figure 11 Two-dimensional chromatogram on RP-18 plate. Eluents: in the first direction, hexane}ethyl acetate}acetic acid (80 : 18 : 2); in the second direction, 1 mol L\1ammonia#3% potassium chloride in 60% methanol. SP"Starting point. 1, DNP-Gly; 2, DNP-Ala; 3, DNP-Ser; 4, DNP-Thr; 5, DNP-Val; 6, DNP-Leu; 7, DNP-Ile; 8, DNP-Pro; 9, DNP-Met-O2; 10, DNP-Trp; 11, DNP-Phe; 12, Di-DNP-Tyr; 13, DNP-Asp; 14, DNP-Glu; 15, DNP-CySO3Na; 16, Di-DNP-Lys; 17,-N-DNP-Arg; 18, Di-DNP-His; 19, DNP-OH; 20, DNP-NH2. (Reproduced with permission from Lepri L, Desideri PG and Heimler D (1982) High-perfor-mance thin-layer chromatography of 2,4-dinitrophenyl-amino acids on layers of RP-8, RP-18 and ammonium tungstophos-phate.Journal of Chromatography 235: 411.)
1. repetitive development with the same solvent in the same direction
2. repetitive development with the different solvents in the same direction
3. single or repetitive development in one direction with a given solvent, followed by single or repeti-tive development in the second direction perpen-dicular to it with another solvent (two-dimen-sional development)
TheRrst mode is especially applied to the separation of poorly resolved spots, the second to mixtures of a wide range of polarity, and the third mode to separation of complex mixtures with components of similar polarity and/or different polarity.
The example of separation of polyaromatic hy-drocarbons (PAH) by repetitive development with the same eluent is demonstrated in Figure 8B. The chromatogram was obtained with octadecyl silica layer and methanol}water (4 : 1) as eluent. Chrom-atogram developments were performed in an SB/CD chamber, position 4 (Regis Chemical Co.). TheRrst four developments were performed for 5 min each and the next three for 7 min each. Between developments the plate was dried using a stream of puriRed nitrogen. The same PAH mixture was also separated applying conventional single development with the same plate and eluent. Figure 8B clearly shows the advantage of multiple development, in comparison to conventional development (Figure 8A).
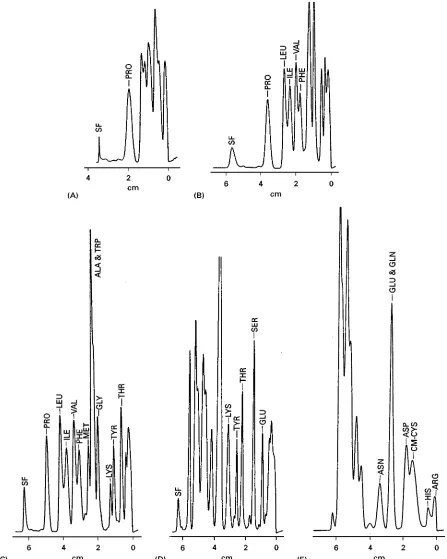
Multiple development using change in eluent strength (stepwise gradient development) of each de-velopment stage is suitable for the separation of sam-ples with a wide range of polarities. An example of this approach is shown inFigure 9for the separation of PTH-amino acid derivatives. Chromatography was performed on a 10;10 cm HPTLC plate coated with silica gel. The spots were applied 0.5 cm from the lower edge of the plate. The plate was developed in a short-bed continuous development chamber. The
Rrst development was made with methylene chloride for 5 min with a 3.5 cm development distance (Figure 9A). At this stage, only PTH-proline is well separated from the other derivatives. After evapor-ation of the methylene chloride, the second develop-ment was performed with methylene chloride} isop-ropanol (99 : 1 for 10 min with a 7.5 cm development distance). Figure 9B illustrates that Rve amino acid derivatives can be identiRed. The third consecutive development was made in the same way as the second (Figure 9C). The fourth step was obtained by devel-opment with methylene chloride}isopropanol (97 : 3) for 10 min (Figure 9D). The most polar PTH-amino acid derivatives are not resolved. Their resolution was achieved in the Rfth step with ethyl acetate}
acetonitrile}glacial acetic acid (74.3 : 25 : 0.7); only two derivatives (GLU, GLN) are not separated (Figure 9E).
[image:7.568.332.477.431.575.2]The separation efRciency of conventional multiple development can be further improved by moving the solvent entry to a higher position on the chromato-graphic plate for each successive development.
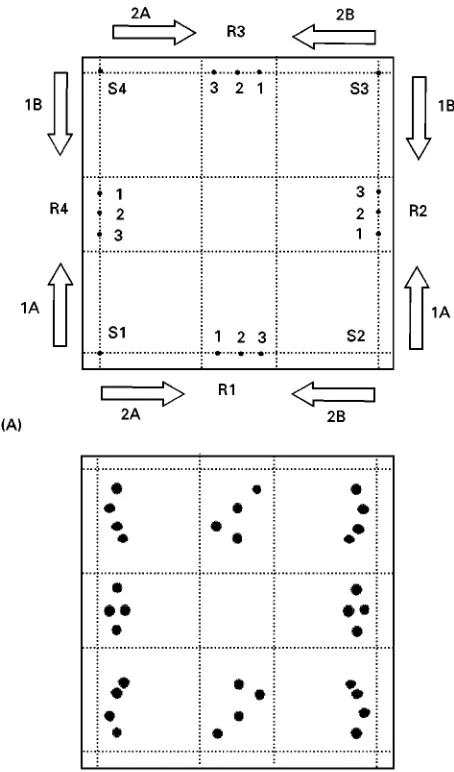
Figure 12 (A) Chromatographic plate prepared for separation of four samples by two-dimensional mode of development. (B) Four two-dimensional chromatograms of hormones on silica gel HPTLC plate, 10;10 cm. Eluents: the first direction (two devel-opments simultaneously), heptane}diethyl ether} dichloro-methane (4 : 3 : 2); the second direction (two developments simultaneously), chloroform}ethanol}benzene (36 : 1 : 4). 1, Zeranol; 2, trans-diethylstilbestrol and cis-diethylstilboestrol; 3 dienoestrol. (Part A reproduced from De Brabander HF, Smets F and Pottie G (1998) Faster and cheaper two-dimensional HPTLC using the ‘4;4’ mode.Journal of Planar Chromatography 1: 369.)
Figure 13 (A) Circular and (B) anticircular development. (Reproduced with permission from Bauer K, Gros L and Saur W (1991)Thin Layer Chromatography}An introduction, p. 36. Heidelberg: HuKthig Buch).
oestrogens on silica gel plates, 5;10 cm with a mobile phase of cyclohexane}ethyl acetate (3 : 1, v/v). The chromatograms were scanned at 280 nm. The poorest separation was obtained with simple multiple chromatography (Figure 10A); seven 7 cm developments with Rxed solvent entry position at the origin of the plate were used. Separation was improved using multiple development with incrementing times (or distances) of development.
Figure 10B shows the chromatogram using nine developments with an incremental increase of the time of each successive development according to the sequence 5, 6, 7, 8, 9, 10, 12, 13, 14 min. However, the best separation was achieved with an incremental increase in the development time, as above, and a variable solvent entry position (0.5 cm below the slowest zone in each development; Figure 10C).
[image:8.568.51.278.189.575.2]direc-Figure 14 Ring chromatograms of spot test. (A) samples are spotted on the chromatographic plate; (B) circular chromato-grams are developed with too weak a solvent (4), too strong a solvent (5) and a suitable one (6).
[image:9.568.293.516.409.630.2]Figure 15 Sugar separation: (A) high performance radial chromatography in the U-chamber, and (B) linear separation performed on high performance TLC plate. (Reproduced with permission from Vitek RK and Kent DM (1978) High performance radial chromatography.International Laboratory 73.
Figure 16 Circular chromatography on pre-coated silica gel high performance TLC plate. Lipophilic dyes, mobile phase; hexane}chloroform}NH3 70 : 30. (Reproduced with permission from Ripphahn J and Halpaap H (1977) Application of a new high-performance layer in quantitative thin-layer chromatography. In: Zlatkis A and Kaiser RE (eds)HPTLC High Performance Thin Layer Chromatography, p. 204. Amsterdam: Elsevier Science.
tion). After this development, the eluent is evaporated from the plate; the spots are positioned along the edge of the chromatographic plate. The plate is then ro-tated through 903and the next development is per-formed with the second eluent from the edge with the separated spots of theRrst development towards the opposite edge. The mixture can be redistributed on the entire plate surface if both eluents (or chromato-graphic systems) show a dramatic change in selectiv-ity. An example of this mode of separation is shown inFigure 11. Twenty DNP-amino acids were separ-ated using a reversed-phase layer. The sample volume was 0.2}0.3L. The spots were visualized in UV light (360 nm with a dried plate or 254 nm when wet). The migration distance was 6 cm. The separations were carried out at 253C using a Desaga thermostating chamber. The elution in the Rrst direction was per-formed with hexane}ethyl acetate}acetic acid (80 : 18 : 2) and in the second direction with 1 mol L\1 ammonia #30% potassium chloride in 60%
methanol.
Another variant of two-dimensional development is the separation of four samples on one plate instead of one sample on one plate. Figure 12 shows the application of this method to the separation of hor-mones. The silica gel plate, 10;10 cm, is divided into four sample zones and four reference zones, as shown in Figure 12A. The four samples (S1, S2, S3, S4) are spotted at each corner of the plate and the reference solutes on the four reference zones (R1, R2, R3, R4). The plate is introduced into a horizontal DS-chamber (Chromdes) or a linear developing chamber (Camag), which allows the development of the plate from two opposite directions simultaneously with eluent
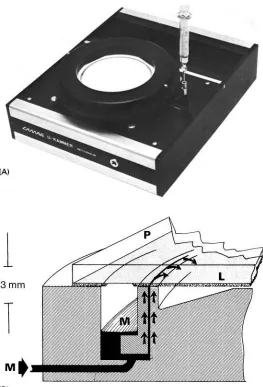
[image:9.568.49.281.484.666.2]Figure 17 Anticircular U-chamber (Camag). M, mobile phase; P, high performance TLC plate; L, layer. (Reproduced with permission from Bauer K, Gros L and Sauer W (1991)Thin Layer Chromatography}An Introduction, p. 41. Heidelberg: HuKthig Buch Verlag.)
5 min at 1003C. The chromatogram shown in Fig-ure 12B was observed in visible or UV light (366 nm).
Radial Development
There are two principal modes of radial development: circular and anticircular. In circular development the mobile phase is supplied at the centre of the chromatographic plate and eluent traverses towards the periphery (Figure 13A). The samples are spotted around the entry position of the mobile phase or are introduced (injected) into the stream of eluent just before its entry on the plate.
A very simple and probably the oldest application of circular development is the spot test, which is used for Rnding a suitable mobile-phase composition for TLC and HPTLC systems. The sample mixture is spotted on the adsorbent layer in several places and into the centre of each spot different solvents (pure or
occasionally mixtures chosen from the eluotropic series) are applied by a capillary or microsyringe. Then circular development provides ring chromato-grams. Different solvents result in various shapes of chromatograms (Figure 14). If a solvent of too low an eluent strength is used, the sample does not move. On the other hand, the sample forms a compressed ring on the outer circle of wetted adsorbent when too strong a solvent is applied. Concentric rings on the entire wetted surface appear when solvents of suitable eluent strength and selectivity are used.
Figure 18 Anticircular chromatogram. (Reproduced with per-mission from Fenimore DC and Davis CM (1981) High perfor-mance thin-layer chromatography.Analytical Chemistry 53: 252A.)
with sulfuric acid containing naphthoresorcinol by spraying or dipping with this reagent and heating at 1003C for 5 min. The spots near the origin are sym-metrical and compact but those further away are more compressed and elongated at right angles to the direc-tion of development. The sample was also separated in the same chromatographic system, but using linear development on a 10;10 cm plate (Figure 15B).
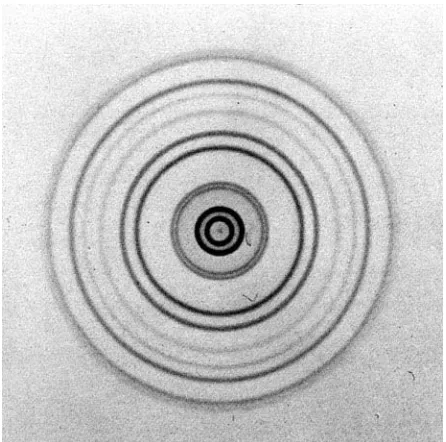
If the sample is introduced in the mobile-phase stream, then separated bands form concentric rings on the chromatographic plate, as shown inFigure 16. This circular chromatogram demonstrates the separ-ation of lipophilic dyes on a silica gel 60 F254 high
performance TLC pre-coated plate, 10;10 cm (E. Merck) with a mobile phase of hexane}chloroform} NH3, 70 : 30; the distance of development (from
en-try position of solvent to eluent front)"30 mm in a Camag U-chamber.
In the anticircular mode of development the mobile phase enters around the entire periphery of the adsor-bent layer which is usually formed as a circle by scraping unwanted adsorbent from a square plate.
The samples are applied on an outer circular starting line and development proceeds from the periphery of this circle layer to its centre (Figure 13B). This mode of development can be performed with a Camag anticircular U-chamber, shown inFigure 17.
Anticircular chromatography is seldom applied in practice. An example of a chromatogram obtained by this mode of development is given inFigure 18. The spots are compact near the origin and elongated in the direction of the mobile-phase migration.
Conclusions
Conventional modes of chromatogram development are often applied in analytical practice for both quali-tative and quantiquali-tative purposes. The most popular among the modes described is linear development. There are several reasons which contribute to this situation, including a simple operation procedure and low cost and time of analysis per sample. These fea-tures will still determine a future use of the modes in the analytical practice of planar chromatography in spite of increasing interest in the application of auto-mated and forced-Sow development.
See also: II/Chromatography: Thin-Layer (Planar): In-strumentation; Modes of Development: Forced Flow, Over-pressured Layer Chromatography and Centrifugal. Appendix 2 / Essential Guides to Method Development in Thin-Layer (Planar) Chromatography.
Further Reading
Geiss F (1987)Fundamentals of Thin-layer Chromatogra-phy(Planar Chromatography). Heidelberg: HuKthig. Grinberg N (ed.) (1990) Modern Thin-layer
Chromato-graphy. New York: Marcel Dekker.
Poole CF and Poole SK (1991) Chromatography Today. Amsterdam: Elsevier.
Sherma J and Fried B (1996) Handbook of Thin-layer Chromatography, 2nd edn. New York: Marcel Dekker. Zlatkis A and Kaiser RE (1977)HPTLC High Performance Thin Layer Chromatography. Amsterdam: Elsevier Science.
Modes of Development: Forced Flow, Overpressured Layer
Chromatography and Centrifugal
S. Nyiredy, Research Institute for Medicinal Plants, BudakalaHsz, Hungary
Copyright^ 2000 Academic Press
Introduction
Forced-Sow planar chromatographic separation can be achieved by application of external pressure
(over-pressured layer chromatography}OPLC), an electric